The 2018 Bolton Metropolitan Borough Council election took place on 3 May 2018 to elect members of Bolton Council in Greater Manchester, England. [1] This was on the same day as other local elections. The Labour Party retained overall control of the Council with a majority of 1.
Bolton Council, also called Bolton Metropolitan Borough Council is the local authority of the Metropolitan Borough of Bolton in Greater Manchester, England. It is a Metropolitan district council, one of ten in Greater Manchester and one of 36 in the Metropolitan Counties of England, and provides the majority of local government services in Bolton.
Greater Manchester is a metropolitan county in North West England, with a population of 2.8 million. It encompasses one of the largest metropolitan areas in the United Kingdom and comprises ten metropolitan boroughs: Bolton, Bury, Oldham, Rochdale, Stockport, Tameside, Trafford, Wigan, and the cities of Manchester and Salford. Greater Manchester was created on 1 April 1974 as a result of the Local Government Act 1972; and designated a functional city region on 1 April 2011.
21 seats were contested and the Conservative Party won 9 seats, the Labour Party won 8 seats, the Liberal Democrats won 2 seats, and Farnworth and Kearsley First won 2 seats. [2]
After the election, the total composition of the council was as follows:
The Labour Party is a centre-left political party in the United Kingdom which has been described as an alliance of social democrats, democratic socialists and trade unionists. The party's platform emphasises greater state intervention, social justice and strengthening workers' rights.
The Conservative Party, officially the Conservative and Unionist Party, is a centre-right political party in the United Kingdom. Presently led by Theresa May, it has been the governing party since 2010. It presently has 314 Members of Parliament in the House of Commons, 249 members of the House of Lords, and 18 members of the European Parliament. It also has 31 Members of the Scottish Parliament, 12 members of the Welsh Assembly, eight members of the London Assembly and 9,008 local councillors. One of the major parties of UK politics, it has formed the government on 45 occasions, more than any other party.
The UK Independence Party is a hard Eurosceptic, right-wing political party in the United Kingdom. It currently has one representative in the House of Lords and seven Members of the European Parliament (MEPs). It has four Assembly Members (AMs) in the National Assembly for Wales and one member in the London Assembly. The party reached its greatest level of success in the mid-2010s, when it gained two Members of Parliament and was the largest UK party in the European Parliament.
Bolton Metropolitan Borough Council election results | |||||||||||||||
---|---|---|---|---|---|---|---|---|---|---|---|---|---|---|---|
Party | Candidates | Votes | |||||||||||||
Stood | Elected | Gained | Unseated | Net | % of total | % | № | Net % | |||||||
Labour | 21 | 8 | 1 | 5 | 38.0 | 38.5 | 29,467 | ||||||||
Conservative | 21 | 9 | 2 | 0 | 42.8 | 34.0 | 26,084 | ||||||||
Liberal Democrat | 21 | 2 | 1 | 0 | 4.7 | 13.8 | 10,583 | ||||||||
Farnworth and Kearsley First | 3 | 2 | 2 | 0 | 9.5 | 5.8 | 4,460 | N/A | |||||||
UKIP | 7 | 0 | 0 | 1 | 0.0 | 2.9 | 2,263 | ||||||||
Green | 13 | 0 | 0 | 0 | 0.0 | 2.7 | 2,072 | ||||||||
Independent | 7 | 0 | 0 | 0 | 0.0 | 2.0 | 1,599 | ||||||||
Totals | 93 | 21 | 100.0 | 100.0 | 76,528 | ||||||||||
Prior to the election the composition of the council was:
35 | 17 | 3 | 4 | 1 |
Labour | Conservative | LD | U | FK |
After the election the composition of the council was:
31 | 19 | 4 | 3 | 3 |
Labour | Conservative | LD | U | FK |
LD - Liberal Democrats
U - UKIP
FK - Farnworth and Kearsley First
Party | Candidate | Votes | % | ± | |
---|---|---|---|---|---|
Conservative | John Walsh | 1,842 | 42.5 | +0.0 | |
Liberal Democrat | Warren Fox | 1,564 | 36.1 | +15.6 | |
Labour | Zulfi Jiva | 930 | 21.4 | -3.7 | |
Majority | 278 | 6.4 | -11.1 | ||
Turnout | 4,336 | 42.0 | -2.0 | ||
Conservative hold | Swing | UKIP to Lib Dem 12.7 | |||
Party | Candidate | Votes | % | ± | |
---|---|---|---|---|---|
Conservative | Mudasir Dean | 1,949 | 57.1 | +6.5 | |
Labour | Tony Shepherd | 880 | 25.8 | +1.0 | |
Independent | Eric Hyland | 278 | 8.1 | +2.7 | |
Liberal Democrat | Stephen Howarth | 173 | 5.1 | +2.4 | |
Green | Laura Diggle | 135 | 3.9 | +1.5 | |
Majority | 1,069 | 31.3 | +5.5 | ||
Turnout | 3,415 | 38.1 | -4.8 | ||
Conservative hold | Swing | UKIP to Conservative 10.3 | |||
Party | Candidate | Votes | % | ± | |
---|---|---|---|---|---|
Conservative | Adele Warren | 1,549 | 47.4 | +21.5 | |
Labour | Francesca Platt | 1,278 | 39.1 | +3.3 | |
UKIP | Harry Lamb | 242 | 7.4 | -25.5 | |
Green | Dan Bolton | 138 | 4.2 | +1.6 | |
Liberal Democrat | Richard Bates | 61 | 1.9 | -0.8 | |
Majority | 271 | 8.3 | |||
Turnout | 3,268 | 34.4 | -2.6 | ||
Conservative gain from Labour | Swing | UKIP to Conservative 23.5 | |||
Party | Candidate | Votes | % | ± | |
---|---|---|---|---|---|
Conservative | David Greenhalgh | 2,928 | 36.6 | ||
Conservative | Nadim Muslim | 2,257 | 28.2 | ||
Labour | Steve Sutton | 1,023 | 12.8 | ||
Labour | Deb Whenlock | 910 | 11.4 | ||
Green | Liz Spencer | 374 | 4.7 | ||
Liberal Democrat | Elliott Bermudez-Galton | 303 | 3.8 | ||
Liberal Democrat | David Walsh | 196 | 2.4 | ||
Majority | (Greenhalgh) 1,905 | ||||
Majority | (Muslim) 1,234 | ||||
Turnout | |||||
Conservative hold | |||||
Party | Candidate | Votes | % | ± | |
---|---|---|---|---|---|
Labour | Bilkis Ismail | 2,258 | 57.1 | -10.4 | |
Conservative | Daniel Wheatley | 737 | 18.6 | +9.2 | |
Independent | Siraj Patel | 706 | 17.8 | +17.8 | |
Liberal Democrat | Michael Langdon | 252 | 6.4 | +2.7 | |
Majority | 1,521 | 38.5 | -9.5 | ||
Turnout | 3,953 | 36.8 | +0.9 | ||
Labour hold | Swing | UKIP to Ind 18.6 | |||
Party | Candidate | Votes | % | ± | |
---|---|---|---|---|---|
Farnworth and Kearsley First | Maureen Flitcroft | 1,699 | 53.9 | +53.9 | |
Labour | Martin McMulkin | 1,172 | 37.3 | -11.1 | |
Conservative | Jennifer Kirk | 142 | 4.5 | -4.1 | |
UKIP | Dave Harvey | 92 | 2.9 | -33.5 | |
Liberal Democrat | David Cooper | 44 | 1.4 | -1.6 | |
Majority | 522 | 16.5 | |||
Turnout | 3,154 | 30.0 | |||
Farnworth and Kearsley First gain from Labour | Swing | UKIP to FKF 43.7 | |||
Party | Candidate | Votes | % | ± | |
---|---|---|---|---|---|
Labour | Mohammed Ayub | 2,422 | 76.0 | +6.5 | |
Conservative | Mohammed Waqas | 389 | 12.2 | +4.6 | |
Green | David Figgins | 232 | 7.3 | +1.2 | |
Liberal Democrat | Francine Godfrey | 143 | 4.5 | +0.6 | |
Majority | 2,033 | 63.8 | +7.2 | ||
Turnout | 3,186 | 32.9 | -1.4 | ||
Labour hold | Swing | UKIP to Labour 9.7 | |||
Party | Candidate | Votes | % | ± | |
---|---|---|---|---|---|
Labour | Akhtar Zaman | 2,181 | 70.2 | +3.6 | |
Conservative | Jolyon Coombs | 418 | 13.6 | +5.1 | |
Liberal Democrat | John Falch | 120 | 3.8 | -0.2 | |
Green | Ian McHugh | 118 | 3.8 | -0.7 | |
Independent | Martin McLoughlin | 114 | 3.7 | +3.7 | |
Independent | Sarfraz Nawaz | 83 | 2.7 | +2.7 | |
Independent | Anthony Massey | 71 | 2.3 | +2.3 | |
Majority | 1,767 | 56.8 | +6.6 | ||
Turnout | 3,110 | 35.2 | -0.3 | ||
Labour hold | Swing | UKIP to Conservative 10.7 | |||
Party | Candidate | Votes | % | ± | |
---|---|---|---|---|---|
Labour | Hamid Khurram | 1,910 | 53.3 | +3.8 | |
Farnworth and Kearsley First | Lisa Weatherby | 897 | 25.1 | +25.1 | |
Conservative | Robert Tyler | 477 | 13.4 | +1.7 | |
UKIP | Amy Wunderley | 157 | 4.4 | -27.9 | |
Green | Matthew Barnes | 63 | 1.8 | -1.7 | |
Liberal Democrat | Kevin Walsh | 62 | 1.7 | -1.4 | |
Majority | 1,013 | 28.4 | +11.2 | ||
Turnout | 3,566 | 36.1 | +4.3 | ||
Labour hold | Swing | UKIP to FKF 26.5 | |||
Party | Candidate | Votes | % | ± | |
---|---|---|---|---|---|
Conservative | Anne Galloway | 3,000 | 66.4 | +10.2 | |
Labour | John Gillatt | 1,247 | 27.6 | +0.6 | |
Liberal Democrat | Garry Veevers | 269 | 5.9 | +0.4 | |
Majority | 1,753 | 38.8 | +9.5 | ||
Turnout | 4,516 | 42.3 | -3.6 | ||
Conservative hold | Swing | UKIP to Conservative 9.3 | |||
Party | Candidate | Votes | % | ± | |
---|---|---|---|---|---|
Conservative | Susan Baines | 1,668 | 47.6 | +18.0 | |
Labour | Michael Jarvis | 1,437 | 41.0 | -1.5 | |
Liberal Democrat | Rebecca Forrest | 231 | 6.6 | +3.1 | |
Green | Keith Cocker | 169 | 4.8 | -0.6 | |
Majority | 231 | 6.6 | |||
Turnout | 3,505 | 33.7 | -2.0 | ||
Conservative gain from Labour | Swing | UKIP to Conservative 18.5 | |||
Party | Candidate | Votes | % | ± | |
---|---|---|---|---|---|
Labour | Kevin McKeon | 1,345 | 36.0 | -4.9 | |
Liberal Democrat | Stephen Rock | 1,288 | 34.5 | +14.3 | |
Conservative | Joan Johnson | 887 | 23.8 | +3.5 | |
Green | Rod Riesco | 213 | 5.7 | +0.8 | |
Majority | 57 | 1.5 | -19.1 | ||
Turnout | 3,733 | 38.0 | -2.7 | ||
Labour hold | Swing | UKIP to Lib Dem 14.0 | |||
Party | Candidate | Votes | % | ± | |
---|---|---|---|---|---|
Conservative | Diane Parkinson | 1,858 | 50.2 | +17.5 | |
Labour | Rabiya Jiva | 1,451 | 39.2 | +2.2 | |
UKIP | Beverley Fletcher | 215 | 5.8 | -18.7 | |
Green | Chris Taylor | 107 | 2.9 | -0.4 | |
Liberal Democrat | Kevin Mulligan | 68 | 1.8 | -0.7 | |
Majority | 407 | 11.0 | |||
Turnout | 3,699 | 37.0 | -1.4 | ||
Conservative hold | Swing | UKIP to Conservative 18.1 | |||
Party | Candidate | Votes | % | ± | |
---|---|---|---|---|---|
Farnworth and Kearsley First | Julie Pattison | 1,864 | 52.3 | +52.3 | |
Labour | Stephen Langley | 882 | 24.7 | -13.5 | |
UKIP | Will Pilkington | 399 | 11.2 | -34.0 | |
Conservative | Kamaran Fathulla | 290 | 8.1 | -1.1 | |
Liberal Democrat | Connor Goodwin | 131 | 3.7 | -3.7 | |
Majority | 982 | 27.5 | |||
Turnout | 3,566 | 34.1 | +2.3 | ||
Farnworth and Kearsley First gain from Labour | Swing | UKIP to FKF 43.1 | |||
Party | Candidate | Votes | % | ± | |
---|---|---|---|---|---|
Labour | David Evans | 1,249 | 37.5 | +10.1 | |
Conservative | David Meehan | 1,000 | 30.0 | +19.3 | |
UKIP | Paul Richardson | 926 | 27.8 | -11.5 | |
Liberal Democrat | Christine MacPherson | 159 | 4.8 | -15.5 | |
Majority | 249 | 7.5 | |||
Turnout | 3,334 | 34.7 | -7.5 | ||
Labour gain from UKIP | Swing | Lib Dem to Conservative 17.4 | |||
Party | Candidate | Votes | % | ± | |
---|---|---|---|---|---|
Labour | Ismail Ibrahim | 2,570 | 75.7 | +3.5 | |
Conservative | Hafiz Butt | 379 | 11.2 | +0.7 | |
Green | Alan Johnson | 251 | 7.4 | +2.4 | |
Independent | Damien Walsh | 111 | 3.3 | +3.3 | |
Liberal Democrat | Duncan MacPherson | 55 | 2.5 | +0.2 | |
Majority | 2,191 | 64.5 | +2.8 | ||
Turnout | 3,396 | 34.4 | -2.6 | ||
Labour hold | Swing | UKIP to Labour 6.7 | |||
Party | Candidate | Votes | % | ± | |
---|---|---|---|---|---|
Liberal Democrat | Doug Bagnall | 2,031 | 48.9 | -1.9 | |
Labour | Ryan Quick | 1,260 | 30.3 | +4.7 | |
Conservative | Sam Rimmer | 751 | 18.1 | +8.9 | |
Green | Elizabeth McManus | 111 | 2.7 | +0.5 | |
Majority | 771 | 18.6 | -6.6 | ||
Turnout | 4,154 | 40.2 | -4.9 | ||
Liberal Democrat hold | Swing | UKIP to Conservative 10.5 | |||
Party | Candidate | Votes | % | ± | |
---|---|---|---|---|---|
Labour | Nick Peel | 1,379 | 50.4 | +4.5 | |
Conservative | Matthew Littler | 928 | 33.9 | +19.4 | |
UKIP | Derek Wunderley | 232 | 8.5 | -24.9 | |
Liberal Democrat | Rosalind Harasiwka | 113 | 4.1 | +0.6 | |
Green | James Tomkinson | 82 | 3.0 | +0.3 | |
Majority | 451 | 16.5 | +4.0 | ||
Turnout | 2,734 | 31.0 | -4.3 | ||
Labour hold | Swing | UKIP to Conservative 22.1 | |||
Party | Candidate | Votes | % | ± | |
---|---|---|---|---|---|
Conservative | Martyn Cox | 1,831 | 42.6 | +3.6 | |
Liberal Democrat | Bernadette Eckersley-Fallon | 1,386 | 32.2 | +23.4 | |
Labour | Ged Carter | 784 | 18.2 | -14.3 | |
Independent | Jack Speight | 236 | 5.5 | +5.5 | |
Green | Heather Rylance | 61 | 2.6 | -0.2 | |
Majority | 445 | 10.5 | +4.1 | ||
Turnout | 4,300 | 39.7 | +1.2 | ||
Conservative hold | Swing | UKIP to Lib Dem 20.2 | |||
Party | Candidate | Votes | % | ± | |
---|---|---|---|---|---|
Liberal Democrat | David Wilkinson | 1,934 | 53.2 | +24.2 | |
Labour | Ryan Battersby | 899 | 24.7 | -8.0 | |
Conservative | Martin Tighe | 804 | 22.1 | +1.8 | |
Majority | 1,035 | 28.4 | |||
Turnout | 3,637 | 37.0 | +1.2 | ||
Liberal Democrat gain from Labour | Swing | UKIP to Lib Dem 21.1 | |||
The 1998 Bolton Metropolitan Borough Council election took place on 7 May 1998 to elect members of Bolton Metropolitan Borough Council in Greater Manchester, England. One third of the council was up for election and the Labour party kept overall control of the council.
Elections to Bolton Metropolitan Borough Council were held on 6 May 1999. One third of the council was up for election and the Labour party kept overall control of the council.
Elections to Bolton Metropolitan Borough Council were held on 2 May 2002. One third of the council was up for election and the Labour party kept overall control of the council.
Elections to Bolton Metropolitan Borough Council were held on 1 May 2003. One third of the council was up for election and the Labour party lost overall control of the council to no overall control, for the first time since 1980.
Elections to Bolton Metropolitan Borough Council were held on 3 May 2007. One third of the council was up for election and the council stayed under no overall control.
Elections to Bolton Metropolitan Borough Council was held on 6 May 2010, on the same day as the General Election which led to a much higher turnout than in recent years. One third of the council was up for election and the council stayed under no overall control.
Elections to Bolton Metropolitan Borough Council were held on 5 May 2011, along with the United Kingdom Alternative Vote referendum, 2011. One third of the council was up for election, with each successful candidate to serve a four-year term of office, expiring in 2015.
Elections to Bolton Metropolitan Borough Council were held on 3 May 2012. One third of the council was up for election, with each successful candidate to serve a four-year term of office, expiring in 2016.
The 1995 Bolton Metropolitan Borough Council election took place on 4 May 1995 to elect members of Bolton Metropolitan Borough Council in Greater Manchester, England. One third of the council was up for election and the Labour party kept overall control of the council
The 1988 Bolton Metropolitan Borough Council election took place on 5 May 1988 to elect members of Bolton Metropolitan Borough Council in Greater Manchester, England. One third of the council was up for election and the Labour party kept overall control of the council.
The 1990 Bolton Metropolitan Borough Council election took place on 4 May 1990 to elect members of Bolton Metropolitan Borough Council in Greater Manchester, England. One third of the council was up for election and the Labour party kept overall control of the council
The 1991 Bolton Metropolitan Borough Council election took place on 6 May 1991 to elect members of Bolton Metropolitan Borough Council in Greater Manchester, England. One third of the council was up for election and the Labour party kept overall control of the council.
The 1992 Bolton Metropolitan Borough Council election took place on 7 May 1992 to elect members of Bolton Metropolitan Borough Council in Greater Manchester, England. One third of the council was up for election and the Labour party kept overall control of the council.
The 1994 Bolton Metropolitan Borough Council election took place on 5 May 1994 to elect members of Bolton Metropolitan Borough Council in Greater Manchester, England. One third of the council was up for election and the Labour party kept overall control of the council.
Elections to Bolton Metropolitan Borough Council were held on 22 May 2014, along with the European Parliament elections, 2014. One third of the council was up for election, with each successful candidate to serve a four-year term of office, expiring in 2018.
The 2015 Bolton Metropolitan Borough Council election were held on 7 May 2015 to elect members of Bolton Metropolitan Borough Council in Greater Manchester, England. This took place on the same day as other local elections
The 2016 Bolton Metropolitan Borough Council election took place on 5 May 2016 to elect members of Bolton Metropolitan Borough Council in Greater Manchester, England. This was on the same day as other local elections.
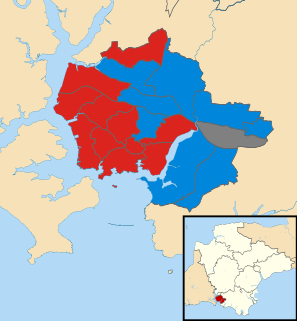
The 2018 Plymouth City Council election took place on 3 May 2018 to elect members of Plymouth City Council in England. The election was won by the Labour Party, who gained enough seats to achieve an overall majority and took control of the council.
The 2018 Wokingham Borough Council election took place on Thursday 3 May 2018. That was the same day as other United Kingdom local elections in order to elect members of Wokingham Unitary Council in Berkshire, England. One third of the council was up for election and the Conservative party stayed comfortably in overall control of the council.