The 2018 Worthing Borough Council election took place on 3 May 2018 to elect members of Worthing Borough Council. [1] This was on the same day as other local elections. A third of the council was up for election, meaning a total of 13 councillors were elected from all of the council's wards.
Worthing is a large seaside town in England, and district with borough status in West Sussex. It is situated at the foot of the South Downs, 10 miles (16 km) west of Brighton, and 18 miles (29 km) east of the county town of Chichester. With an estimated population of 104,600 and an area of 12.5 square miles (32.37 km2) the borough is the second largest component of the Brighton/Worthing/Littlehampton conurbation, which makes it part of the 15th most populous urban area in the United Kingdom. Since 2010 northern parts of the borough, including the Worthing Downland Estate, have formed part of the South Downs National Park.
The pattern of local government in England is complex, with the distribution of functions varying according to the local arrangements.
Despite suffering a net loss of two seats, the Conservative Party retained overall control of the council.
The Conservative Party, officially the Conservative and Unionist Party, is a centre-right political party in the United Kingdom. Presently led by Theresa May, it has been the governing party since 2010. It presently has 314 Members of Parliament in the House of Commons, 249 members of the House of Lords, and 18 members of the European Parliament. It also has 31 Members of the Scottish Parliament, 12 members of the Welsh Assembly, eight members of the London Assembly and 9,008 local councillors. One of the major parties of UK politics, it has formed the government on 45 occasions, more than any other party.
Worthing [1] | |||||||||||||||
---|---|---|---|---|---|---|---|---|---|---|---|---|---|---|---|
Candidates | Votes | ||||||||||||||
Party | Stood | Elected | Gained | Unseated | Net | % of total | % | № | Net % | ||||||
Conservative | 13 | 8 | 1 | 3 | -2 | 61.5 | 45.9 | 13,150 | |||||||
Labour | 13 | 4 | 4 | 0 | +4 | 30.8 | 34.5 | 9,869 | |||||||
Liberal Democrat | 13 | 1 | 0 | 0 | ±0 | 7.7 | 13.4 | 3,826 | |||||||
Green | 8 | 0 | 0 | 1 | -1 | 0.0 | 4.1 | 1,181 | |||||||
UKIP | 6 | 0 | 0 | 1 | -1 | 0.0 | 2.2 | 617 |
Party | Candidate | Votes | % | ± | |
---|---|---|---|---|---|
Labour | Margaret Howard | 1,026 | 47.6 | +21.2 | |
Conservative | Steve McKeown | 836 | 38.8 | +2.7 | |
Liberal Democrat | John Apsey | 229 | 10.6 | -0.1 | |
Green | Kate Sweeny | 147 | 6.8 | -1.7 | |
Majority | 190 | 8.8 | |||
Turnout | 2,155 | 31.6 | |||
Labour gain from Conservative | Swing | ||||
Party | Candidate | Votes | % | ± | |
---|---|---|---|---|---|
Conservative | Karen Harman | 864 | 41.8 | +9.5 | |
Liberal Democrat | Martin McCabe | 531 | 25.7 | +9.1 | |
Labour | Samuel Theodoridi | 453 | 21.9 | +4.6 | |
UKIP | Heba Saraway | 123 | 5.9 | -24.7 | |
Green | Julian Warwick | 97 | 4.7 | -0.5 | |
Majority | 333 | 16.1 | |||
Turnout | 2,069 | 30.5 | |||
Conservative hold | Swing | 1.5 | |||
Party | Candidate | Votes | % | ± | |
---|---|---|---|---|---|
Labour | James Deen | 1,534 | 56.7 | +30.1 | |
Conservative | Harvey Robinson | 777 | 28.7 | +0.5 | |
Green | James Doyle | 202 | 7.5 | -11.0 | |
Liberal Democrat | Christine Brown | 184 | 6.8 | -3.0 | |
Majority | 757 | 28.0 | |||
Turnout | 2,706 | 35.2 | |||
Labour gain from Green | Swing | ||||
Party | Candidate | Votes | % | ± | |
---|---|---|---|---|---|
Conservative | Charles James | 791 | 57.0 | +21.8 | |
Labour | Jillian Guest | 296 | 21.3 | +9.3 | |
Liberal Democrat | Emma Norton | 295 | 21.3 | +0.5 | |
Majority | 495 | 35.7 | |||
Turnout | 1,387 | 31.0 | |||
Conservative gain from UKIP | Swing | ||||
Party | Candidate | Votes | % | ± | |
---|---|---|---|---|---|
Conservative | Kevin Jenkins | 1,002 | 41.9 | +3.5 | |
Labour | Joseph Thornton | 950 | 39.7 | +14.7 | |
Liberal Democrat | Stephen Martin | 222 | 9.3 | -2.5 | |
Green | Stephen Carleysmith | 211 | 8.8 | -0.8 | |
Majority | 52 | 2.2 | |||
Turnout | 2,390 | 34.0 | |||
Conservative hold | Swing | ||||
Party | Candidate | Votes | % | ± | |
---|---|---|---|---|---|
Conservative | Nicola Waight | 1,625 | 60.0 | +8.3 | |
Labour | Jane Cropper | 561 | 20.7 | +6.1 | |
Liberal Democrat | Cyril Cannings | 192 | 7.1 | +1.1 | |
Green | David Aherne | 184 | 6.8 | -0.7 | |
UKIP | Richard Bater | 144 | 5.3 | -14.8 | |
Majority | 1,064 | 39.3 | |||
Turnout | 2,709 | 39.3 | |||
Conservative hold | Swing | ||||
Party | Candidate | Votes | % | ± | |
---|---|---|---|---|---|
Labour | Richard Mulholland | 1,029 | 45.3 | +12.5 | |
Conservative | Diane Guest | 964 | 42.4 | +6.0 | |
Green | Joseph Pearce | 139 | 6.1 | -1.6 | |
Liberal Democrat | Christine Allen | 134 | 5.9 | -0.1 | |
Majority | 65 | 2.9 | |||
Turnout | 2,273 | 35.2 | |||
Labour gain from Conservative | Swing | ||||
Party | Candidate | Votes | % | ± | |
---|---|---|---|---|---|
Conservative | Edward Crouch | 1,460 | 50.6 | +5.4 | |
Labour | Samuel Baeza | 1,136 | 39.3 | +19.8 | |
Liberal Democrat | Caroline Griffiths | 194 | 6.7 | -3.5 | |
UKIP | Barry Pinchen | 94 | 3.3 | -13.1 | |
Majority | 324 | 11.2 | |||
Turnout | 2,888 | 43.2 | |||
Conservative hold | Swing | ||||
Party | Candidate | Votes | % | ± | |
---|---|---|---|---|---|
Conservative | Sean McDonald | 497 | 51.1 | +23.4 | |
Labour | John Martin | 268 | 27.5 | +9.3 | |
Liberal Democrat | Keith Sunderland | 133 | 13.7 | -8.8 | |
UKIP | Stuart Field | 75 | 7.7 | -22.9 | |
Majority | 229 | 23.5 | |||
Turnout | 973 | 22.3 | |||
Conservative hold | Swing | ||||
Party | Candidate | Votes | % | ± | |
---|---|---|---|---|---|
Conservative | Louise Murphy | 1,452 | 63.8 | ||
Labour | Bernard Eustice | 496 | 21.8 | ||
Liberal Democrat | Antony Brown | 231 | 10.1 | ||
UKIP | John Strange | 93 | 4.1 | ||
Majority | 956 | 42.0 | |||
Turnout | 2,276 | 35.2 | |||
Conservative hold | Swing | ||||
Party | Candidate | Votes | % | ± | |
---|---|---|---|---|---|
Conservative | Heather Mercer | 1,396 | 62.5 | ||
Labour | Helen Silman | 461 | 20.6 | ||
Liberal Democrat | Jacqueline Cranefield | 356 | 15.9 | ||
Majority | 935 | 41.9 | |||
Turnout | 2,233 | 30.8 | |||
Conservative hold | Swing | ||||
Party | Candidate | Votes | % | ± | |
---|---|---|---|---|---|
Labour | Michael Barrett | 1,162 | 49.2 | ||
Conservative | Callum Buxton | 963 | 40.8 | ||
Liberal Democrat | Yvonne Leonard | 134 | 5.7 | ||
Green | Constantine de Goguel | 95 | 4.0 | ||
Majority | 199 | 8.4 | |||
Turnout | 2,360 | 37.4 | |||
Labour gain from Conservative | Swing | ||||
Party | Candidate | Votes | % | ± | |
---|---|---|---|---|---|
Liberal Democrat | Robert Smytherman | 991 | 44.9 | ||
Conservative | Steven Peck | 523 | 23.7 | ||
Labour | Pauline Fraser | 497 | 22.5 | ||
Green | Joanna Ponto | 106 | 4.8 | ||
UKIP | Adrian Price | 88 | 4.0 | ||
Majority | 468 | 21.2 | |||
Turnout | 2,207 | 34.1 | |||
Liberal Democrat hold | Swing | ||||
Worthing Borough Council is a district council in the county of West Sussex, based in the borough of Worthing. The borough council was created in 1974 under the Local Government Act 1972 out of the existing Worthing Municipal Council, which also had borough status. It forms the lower tier of local government in Worthing, responsible for local services such as housing, planning, leisure and tourism.
One third of Worthing Borough Council in Worthing, West Sussex, England is elected each year, followed by one year without election. Since the last boundary changes in 2003, 37 councillors are elected from 13 wards.
The 1998 Worthing Borough Council election took place on 7 May 1998 to elect members of Worthing Borough Council in West Sussex, England. One third of the council was up for election and the Liberal Democrat party kept overall control of the council.
The 1999 Worthing Borough Council election took place on 6 May 1999 to elect members of Worthing Borough Council in West Sussex, England. One third of the council was up for election and the Conservative party gained overall control of the council from the Liberal Democrats. Overall turnout was 34.8%.
The 2000 Worthing Borough Council election took place on 4 May 2000 to elect members of Worthing Borough Council in West Sussex, England. One third of the council was up for election and the Conservative party held overall control of the council.
The 2002 Worthing Borough Council election took place on 2 May 2002 to elect members of Worthing Borough Council in West Sussex, England. One third of the council was up for election and the Liberal Democrats gained overall control of the council from the Conservative party. Overall turnout was 30.67%.
The 2003 Worthing Borough Council election took place on 1 May 2003 to elect members of Worthing Borough Council in West Sussex, England. One third of the council was up for election and the Liberal Democrats lost overall control of the council to no overall control. Overall turnout was 28.61%.
The 2004 Worthing Borough Council election took place on 10 June 2004 to elect members of Worthing Borough Council in West Sussex, England. The whole council was up for election with boundary changes since the last election 2003 increasing the number of seats by 1. The Conservative party gained overall control of the council from no overall control. Overall turnout was 38.23%.
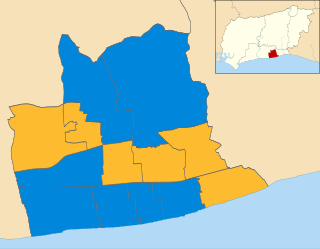
The 2006 Worthing Borough Council election took place on 4 May 2006 to elect members of Worthing Borough Council in West Sussex, England. One third of the council was up for election and the Conservative party stayed in overall control of the council.
The 2008 Worthing Borough Council election took place on 1 May 2008 to elect members of Worthing Borough Council in West Sussex, England. One third of the council was up for election and the Conservative party stayed in overall control of the council. Overall turnout was 35%.
The 2010 Worthing Borough Council election took place on 6 May 2010 to elect members of Worthing Borough Council in West Sussex, England. One third of the council was up for election and the Conservative party stayed in overall control of the council.
The 2011 Worthing Borough Council election took place on 5 May 2011 to elect members of Worthing Borough Council in West Sussex, England. One third of the council was up for election, with the exception of the two member wards of Durrington and Northbrook. The Conservative party retained overall control of the council.
The 2012 Worthing Borough Council election took place on 3 May 2012 to elect members of Worthing Borough Council in West Sussex, England. One third of the council was elected, including a double vacancy in Offington ward. The Conservative party remained in overall control of the council.
The 2014 Worthing Borough Council election took place on 22 May 2014 to elect members of Worthing Borough Council in West Sussex, England. The election took place on the same day as elections to the European Parliament, and saw one third of the council up for election. The Conservative Party retained overall control of the council, gaining four seats, but losing one to the UK Independence Party. The Liberal Democrats suffered five losses, including one to the Green Party, who gaining their first elected seats on the Council.
The 2015 Worthing Borough Council election took place on 7 May 2015 to elect members of the Worthing Borough Council in England. It was held on the same day as other local elections.
The 2016 Worthing Borough Council election took place on 5 May 2016 to elect members of Worthing Borough Council in England. This was on the same day as other local elections.
The 2018 Brent London Borough Council election took place on 3 May 2018 to elect members of Brent London Borough Council in England. This was on the same day as other local elections.
The 2018 Westminster City Council elections were held on 3rd May 2018, the same day as other London Boroughs. All 60 seats were up for election along with the 3 seats of Queen's Park Community Council. Despite initial expectations of Labour gains across the borough, the Conservative party were able to hold the council and only lost 3 seats. The Conservatives won the popular vote across the borough by a small margin of 923 votes (1.7%), but nonetheless won a decisive victory in terms of seats, winning 41 councillors to Labour's 19.
The 1973 Wirral Metropolitan Borough Council election took place on 10 May 1973 to elect members of Wirral Metropolitan Borough Council in England. This was on the same day as other local elections.
The 1994 Wirral Metropolitan Borough Council election took place on 5 May 1994 to elect members of Wirral Metropolitan Borough Council in England. This election was held on the same day as other local elections.