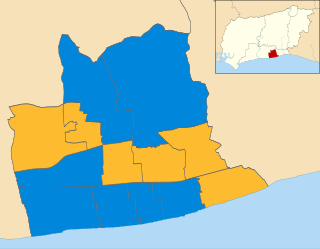
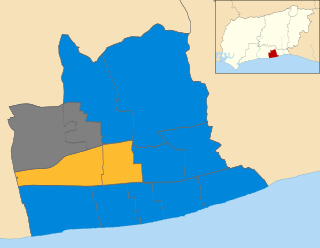
The 2012 Worthing Borough Council election took place on 3 May 2012 to elect members of Worthing Borough Council in West Sussex, England. One third of the council was elected, including a double vacancy in Offington ward. The Conservative party remained in overall control of the council. [1]
Worthing is a large seaside town in England, and district with borough status in West Sussex. It is situated at the foot of the South Downs, 10 miles (16 km) west of Brighton, and 18 miles (29 km) east of the county town of Chichester. With an estimated population of 104,600 and an area of 12.5 square miles (32.37 km2) the borough is the second largest component of the Brighton/Worthing/Littlehampton conurbation, which makes it part of the 15th most populous urban area in the United Kingdom. Since 2010 northern parts of the borough, including the Worthing Downland Estate, have formed part of the South Downs National Park.
Borough status in the United Kingdom is granted by royal charter to local government districts in England, Wales and Northern Ireland. The status is purely honorary, and does not give any additional powers to the council or inhabitants of the district. In Scotland, similarly chartered communities were known as royal burghs, although the status is no longer granted.
West Sussex is a county in the south of England, bordering East Sussex to the east, Hampshire to the west and Surrey to the north, and to the south the English Channel.
The composition of the council after the election was:
The Conservative Party, officially the Conservative and Unionist Party, is a centre-right political party in the United Kingdom. Presently led by Theresa May, it has been the governing party since 2010. It presently has 314 Members of Parliament in the House of Commons, 249 members of the House of Lords, and 18 members of the European Parliament. It also has 31 Members of the Scottish Parliament, 12 members of the Welsh Assembly, eight members of the London Assembly and 9,008 local councillors. One of the major parties of UK politics, it has formed the government on 45 occasions, more than any other party.
The Liberal Democrats are a liberal, centrist political party in the United Kingdom. They presently have 11 Members of Parliament in the House of Commons, 96 members of the House of Lords, and one member of the European Parliament. They also have five Members of the Scottish Parliament and a member each in the Welsh Assembly and London Assembly. The party reached the height of its influence in the early 2010s, forming a junior partner in a coalition government from 2010 to 2015. It is presently led by Vince Cable.
Ward | Party | Incumbent Elected | Incumbent | Standing again | Gain/Hold |
---|---|---|---|---|---|
Broadwater | Conservative | 2008 | Don Allen | No | Conservative hold |
Castle | Liberal Democrats | 2008 | David Potter | Yes | Liberal Democrat hold |
Central | Conservative | 2008 | Martin Coppard | No | Conservative hold |
Durrington | Liberal Democrats | 2008 | Michael Donnin | Yes | Liberal Democrat hold |
Gaisford | Conservative | 2008 | Ann Barlow | No | Conservative hold |
Goring | Conservative | 2008 | Mary Lermite | Yes | Conservative hold |
Heene | Conservative | 2008 | Paul High | Yes | Conservative hold |
Marine | Conservative | 2008 | Joan Bradley | Yes | Conservative hold |
Northbrook | Conservative | 2008 | Mary Harding | Yes | Liberal Democrat gain |
Offington | Conservative | 2008 | Elizabeth Sparkes | Yes | Conservative hold |
Offington | Conservative | 2010 | Vacant | N/A | Conservative hold |
Salvington | Independent | 2008 | Jacqui Marsh | No | Conservative gain |
Selden | Independent | 2008 | James Doyle | No | Conservative gain |
Tarring | Liberal Democrats | 2008 | Norah Fisher | Yes | Liberal Democrat hold |
Party | Seats | Gains | Losses | Net gain/loss | Seats % | Votes % | Votes | +/− | |
---|---|---|---|---|---|---|---|---|---|
Conservative | 10 | 2 | 1 | +1 | 71.4 | 41.4 | 9,888 | ||
Liberal Democrat | 4 | 1 | 0 | +1 | 28.6 | 24.6 | 5,858 | ||
UKIP | 0 | 0 | 0 | 0 | 0 | 16.9 | 4,043 | ||
Labour | 0 | 0 | 0 | 0 | 0 | 15.2 | 3,636 | ||
Independent | 0 | 0 | 2 | -2 | 0 | 0 | 0 | ||
Party | Candidate | Votes | % | ± | |
---|---|---|---|---|---|
Conservative | Vic Walker | 585 | 33.14 | ||
Liberal Democrat | James Nelson | 513 | 29.07 | ||
Labour | Lynda Newbury | 371 | 21.01 | ||
UKIP | Colin Avis | 296 | 16.77 | ||
Rejected ballots | |||||
Majority | |||||
Turnout | |||||
Conservative hold | Swing | ||||
Party | Candidate | Votes | % | ± | |
---|---|---|---|---|---|
Liberal Democrat | David Potter | 701 | 40.33 | ||
Conservative | Anne Chapman | 505 | 29.06 | ||
UKIP | Christopher Chatfield | 270 | 15.54 | ||
Labour | Ian Walker | 262 | 15.07 | ||
Rejected ballots | |||||
Majority | |||||
Turnout | |||||
Liberal Democrat hold | Swing | ||||
Party | Candidate | Votes | % | ± | |
---|---|---|---|---|---|
Conservative | Vino Vinojan | 494 | 29.49 | ||
Labour | Russell Deen | 404 | 24.12 | ||
Liberal Democrat | Laura Scott | 327 | 19.52 | ||
UKIP | Christopher Wooward | 254 | 15.16 | ||
Green | Margaret Pearce | 196 | 11.70 | ||
Rejected ballots | |||||
Majority | |||||
Turnout | |||||
Conservative hold | Swing | ||||
Party | Candidate | Votes | % | ± | |
---|---|---|---|---|---|
Liberal Democrat | Michael Donnin | 505 | 36.12 | ||
Conservative | Pauline James | 492 | 35.19 | ||
UKIP | Mike Jelliss | 218 | 15.59 | ||
Labour | Guy Chadwick | 183 | 13.09 | ||
Rejected ballots | |||||
Majority | |||||
Turnout | |||||
Liberal Democrat hold | Swing | ||||
Party | Candidate | Votes | % | ± | |
---|---|---|---|---|---|
Conservative | Val Turner | 671 | 36.65 | ||
Liberal Democrat | Emma Davies | 577 | 31.51 | ||
Labour | John Turley | 329 | 17.97 | ||
UKIP | John Harwood | 254 | 13.87 | ||
Rejected ballots | |||||
Majority | |||||
Turnout | |||||
Conservative hold | Swing | ||||
Party | Candidate | Votes | % | ± | |
---|---|---|---|---|---|
Conservative | Mary Lermitte | 1200 | 50.23 | ||
UKIP | Richard Bater | 482 | 20.18 | ||
Labour | James Elwood | 359 | 15.03 | ||
Green | David Aherne | 178 | 7.45 | ||
Liberal Democrat | Michael Finch | 170 | 7.12 | ||
Rejected ballots | |||||
Majority | |||||
Turnout | |||||
Conservative hold | Swing | ||||
Party | Candidate | Votes | % | ± | |
---|---|---|---|---|---|
Conservative | Paul High | 685 | 47.54 | ||
Liberal Democrat | Shân Orr-Ewíng | 425 | 29.49 | ||
UKIP | Richard Setford | 331 | 22.97 | ||
Rejected ballots | |||||
Majority | |||||
Turnout | |||||
Conservative hold | Swing | ||||
Party | Candidate | Votes | % | ± | |
---|---|---|---|---|---|
Conservative | Joan Bradley | 959 | 49.82 | ||
Labour | Alexandra Wagstaff | 357 | 18.55 | ||
UKIP | Phil Ruddock | 349 | 18.13 | ||
Liberal Democrat | Yvonne Leonard | 260 | 13.51 | ||
Rejected ballots | |||||
Majority | |||||
Turnout | |||||
Conservative hold | Swing | ||||
Party | Candidate | Votes | % | ± | |
---|---|---|---|---|---|
Liberal Democrat | Keith Sunderland | 298 | 40.22 | ||
Conservative | Mary Harding | 294 | 39.68 | ||
Labour | Janet Haden | 86 | 11.61 | ||
Green | William Morris | 63 | 6.50 | ||
Rejected ballots | |||||
Majority | |||||
Turnout | |||||
Liberal Democrat gain from Conservative | Swing | ||||
Party | Candidate | Votes | % | ± | |
---|---|---|---|---|---|
Conservative | Elizabeth Andrews-Sparkes | 1107 | 31.48 | ||
Conservative | John Rogers | 959 | 27.28 | ||
UKIP | Mike Glennon | 599 | 17.04 | ||
Liberal Democrat | Linda Williams | 305 | 8.67 | ||
Labour | John Steels | 290 | 8.25 | ||
Liberal Democrat | Trudi Starling | 256 | 7.28 | ||
Rejected ballots | |||||
Majority | |||||
Turnout | |||||
Conservative hold | Swing | ||||
Party | Candidate | Votes | % | ± | |
---|---|---|---|---|---|
Conservative | Michale Cloake | 884 | 46.67 | ||
UKIP | Trixie Hall | 456 | 24.08 | ||
Labour | John Martin | 297 | 15,68 | ||
Liberal Democrat | Neil Campbell | 257 | 13.57 | ||
Rejected ballots | |||||
Majority | |||||
Turnout | |||||
Conservative gain from Independent | Swing | ||||
Party | Candidate | Votes | % | ± | |
---|---|---|---|---|---|
Conservative | Keith Bickers | 605 | 33.63 | ||
Liberal Democrat | Jacqueline Cranefield | 498 | 27.68 | ||
Labour | Michael Barrett | 429 | 23.85 | ||
UKIP | Grant Lloyd | 267 | 14.84 | ||
Rejected ballots | |||||
Majority | |||||
Turnout | |||||
Conservative gain from Independent | Swing | ||||
Party | Candidate | Votes | % | ± | |
---|---|---|---|---|---|
Liberal Democrat | Norah Fisher | 763 | 43.67 | ||
Conservative | Tim Chick | 448 | 25.64 | ||
Labour | Peter Barnes | 269 | 15.40 | ||
UKIP | Shaune King | 267 | 15.28 | ||
Rejected ballots | |||||
Majority | |||||
Turnout | |||||
Liberal Democrat hold | Swing | ||||
Worthing Borough Council is a district council in the county of West Sussex, based in the borough of Worthing. The borough council was created in 1974 under the Local Government Act 1972 out of the existing Worthing Municipal Council, which also had borough status. It forms the lower tier of local government in Worthing, responsible for local services such as housing, planning, leisure and tourism.
The 1998 Worthing Borough Council election took place on 7 May 1998 to elect members of Worthing Borough Council in West Sussex, England. One third of the council was up for election and the Liberal Democrat party kept overall control of the council.
The 1999 Worthing Borough Council election took place on 6 May 1999 to elect members of Worthing Borough Council in West Sussex, England. One third of the council was up for election and the Conservative party gained overall control of the council from the Liberal Democrats. Overall turnout was 34.8%.
The 2000 Worthing Borough Council election took place on 4 May 2000 to elect members of Worthing Borough Council in West Sussex, England. One third of the council was up for election and the Conservative party held overall control of the council.
The 2002 Worthing Borough Council election took place on 2 May 2002 to elect members of Worthing Borough Council in West Sussex, England. One third of the council was up for election and the Liberal Democrats gained overall control of the council from the Conservative party. Overall turnout was 30.67%.
The 2003 Worthing Borough Council election took place on 1 May 2003 to elect members of Worthing Borough Council in West Sussex, England. One third of the council was up for election and the Liberal Democrats lost overall control of the council to no overall control. Overall turnout was 28.61%.
The 2004 Worthing Borough Council election took place on 10 June 2004 to elect members of Worthing Borough Council in West Sussex, England. The whole council was up for election with boundary changes since the last election 2003 increasing the number of seats by 1. The Conservative party gained overall control of the council from no overall control. Overall turnout was 38.23%.
The 2006 Worthing Borough Council election took place on 4 May 2006 to elect members of Worthing Borough Council in West Sussex, England. One third of the council was up for election and the Conservative party stayed in overall control of the council.
The 2007 Worthing Borough Council election took place on 3 May 2007 to elect members of Worthing Borough Council in West Sussex, England. One third of the council was up for election and the Conservative party stayed in overall control of the council.
The 2008 Worthing Borough Council election took place on 1 May 2008 to elect members of Worthing Borough Council in West Sussex, England. One third of the council was up for election and the Conservative party stayed in overall control of the council. Overall turnout was 35%.
The 2011 Broxbourne Council election took place on 5 May 2011 to elect members of Broxbourne Borough Council in Hertfordshire, England. One third of the council was up for election.
The 2010 Worthing Borough Council election took place on 6 May 2010 to elect members of Worthing Borough Council in West Sussex, England. One third of the council was up for election and the Conservative party stayed in overall control of the council.
The 2010 Barrow-in-Furness Borough Council election took place on 6 May 2010 to elect members of Barrow-in-Furness Borough Council in Cumbria, England. One third of the council was up for election and the council stayed under no overall control.
The 2011 Worthing Borough Council election took place on 5 May 2011 to elect members of Worthing Borough Council in West Sussex, England. One third of the council was up for election, with the exception of the two member wards of Durrington and Northbrook. The Conservative party retained overall control of the council.
The 2002 Crawley Borough Council election took place on 2 May 2002 to elect members of Crawley Borough Council in West Sussex, England. One third of the council was up for election and the Labour party stayed in overall control of the council.
The 2012 Wokingham Borough Council election took place on Thursday 3 May 2012, the same day as other United Kingdom local elections, 2012, to elect members of Wokingham Unitary Council in Berkshire, England. One third of the council was up for election and the Conservative party stayed in overall control of the council.
The 2014 Worthing Borough Council election took place on 22 May 2014 to elect members of Worthing Borough Council in West Sussex, England. The election took place on the same day as elections to the European Parliament, and saw one third of the council up for election. The Conservative Party retained overall control of the council, gaining four seats, but losing one to the UK Independence Party. The Liberal Democrats suffered five losses, including one to the Green Party, who gaining their first elected seats on the Council.
The 2012 Pendle Borough Council election took place on 3 May 2012 to elect members of Pendle Borough Council in Lancashire, England. One third of the council was up for election and the council stayed under no overall control.
Elections for the London Borough of Merton were held on 4 May 1978 to elect members of Merton London Borough Council in London, England. This was on the same day as other local elections in England and Scotland.
The 2018 Worthing Borough Council election took place on 3 May 2018 to elect members of Worthing Borough Council. This was on the same day as other local elections. A third of the council was up for election, meaning a total of 13 councillors were elected from all of the council's wards.