Elections to Chichester District Council in West Sussex, United Kingdom were held on 1 May 2003. The whole council was up for election and the Conservative Party held overall control.
West Sussex is a county in the south of England, bordering East Sussex to the east, Hampshire to the west and Surrey to the north, and to the south the English Channel.
The United Kingdom, officially the United Kingdom of Great Britain and Northern Ireland but more commonly known as the UK or Britain, is a sovereign country lying off the north-western coast of the European mainland. The United Kingdom includes the island of Great Britain, the north-eastern part of the island of Ireland and many smaller islands. Northern Ireland is the only part of the United Kingdom that shares a land border with another sovereign state—the Republic of Ireland. Apart from this land border, the United Kingdom is surrounded by the Atlantic Ocean, with the North Sea to the east, the English Channel to the south and the Celtic Sea to the south-west, giving it the 12th-longest coastline in the world. The Irish Sea lies between Great Britain and Ireland. With an area of 242,500 square kilometres (93,600 sq mi), the United Kingdom is the 78th-largest sovereign state in the world. It is also the 22nd-most populous country, with an estimated 66.0 million inhabitants in 2017.
The Conservative Party, officially the Conservative and Unionist Party, is a centre-right political party in the United Kingdom. Presently led by Theresa May, it has been the governing party since 2010. It presently has 314 Members of Parliament in the House of Commons, 249 members of the House of Lords, and 18 members of the European Parliament. It also has 31 Members of the Scottish Parliament, 12 members of the Welsh Assembly, eight members of the London Assembly and 9,008 local councillors. One of the major parties of UK politics, it has formed the government on 45 occasions, more than any other party.
Party | Seats | Gains | Losses | Net gain/loss | Seats % | Votes % | Votes | +/− | |
---|---|---|---|---|---|---|---|---|---|
Conservative | 26 | 0 | 0 | 0 | 54.2 | 44.5 | 23,680 | ||
Liberal Democrat | 21 | 0 | 0 | 0 | 43.7 | 37.9 | 20,153 | ||
Independent | 1 | 0 | 0 | 0 | 2.1 | 2.3 | 1,220 | ||
Labour | 0 | 0 | 0 | 0 | 0 | 9.2 | 4,913 | ||
UKIP | 0 | 0 | 0 | 0 | 0 | 4.8 | 2,559 | ||
Green | 0 | 0 | 0 | 0 | 0 | 1.3 | 715 |
1 Independent candidate was unopposed.
Party | Candidate | Votes | % | ± | |
---|---|---|---|---|---|
Conservative | David John Myers | 649 | 26.2 | ||
Conservative | Myles Antony Cullen | 623 | 25.1 | ||
Independent | Clifford Michael Archer | 588 | 23.7 | ||
Liberal Democrat | Gerald Patrick Lynch | 441 | 17.8 | ||
UKIP | Douglas Ernest Denny | 178 | 7.2 | ||
Turnout | 2479 | 42.5 | |||
Party | Candidate | Votes | % | ± | |
---|---|---|---|---|---|
Liberal Democrat | Michael Norman Hall | 431 | 51.1 | ||
Conservative | Jane Louise Chevis | 358 | 42.5 | ||
UKIP | Antony Edward Bird | 54 | 6.4 | ||
Turnout | 843 | 47.2 | |||
Party | Candidate | Votes | % | ± | |
---|---|---|---|---|---|
Conservative | Susan Mary Hallock | 481 | 70.1 | ||
Liberal Democrat | Paul Ernest Wellstead | 205 | 29.9 | ||
Turnout | 686 | 38.7 | |||
Party | Candidate | Votes | % | ± | |
---|---|---|---|---|---|
Liberal Democrat | Quentin Robson Cox | 653 | 19.0 | ||
Liberal Democrat | Anthony John French | 639 | 18.6 | ||
Liberal Democrat | Eva Marliese French | 635 | 18.5 | ||
Conservative | Rebecca Elizabeth Harris | 304 | 8.8 | ||
Conservative | Gina Margaret Simpson | 283 | 8.2 | ||
UKIP | Nigel Degge Wilmot Sitwell | 247 | 7.2 | ||
Green | Josephine Eckhard | 191 | 5.6 | ||
Labour | Peter John Nutt | 191 | 5.6 | ||
Labour | John Smith | 156 | 4.5 | ||
Labour | Doris Bryson Walton | 141 | 4.1 | ||
Turnout | 3440 | 24.5 | |||
Party | Candidate | Votes | % | ± | |
---|---|---|---|---|---|
Liberal Democrat | Gloria Patricia Hooley | 1002 | 17.7 | ||
Liberal Democrat | Edith Pingree | 961 | 17.0 | ||
Liberal Democrat | Richard Edward Plowman | 903 | 15.9 | ||
Conservative | Stuart Ian King | 731 | 12.9 | ||
Conservative | Nicholas Hart Roberts | 715 | 12.6 | ||
Conservative | Timothy John Roberts | 640 | 11.3 | ||
UKIP | Michael Alan Mason | 205 | 3.6 | ||
Green | Valerie Anne Briginshaw | 173 | 3.1 | ||
Labour | David Morrison | 122 | 2.2 | ||
Labour | John Wallace Barr | 117 | 2.1 | ||
Labour | Frances Turner | 98 | 1.7 | ||
Turnout | 5667 | 43.1 | |||
Party | Candidate | Votes | % | ± | |
---|---|---|---|---|---|
Liberal Democrat | Anne Mary Dorothy Scicluna | 876 | 20.5 | ||
Liberal Democrat | Alan David Chaplin | 741 | 17.4 | ||
Liberal Democrat | David John Siggs | 753 | 17.6 | ||
Conservative | Hilary Anne Flynn | 377 | 8.8 | ||
Conservative | Dorothy June Spirit | 365 | 8.5 | ||
Conservative | Robin William Bell | 336 | 7.9 | ||
Labour | John Bennett | 214 | 5.0 | ||
UKIP | Anne Patricia Craven | 159 | 3.7 | ||
Labour | Benjamin Earnshaw-Mansell | 154 | 3.6 | ||
Labour | Susan Mary Barnardo Bramwell-Smith | 151 | 3.5 | ||
Green | Prudence Dwyer | 149 | 3.5 | ||
Turnout | 4275 | 31.1 | |||
Party | Candidate | Votes | % | ± | |
---|---|---|---|---|---|
Liberal Democrat | Clare Margaret Apel | 655 | 30.0 | ||
Liberal Democrat | Michael Raymond Shone | 628 | 28.7 | ||
Conservative | Julie Ann Rooker | 414 | 19.0 | ||
UKIP | James McCulloch | 205 | 9.4 | ||
Labour | Andrew Emerson | 165 | 7.6 | ||
Labour | Margaret Denis | 116 | 5.3 | ||
Turnout | 2183 | 33.2 | |||
Party | Candidate | Votes | % | ± | |
---|---|---|---|---|---|
Conservative | John Ridd | 356 | 49.9 | ||
Liberal Democrat | Alan George Wells | 312 | 43.7 | ||
Labour | Micheline Lawson | 46 | 6.4 | ||
Turnout | 714 | 41.2 | |||
Party | Candidate | Votes | % | ± | |
---|---|---|---|---|---|
Liberal Democrat | Michael Alan Fay | 344 | 51.0 | ||
Conservative | Norma Dorothy Graves | 331 | 49.0 | ||
Turnout | 675 | 35.7 | |||
Party | Candidate | Votes | % | ± | |
---|---|---|---|---|---|
Conservative | Karen Marion Graham Clay | 524 | 25.1 | ||
Liberal Democrat | Dr Mary Ellen Green | 485 | 23.2 | ||
Conservative | Thea Pauline Hucklesby | 412 | 19.7 | ||
Labour | Celia Anne Barlow | 221 | 10.6 | ||
Labour | Patrick Joseph O'Sullivan | 188 | 9.0 | ||
UKIP | Gordon Alexander Simpson | 148 | 7.2 | ||
Green | Jacqueline Susan Taylor | 109 | 5.2 | ||
Turnout | 2087 | 35.1 | |||
Party | Candidate | Votes | % | ± | |
---|---|---|---|---|---|
Liberal Democrat | John Cheason Mitchell | 718 | 25.9 | ||
Conservative | Heather Penelope Caird | 606 | 21.9 | ||
Liberal Democrat | William Edwin Quinn | 593 | 21.4 | ||
Independent | Dr Mamdouh George Salameh | 450 | 16.2 | ||
Conservative | Nola Jane Hendon | 405 | 14.6 | ||
Turnout | 2772 | 39.8 | |||
Conservative hold | Swing | ||||
Party | Candidate | Votes | % | ± | |
---|---|---|---|---|---|
Liberal Democrat | Adrian Geoffrey Frank Moss | 607 | 73.1 | ||
Conservative | Clifford William Spawton | 223 | 26.9 | ||
Turnout | 830 | 52.5 | |||
Party | Candidate | Votes | % | ± | |
---|---|---|---|---|---|
Conservative | Frank Ernest Garrett | 542 | 69.0 | ||
Liberal Democrat | John Cooper Rankin | 243 | 31.0 | ||
Turnout | 785 | 38.4 | |||
Party | Candidate | Votes | % | ± | |
---|---|---|---|---|---|
Independent | Andrew Michael Shaxson (Re-elected Unopposed) | n/a | n/a | ||
Party | Candidate | Votes | % | ± | |
---|---|---|---|---|---|
Liberal Democrat | Andrew Robert Homan Smith | 442 | 72.9 | ||
Conservative | Mary Louise Goldsmith | 164 | 27.1 | ||
Turnout | 606 | 36.8 | |||
Party | Candidate | Votes | % | ± | |
---|---|---|---|---|---|
Conservative | Alan Joseph Robert Cartwright | 678 | 30.1 | ||
Conservative | Brian John Weekes | 587 | 26.2 | ||
Liberal Democrat | Judith Russell Fowler | 532 | 23.6 | ||
Liberal Democrat | Robert Humphrey Bourchier Devereux | 453 | 20.1 | ||
Turnout | 2250 | 30.7 | |||
Party | Candidate | Votes | % | ± | |
---|---|---|---|---|---|
Liberal Democrat | Stephen Quigley | 368 | 55.8 | ||
Conservative | Anthony Peter Dignum | 292 | 44.2 | ||
Turnout | 660 | 39.7 | |||
Party | Candidate | Votes | % | ± | |
---|---|---|---|---|---|
Conservative | Janet Elizabeth Duncton | 952 | 35.5 | ||
Conservative | Margaret Valerie Field | 808 | 30.2 | ||
Liberal Democrat | Sarah Margaret Barstow | 477 | 17.8 | ||
Liberal Democrat | Catherine Gillian Alderson Perschke | 442 | 16.5 | ||
Turnout | 2679 | 38.3 | |||
Party | Candidate | Votes | % | ± | |
---|---|---|---|---|---|
Conservative | Brian James Hooton | 677 | 31.9 | ||
Conservative | Anthony Malcolm Walker | 667 | 31.4 | ||
Liberal Democrat | Raymond Ernest John Cooper | 397 | 18.7 | ||
Liberal Democrat | Paul Colville | 383 | 18.0 | ||
Turnout | 2124 | 30.9 | |||
Party | Candidate | Votes | % | ± | |
---|---|---|---|---|---|
Conservative | Patricia Ann Janes | 531 | 60.8 | ||
Liberal Democrat | Kevin George Campbell | 254 | 29.0 | ||
UKIP | Ashley Mote | 89 | 10.2 | ||
Turnout | 874 | 41.2 | |||
Party | Candidate | Votes | % | ± | |
---|---|---|---|---|---|
Conservative | Melva Kathleen Bateman | 694 | 19.4 | ||
Conservative | Stewart Marr Adamson | 657 | 18.4 | ||
Conservative | Alan John Dyer | 615 | 17.2 | ||
Labour | Ian Bell | 457 | 12.8 | ||
Labour | Margaret Dyer | 451 | 12.6 | ||
Labour | Wendy Virginia Pengelly | 414 | 11.5 | ||
UKIP | Andrew Edward Wilkinson | 291 | 8.1 | ||
Turnout | 3579 | 28.3 | |||
Party | Candidate | Votes | % | ± | |
---|---|---|---|---|---|
Conservative | Albert Edward Vines | 567 | 27.3 | ||
Conservative | John Thomas Curtis | 551 | 26.6 | ||
Labour | Janet Cynthia Miller | 324 | 15.6 | ||
UKIP | Bernard Arthur Smith | 321 | 15.5 | ||
Labour | Sidney William Hoy | 312 | 15.0 | ||
Turnout | 2075 | 33.3 | |||
Party | Candidate | Votes | % | ± | |
---|---|---|---|---|---|
Liberal Democrat | Diana Joy Pound | 295 | 47.4 | ||
Independent | Patricia Mary Tull | 182 | 29.3 | ||
Labour | Robert Harvey Jaffa | 79 | 12.7 | ||
UKIP | Derek Hunnikin | 66 | 10.6 | ||
Turnout | 622 | 34.6 | |||
Party | Candidate | Votes | % | ± | |
---|---|---|---|---|---|
Conservative | Mary Marrs | 743 | 16.1 | ||
Conservative | Graham Hamilton Hicks | 739 | 16.0 | ||
Liberal Democrat | Barbara Gowlett | 684 | 14.8 | ||
Conservative | Nigel Charles Brown | 679 | 14.7 | ||
Liberal Democrat | James Richard Jennings | 623 | 13.5 | ||
Liberal Democrat | Penelope Anne Blackmore | 530 | 11.5 | ||
UKIP | Alicia Ruth Denny | 170 | 3.7 | ||
Labour | June Mary Leonard | 159 | 3.4 | ||
Labour | Duncan Hollowood | 149 | 3.2 | ||
Labour | Marguerite Lawrence | 145 | 3.1 | ||
Turnout | 4621 | 30.7 | |||
Party | Candidate | Votes | % | ± | |
---|---|---|---|---|---|
Conservative | John Lorraine Cherry | 547 | 67.8 | ||
Liberal Democrat | Daniel John Warner | 260 | 32.2 | ||
Turnout | 807 | 43.1 | |||
Party | Candidate | Votes | % | ± | |
---|---|---|---|---|---|
Liberal Democrat | Joyce Meyer | 258 | 52.1 | ||
Conservative | Paul Newton-Lewis | 204 | 41.2 | ||
Labour | Andrew Young | 33 | 6.7 | ||
Turnout | 495 | 28.7 | |||
Party | Candidate | Votes | % | ± | |
---|---|---|---|---|---|
Conservative | Maureen Eleanor Elliott | 391 | 63.7 | ||
Labour | John Baker | 122 | 19.9 | ||
UKIP | Reginald Rodger Willoughby Musgrave | 101 | 16.4 | ||
Turnout | 614 | 36.5 | |||
Party | Candidate | Votes | % | ± | |
---|---|---|---|---|---|
Conservative | Anthony John Davies | 938 | 31.1 | ||
Conservative | Peter Edward Jones | 843 | 27.9 | ||
Liberal Democrat | Roger Walter Tilbury | 346 | 11.5 | ||
UKIP | Roger Lewis Wilson | 325 | 10.8 | ||
Liberal Democrat | Simon Green | 285 | 9.4 | ||
Labour | Gordon Trevor Churchill | 107 | 3.5 | ||
Green | Joan Marjorie Welch | 93 | 3.1 | ||
Labour | Kenneth Alex Newman | 81 | 2.7 | ||
Turnout | 3018 | 40.8 | |||
Party | Candidate | Votes | % | ± | |
---|---|---|---|---|---|
Conservative | Robert Harry Field | 481 | 61.7 | ||
Liberal Democrat | John Edward Barstow | 299 | 38.3 | ||
Turnout | 780 | 40.8 | |||
See Chichester local elections for by-election results after this election.
The Borough of Copeland is a local government district and borough in western Cumbria, England. Its council is based in Whitehaven. It was formed on 1 April 1974 by the merger of the Borough of Whitehaven, Ennerdale Rural District and Millom Rural District. The population of the Non-Metropolitan district at the 2011 Census was 70,603.
Chichester is a largely rural local government district in West Sussex, England. Its council is based in the city of Chichester.
Frederick Walter Scott Craig was a Scottish psephologist and compiler of the standard reference books covering United Kingdom Parliamentary election results. He originally worked in public relations, compiling election results in his spare time which were published by the Scottish Unionist Party. In the late 1960s he launched his own business as a publisher of reference books, and also compiled various other statistics concerning British politics.
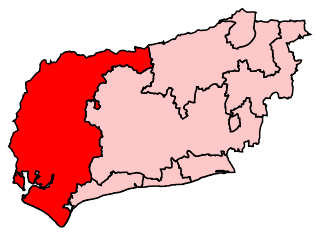
Chichester is a constituency in West Sussex, represented in the House of Commons of the UK Parliament since 2017 by Gillian Keegan of the Conservative Party.
Arun District Council in West Sussex, England is elected every four years. Since the last boundary changes in 2015, 54 councillors have been elected from 23 wards.
Chichester District Council in West Sussex, England is elected every four years. Since the last boundary changes in 2003, 48 councillors have been elected from 29 wards.
The 2003 Harlow District Council election took place on 1 May 2003 to elect members of Harlow District Council in Essex, England. One third of the council was up for election and the council stayed under no overall control.
Bourne is an electoral division of West Sussex in the United Kingdom, and returns one member to sit on West Sussex County Council. The former County Councillor, Mark Dunn, was also Chairman of West Sussex County Council. He lost his seat in 2013 to Sandra James of the United Kingdom Independence Party.
Chichester East is an electoral division of West Sussex in the United Kingdom, and returns one member to sit on West Sussex County Council.
Chichester North is an electoral division of West Sussex in the United Kingdom, and returns one member to sit on West Sussex County Council.
Chichester South is an electoral division of West Sussex in the United Kingdom, and returns one member to sit on West Sussex County Council.
Chichester West is an electoral division of West Sussex in the United Kingdom, and returns one member to sit on West Sussex County Council. The current County Councillor, Louise Goldsmith, is also Cabinet Member for Finance & Resources.
Fernhurst is an electoral division of West Sussex in the United Kingdom, and returns one member to sit on West Sussex County Council.
Elections to Chichester District Council in West Sussex, United Kingdom were held on 3 May 2007. The whole council was up for election and the Conservative Party held overall control with an increased majority.
Midhurst is an electoral division of West Sussex in the United Kingdom, and returns one member to sit on West Sussex County Council.
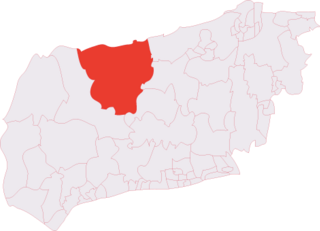
Petworth is an electoral division of West Sussex in the United Kingdom, and returns one member to sit on West Sussex County Council.
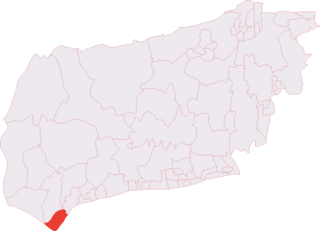
Selsey is an electoral division of West Sussex in the United Kingdom, and returns one member to sit on West Sussex County Council.
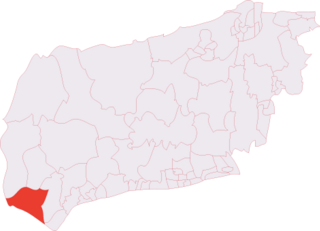
The Witterings is an electoral division of West Sussex in the United Kingdom, and returns one member to sit on West Sussex County Council.
The 2003 Welwyn Hatfield District Council election took place on 1 May 2003 to elect members of Welwyn Hatfield District Council in Hertfordshire, England. One third of the council was up for election and the Conservative party stayed in overall control of the council.
The 2003 Rother District Council election took place on 1 May 2003 to elect members of Rother District Council in East Sussex, England. The whole council was up for election after boundary changes reduced the number of seats by 7. The Conservative party stayed in overall control of the council.