Elections to Adur District Council were held on 4 May 2000. One third of the council was up for election and the council stayed under no overall control. Overall turnout was 36.5%.
In the context of local authorities in the United Kingdom, the term no overall control refers to a situation in which no single political group achieves a majority of seats; and is analogous to a hung parliament. Of the 310 councils who had members up for election in the 2007 local elections, 85 resulted in a NOC administration.
After the election, the composition of the council was
The Conservative Party, officially the Conservative and Unionist Party, is a centre-right political party in the United Kingdom. Presently led by Theresa May, it has been the governing party since 2010. It presently has 314 Members of Parliament in the House of Commons, 249 members of the House of Lords, and 18 members of the European Parliament. It also has 31 Members of the Scottish Parliament, 12 members of the Welsh Assembly, eight members of the London Assembly and 9,008 local councillors. One of the major parties of UK politics, it has formed the government on 45 occasions, more than any other party.
The Labour Party is a centre-left political party in the United Kingdom which has been described as an alliance of social democrats, democratic socialists and trade unionists. The party's platform emphasises greater state intervention, social justice and strengthening workers' rights.
The Liberal Democrats are a liberal political party in the United Kingdom. They presently have 11 Members of Parliament in the House of Commons, 96 members of the House of Lords, and one member of the European Parliament. They also have five Members of the Scottish Parliament and a member each in the Welsh Assembly and London Assembly. The party reached the height of its influence in the early 2010s, forming a junior partner in a coalition government from 2010 to 2015. It is presently led by Vince Cable.
Party | Seats | Gains | Losses | Net gain/loss | Seats % | Votes % | Votes | +/− | |
---|---|---|---|---|---|---|---|---|---|
Conservative | 10 | 6 | 0 | +6 | 66.7 | 40.8 | 7,733 | ||
Liberal Democrat | 2 | 0 | 4 | -4 | 13.3 | 22.9 | 4,343 | ||
Shoreham Beach Residents Association | 2 | 0 | 0 | 0 | 13.3 | 7.8 | 1,487 | ||
Labour | 1 | 0 | 2 | -2 | 6.7 | 28.4 | 5,388 | ||
Party | Candidate | Votes | % | ± | |
---|---|---|---|---|---|
Conservative | Frances Fletcher | 861 | 63.2 | ||
Liberal Democrat | Andrew Miller | 314 | 23.0 | ||
Labour | Stephen Mear | 188 | 13.8 | ||
Majority | 547 | 40.2 | |||
Turnout | 1,363 | 34.7 | |||
Conservative hold | Swing | ||||
Party | Candidate | Votes | % | ± | |
---|---|---|---|---|---|
Conservative | Antony Strudwick | 476 | 37.6 | ||
Labour | Ann Bridges | 424 | 33.5 | ||
Liberal Democrat | Christine Allen | 365 | 28.9 | ||
Majority | 52 | 4.1 | |||
Turnout | 1,265 | 33.8 | |||
Conservative gain from Liberal Democrat | Swing | ||||
Party | Candidate | Votes | % | ± | |
---|---|---|---|---|---|
Labour | Barry Mear | 510 | 50.7 | ||
Liberal Democrat | Tracey Clarke | 256 | 25.4 | ||
Conservative | Andrew McGregor | 241 | 23.9 | ||
Majority | 254 | 25.3 | |||
Turnout | 1,007 | 28.1 | |||
Labour hold | Swing | ||||
Party | Candidate | Votes | % | ± | |
---|---|---|---|---|---|
Conservative | James Funnell | 540 | 43.2 | ||
Labour | Teana Ashley | 530 | 42.3 | ||
Liberal Democrat | Stephen Biggs | 182 | 14.5 | ||
Majority | 10 | 0.9 | |||
Turnout | 1,252 | 35.9 | |||
Conservative gain from Labour | Swing | ||||
Party | Candidate | Votes | % | ± | |
---|---|---|---|---|---|
Conservative | Robert Dunn | 585 | 44.1 | ||
Labour | Jeanette White | 460 | 34.6 | ||
Liberal Democrat | Anne Abbott | 283 | 21.3 | ||
Majority | 125 | 9.5 | |||
Turnout | 1,328 | 39.2 | |||
Conservative gain from Liberal Democrat | Swing | ||||
Party | Candidate | Votes | % | ± | |
---|---|---|---|---|---|
Liberal Democrat | Barbara Runnalls | 535 | 48.8 | ||
Conservative | Felicity Deen | 426 | 38.9 | ||
Labour | Ronald Horne | 135 | 12.3 | ||
Majority | 109 | 9.9 | |||
Turnout | 1,096 | 33.6 | |||
Liberal Democrat hold | Swing | ||||
Party | Candidate | Votes | % | ± | |
---|---|---|---|---|---|
Shoreham Beach Residents Association | Elizabeth McKinney | 799 | |||
Shoreham Beach Residents Association | Maurice Pitchford | 688 | |||
Conservative | Kay Haffenden | 579 | |||
Labour | Alan Mair | 47 | |||
Labour | Christopher Pescott | 39 | |||
Turnout | 2,152 | 43.7 | |||
Independent hold | Swing | ||||
Party | Candidate | Votes | % | ± | |
---|---|---|---|---|---|
Liberal Democrat | Sharon Wood | 318 | 39.2 | ||
Labour | Martin Horner | 269 | 33.2 | ||
Conservative | Paul Curtis | 224 | 27.6 | ||
Majority | 49 | 6.0 | |||
Turnout | 811 | 28.2 | |||
Liberal Democrat hold | Swing | ||||
Party | Candidate | Votes | % | ± | |
---|---|---|---|---|---|
Conservative | Donald Phillips | 500 | 41.5 | ||
Liberal Democrat | Gillian Hammond | 358 | 29.7 | ||
Labour | Timothy Saddler | 348 | 28.8 | ||
Majority | 142 | 11.8 | |||
Turnout | 1,206 | 38.2 | |||
Conservative hold | Swing | ||||
Party | Candidate | Votes | % | ± | |
---|---|---|---|---|---|
Conservative | Brian Coomber | 668 | 44.1 | ||
Labour | Eileen Jones | 538 | 35.5 | ||
Liberal Democrat | David Steadman | 310 | 20.4 | ||
Majority | 130 | 8.6 | |||
Turnout | 1,516 | 39.5 | |||
Conservative hold | Swing | ||||
Party | Candidate | Votes | % | ± | |
---|---|---|---|---|---|
Conservative | Paul Graysmark | 580 | 44.8 | ||
Labour | Nigel Sweet | 548 | 42.3 | ||
Liberal Democrat | Christian Dunford | 167 | 12.9 | ||
Majority | 32 | 2.5 | |||
Turnout | 1,295 | 40.1 | |||
Conservative gain from Labour | Swing | ||||
Party | Candidate | Votes | % | ± | |
---|---|---|---|---|---|
Conservative | David Ashley | 633 | |||
Conservative | Julie Searle | 571 | |||
Liberal Democrat | Martin King | 521 | |||
Liberal Democrat | John Hilditch | 473 | |||
Labour | Graham Bucknall | 464 | |||
Labour | Francis Partridge | 385 | |||
Turnout | 3,047 | 42.6 | |||
Conservative gain from Liberal Democrat | Swing | ||||
Party | Candidate | Votes | % | ± | |
---|---|---|---|---|---|
Conservative | Wendy Gray | 849 | 52.6 | ||
Labour | James Largue | 503 | 31.2 | ||
Liberal Democrat | Shriley Rance | 261 | 16.2 | ||
Majority | 346 | 21.4 | |||
Turnout | 1,613 | 36.7 | |||
Conservative hold | Swing | ||||
Half of Adur District Council in West Sussex, England is elected every two years. Until 2003, the council was elected by thirds. Since the last boundary changes in 2004, 29 councillors have been elected from 14 wards.
The 1998 Adur District Council election took place on 7 May 1998 to elect members of Adur District Council in West Sussex, England. One third of the council was up for election and the Liberal Democrats stayed in overall control of the council.
The 1998 Adur District Council election took place on 6 May 1999 to elect members of Adur District Council in West Sussex, England. One third of the council was up for election and the Liberal Democrat party lost overall control of the council to no overall control.
Elections to Adur District Council were held on 2 May 2002. One third of the council was up for election and the Conservative party gained control of the council from no overall control. Overall turnout was 33%.
Elections to Adur District Council were held on 1 May 2003. One third of the council was up for election and the Conservative party held overall control of the council. Overall turnout was 31.7%.
Elections to Adur District Council were held on 10 June 2004. The whole council was up for election with boundary changes since the last election in 2003 reducing the number of seats by 10. The Conservative party held overall control of the council. Overall turnout was 38.0%.
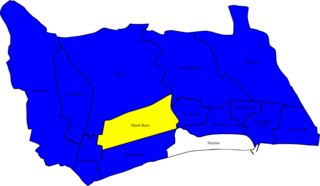
Elections to Adur District Council were held on 4 May 2006. Half of the council was up for election and the Conservative party held overall control of the council.
Elections to Adur District Council in West Sussex, England were held on 1 May 2008. Half of the council was up for election and the Conservative party held overall control of the council.
The 2010 Adur District Council election took place on 6 May 2010 to elect members of Adur District Council in West Sussex, England. Half of the council was up for election and the Conservative party stayed in overall control of the council.
The 2012 Adur District Council elections took place on 3 May 2012 to elect members of Adur District Council in West Sussex, England. Half of the council was up for election, and the Conservative Party remained in overall control of the council.
The 2016 Adur District Council elections took place on 5 May 2016 to elect members of Adur District Council in West Sussex, England. Half of the council was up for election, and the Conservative Party remained in overall control of the council. The Labour Party trebled their number of seats from one to three.
The first elections to the newly created Adur District Council established by the Local Government Act 1972 in England and Wales were held 7 June 1973. Overall turnout was recorded at 46.6%.
Elections to the Adur District Council were held on 6 May 1976, with the entire council up for election. The two councillors in Marine elected as Residents were defending their seats as Independents. Overall turnout was recorded at 51.8%.
Elections to the Adur District Council were held on 3 May 1979, alongside the general election. The entire council was up for election, following boundary changes that reduced the number of wards by one, but altogether had added an additional two seats. Overall turnout was recorded at 74.4%.
Elections to the Adur District Council were held on 1 May 1980, with one third of the council up for election. There was an additional vacancy in the Southwick Green ward, and no elections for the single-member ward St Marys. Overall turnout dropped to 48.7%.
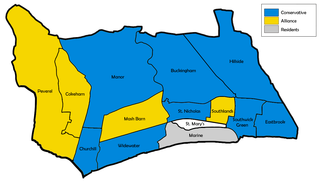
Elections to the Adur District Council were held on 6 May 1982, with one third of the council up for election. There was additional vacancies in the Mash Barn and Peverel wards, but no elections for the single-member ward St Marys and Residents stronghold, Marine, went uncontested. In the intervening years, the newly formed Alliance had gained three seats at the expense of the Conservatives. Overall turnout fell to 42.4%.
Elections to the Adur District Council were held on 5 May 1983, with one third of the council up for election. There was an additional vacancy in the Peverel ward and no elections for the Marine ward. Overall turnout climbed to 47.6%.
Elections to the Adur District Council were held on 3 May 1984, with one third of the council up for election. There was no elections held for the single-member St Mary's ward. Overall turnout was recorded at 45.6%.
Elections to the Adur District Council were held on 7 May 1987, with one third of the council up for election. There were additional vacancies in the Churchill and Widewater wards and no elections for the two-member Marine ward. Overall turnout climbed to 48.3%.
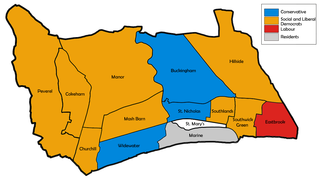
Elections to the Adur District Council were held on 3 May 1990, with one third of the council up for election, as well as vacancies in the Churchill and Manor wards. No elections were held for the single-member St Mary's ward. The sitting Resident councillor in Overall turnout jumped to 49.8%.