Adur District Council election, 1976

Last updated
Adur District Council election, 1976

Flag of England.svg


  1973 6 May 1976 1979  

All 37 seats to Adur District Council
19 seats needed for a majority

 First partySecond partyThird party
 
Party Liberal Conservative Labour
Seats won17162
Seat changeIncrease2.svg1Increase2.svg3Decrease2.svg3

Majority party before election

No Overall Control

Majority party after election

No Overall Control

Elections to the Adur District Council were held on 6 May 1976, with the entire council up for election. The two councillors in Marine elected as Residents were defending their seats as Independents. Overall turnout was recorded at 51.8%. [1]

Non-metropolitan district Type of local government district in England

Non-metropolitan districts, or colloquially "shire districts", are a type of local government district in England. As created, they are sub-divisions of non-metropolitan counties in a two-tier arrangement.

Contents

The election resulted in the council remaining under no overall control. [2] [3]

Election result

Adur District Council Election Result 1976 [2]
PartySeatsGainsLossesNet gain/lossSeats %Votes %Votes+/−
  Liberal 1743+145.936.28,392+6.3
  Conservative 1641+343.244.810,369+1.8
  Labour 214-35.415.53,586-4.9
  Residents 20005.43.5816+0.2

This resulted in the following composition of the council [2] :

PartyPrevious councilNew council
Liberal1617
Conservative1316
Labour52
Independent Residents22
Independent10
Total3737
Working majority -5  -3 

Ward results

+/- figures represent changes from the last time these wards were contested.

Marine (2422) [2]
PartyCandidateVotes%±
Independent Warner B. Ms.81663.3+5.9
Independent James P. Ms.802
Conservative Speight J.33926.3-10.2
Conservative Maltby C.329
Liberal Brook D. Ms.856.6+6.6
Liberal Craig M.71
Labour Greig P. Ms.493.8-2.3
Majority47737.0+16.1
Turnout 1,28953.2+4.0
Independent hold Swing
Independent hold Swing +8.0
No. 1 (Shoreham: Buckingham) (3333) [2]
PartyCandidateVotes%±
Conservative Elliott I.1,06565.0+10.2
Conservative Gumbrell P.1,064
Liberal Conway E.47529.0-10.2
Liberal Arscott K.440
Labour Snowden H.986.0+0.0
Majority59036.0+20.4
Turnout 1,63849.5+11.4
Conservative hold Swing
Conservative hold Swing +10.2
No. 2 (Shoreham: Kingston Buci) (2565) [2]
PartyCandidateVotes%±
Liberal Little S.56243.7+43.7
Liberal Russell G.511
Conservative Morris H. Ms.45535.4+2.8
Conservative Rocker E. Ms.409
Labour Spence M. Ms.26920.9-46.5
Labour Whipp B.261
Majority1078.3-26.4
Turnout 1,28650.7+10.6
Liberal gain from Labour Swing
Liberal gain from Labour Swing +23.2
No. 3 (Shoreham: Kingston St.Julians) (2957) [2]
PartyCandidateVotes%±
Conservative Smith M.58739.5-11.6
Liberal Swatheridge W.57638.7+38.7
Conservative Divers A.568
Liberal White J.528
Labour Greig P.32421.8-27.1
Labour Porter B.288
Majority110.7-1.5
Turnout 1,48752.4+5.7
Conservative hold Swing
Liberal gain from Labour Swing +25.1
No. 5 (Shoreham: St. Marys) (2100) [2]
PartyCandidateVotes%±
Conservative Richards F. Ms.57753.9+4.1
Conservative Potter E.519
Liberal Wright G. Ms.35433.1-6.8
Liberal Goldsmith P.303
Labour Ruff M.14013.1+2.7
Labour Whipp L. Ms.139
Majority22320.8+10.9
Turnout 1,07150.7+1.5
Conservative hold Swing
Conservative hold Swing +5.4
No. 6 (Shoreham: St. Nicholas) (2242) [2]
PartyCandidateVotes%±
Conservative McNeill A.63847.4-0.8
Liberal Robinson J.60144.7+2.1
Conservative Robbins W.596
Liberal Jewiss A.553
Labour Cousin E.1067.9-1.3
Majority372.8-2.9
Turnout 1,34559.5+12.8
Conservative hold Swing
Liberal gain from Conservative Swing +1.4
No. 7 (Southwick: Central) (2054) [2]
PartyCandidateVotes%±
Conservative Wey G.67157.8+10.8
Conservative Coghlan J.648
Liberal Williams H.25121.6+21.6
Liberal Andrews M.239
Labour Barnard I.23820.5-6.1
Labour Livingston M.218
Majority42036.2+15.7
Turnout 1,16057.4-8.5
Conservative hold Swing
Conservative hold Swing -5.4
No. 8 (Southwick: Fishergate) (1249) [2]
PartyCandidateVotes%±
Labour Boreham L.28542.9+42.9
Conservative Dunn R.24136.2-7.1
Liberal Cooper M.13920.9+20.9
Majority446.6-6.7
Turnout 66553.8+3.0
Labour gain from Independent Swing +25.0
No. 9 (Southwick: North) (2379) [2]
PartyCandidateVotes%±
Conservative Hale D.59546.5-3.4
Conservative Greenyer J.574
Labour Clark R.40331.5-18.6
Labour Bickers H.390
Liberal Taylor L.28122.0+22.0
Liberal Gadsby P. Ms.268
Majority19215.0+14.8
Turnout 1,27956.9+6.3
Conservative gain from Labour Swing
Conservative hold Swing +7.6
No. 10 (Southwick: South) (985) [2]
PartyCandidateVotes%±
Labour Hobbis J.33758.8-5.6
Conservative Kirkhope J. Ms.17129.8-5.7
Liberal King M. Ms.6511.3+11.3
Majority16629.0+0.1
Turnout 57359.3+3.4
Labour hold Swing +0.0
No. 11 (Southwick: West) (2449) [2]
PartyCandidateVotes%±
Conservative Barber R.76562.1-0.4
Conservative Sweet I. Ms.761
Liberal Symonds A.25220.5+20.5
Liberal Deedman J. Ms.251
Labour Munnery D.21417.4-20.1
Majority51341.7+16.7
Turnout 1,23151.1+0.8
Conservative hold Swing
Conservative hold Swing -10.4
No. 12 (Lancing: East) (4554) [2]
PartyCandidateVotes%±
Liberal Deedman D.1,04647.2-8.2
Liberal Sherlock M. Ms.1,032
Liberal Isherwood D. Ms.1,009
Liberal Allen C. Ms.1,009
Conservative Bailey M.89840.6+4.6
Conservative Melvey T.846
Conservative Chipperfield K.839
Conservative Collins M.833
Labour Power J. Ms.27012.2+3.6
Labour Harwood J. Ms.235
Majority1486.7-12.8
Turnout 2,21448.4-0.3
Liberal hold Swing
Liberal hold Swing
Liberal hold Swing
Liberal hold Swing -6.4
No. 13 (Lancing: West) (4435) [2]
PartyCandidateVotes%±
Conservative Burley Y. Ms.1,06047.2+3.4
Conservative Kemp C.983
Conservative Stepney L. Ms.971
Conservative Thompson G.941
Liberal Brooks J.90340.2-4.3
Liberal Baird D.826
Liberal Hartman E. Ms.794
Liberal Walters J. Ms.768
Labour Harwood R.28212.6+1.0
Labour Price A.281
Labour Cruse D.255
Labour Jacques W.251
Majority1577.0+6.3
Turnout 2,24549.9+7.6
Conservative gain from Liberal Swing
Conservative hold Swing
Conservative gain from Liberal Swing
Conservative gain from Liberal Swing +3.8
No. 14 (Lancing: North) (4717) [2]
PartyCandidateVotes%±
Liberal Robinson C. Ms.1,33850.1-6.5
Liberal Griffiths Y. Ms.1,200
Liberal Ghose D. Ms.1,171
Liberal Swadling M.1,142
Conservative Wilkinson F.1,07840.3+6.1
Conservative Floyd J.1,009
Conservative Hussey D.977
Conservative Dixon J. Ms.975
Labour Goddard F.2569.6+0.4
Majority2609.7-12.7
Turnout 2,67254.0+8.7
Liberal hold Swing
Liberal hold Swing
Liberal hold Swing
Liberal hold Swing -6.3
No. 15 (Sompting) (6568) [2]
PartyCandidateVotes%±
Liberal Charlton J.1,46448.7-17.1
Liberal Cheal J.1,461
Liberal Green B.1,431
Liberal Underwood J.1,419
Liberal Burridge B.1,418
Conservative Bacon I.1,22940.9+6.6
Conservative Lodge R.1,197
Conservative Moynan T.1,149
Conservative Gristwood R.1,145
Conservative Robinson E.1,135
Labour Burns F.31510.5+10.5
Labour Forbes P.279
Labour Tufnell C. Ms.263
Labour Message D.257
Labour Tufnell C.255
Majority2357.8-23.8
Turnout 3,00847.5+11.6
Liberal hold Swing
Liberal hold Swing
Liberal hold Swing
Liberal hold Swing
Liberal hold Swing -11.8

Related Research Articles

Half of Adur District Council in West Sussex, England is elected every two years. Until 2003, the council was elected by thirds. Since the last boundary changes in 2004, 29 councillors have been elected from 14 wards.

The 1998 Adur District Council election took place on 6 May 1999 to elect members of Adur District Council in West Sussex, England. One third of the council was up for election and the Liberal Democrat party lost overall control of the council to no overall control.

Elections to Adur District Council were held on 2 May 2002. One third of the council was up for election and the Conservative party gained control of the council from no overall control. Overall turnout was 33%.

Elections to Adur District Council were held on 1 May 2003. One third of the council was up for election and the Conservative party held overall control of the council. Overall turnout was 31.7%.

2004 Adur District Council election

Elections to Adur District Council were held on 10 June 2004. The whole council was up for election with boundary changes since the last election in 2003 reducing the number of seats by 10. The Conservative party held overall control of the council. Overall turnout was 38.0%.
2006 Adur District Council election

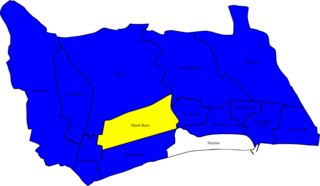
Elections to Adur District Council were held on 4 May 2006. Half of the council was up for election and the Conservative party held overall control of the council.

2008 Adur District Council election

Elections to Adur District Council in West Sussex, England were held on 1 May 2008. Half of the council was up for election and the Conservative party held overall control of the council.

2010 Adur District Council election

The 2010 Adur District Council election took place on 6 May 2010 to elect members of Adur District Council in West Sussex, England. Half of the council was up for election and the Conservative party stayed in overall control of the council.

2012 Adur District Council election

The 2012 Adur District Council elections took place on 3 May 2012 to elect members of Adur District Council in West Sussex, England. Half of the council was up for election, and the Conservative Party remained in overall control of the council.

2016 Adur District Council election

The 2016 Adur District Council elections took place on 5 May 2016 to elect members of Adur District Council in West Sussex, England. Half of the council was up for election, and the Conservative Party remained in overall control of the council. The Labour Party trebled their number of seats from one to three.

The first elections to the newly created Adur District Council established by the Local Government Act 1972 in England and Wales were held 7 June 1973. Overall turnout was recorded at 46.6%.

1979 Adur District Council election

Elections to the Adur District Council were held on 3 May 1979, alongside the general election. The entire council was up for election, following boundary changes that reduced the number of wards by one, but altogether had added an additional two seats. Overall turnout was recorded at 74.4%.

1980 Adur District Council election

Elections to the Adur District Council were held on 1 May 1980, with one third of the council up for election. There was an additional vacancy in the Southwick Green ward, and no elections for the single-member ward St Marys. Overall turnout dropped to 48.7%.
1982 Adur District Council election

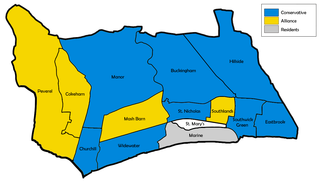
Elections to the Adur District Council were held on 6 May 1982, with one third of the council up for election. There was additional vacancies in the Mash Barn and Peverel wards, but no elections for the single-member ward St Marys and Residents stronghold, Marine, went uncontested. In the intervening years, the newly formed Alliance had gained three seats at the expense of the Conservatives. Overall turnout fell to 42.4%.

1983 Adur District Council election

Elections to the Adur District Council were held on 5 May 1983, with one third of the council up for election. There was an additional vacancy in the Peverel ward and no elections for the Marine ward. Overall turnout climbed to 47.6%.

1984 Adur District Council election

Elections to the Adur District Council were held on 3 May 1984, with one third of the council up for election. There was no elections held for the single-member St Mary's ward. Overall turnout was recorded at 45.6%.

1986 Adur District Council election

Elections to the Adur District Council were held on 8 May 1986, with minor boundary changes taking effect, impacting the Peverel ward. One third of the council was due for re-election, with additional vacancies in Buckingham, Churchill and Mash Barn wards. No elections were to be held for the single-member St Mary's ward. The formerly Conservative councillor for Southwick Green was defending the seat as an Independent, with no Conservative contesting that ward. Overall turnout was down slightly to 45.3%.

1987 Adur District Council election

Elections to the Adur District Council were held on 7 May 1987, with one third of the council up for election. There were additional vacancies in the Churchill and Widewater wards and no elections for the two-member Marine ward. Overall turnout climbed to 48.3%.

1988 Adur District Council election

Elections to the Adur District Council were held on 5 May 1988, with one third of the council up for election however no elections were held for the single-member ward St Mary's. Overall turnout dropped to 42.5%.
1990 Adur District Council election

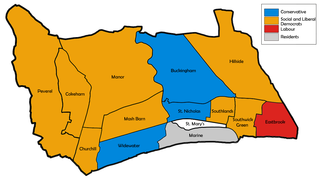
Elections to the Adur District Council were held on 3 May 1990, with one third of the council up for election, as well as vacancies in the Churchill and Manor wards. No elections were held for the single-member St Mary's ward. The sitting Resident councillor in Overall turnout jumped to 49.8%.
References

  1. Local elections in Britain: a statistical digest, edited by Colin Rallings and Michael Thrasher. 2nd Edition 2003
  2. 1 2 3 4 5 6 7 8 9 10 11 12 13 14 15 16 17 18 "Elections Centre: Adur 1973-2012" (PDF). electionscentre.co.uk/plymouth.ac.uk. Retrieved 2017-07-25.
  3. "Vote 2012: Adur". bbc.co.uk. Retrieved 2018-03-18.