This article needs additional citations for verification . (July 2015) (Learn how and when to remove this template message) |
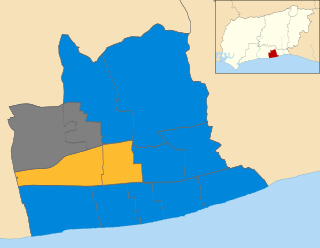
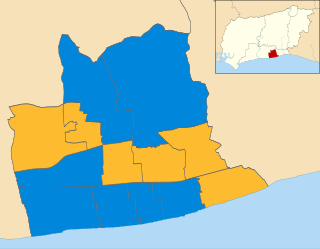
The 2011 Worthing Borough Council election took place on 5 May 2011 to elect members of Worthing Borough Council in West Sussex, England. One third of the council was up for election, with the exception of the two member wards of Durrington and Northbrook. The Conservative party retained overall control of the council. [1]
Worthing is a large seaside town in England, and district with borough status in West Sussex. It is situated at the foot of the South Downs, 10 miles (16 km) west of Brighton, and 18 miles (29 km) east of the county town of Chichester. With an estimated population of 104,600 and an area of 12.5 square miles (32.37 km2) the borough is the second largest component of the Brighton/Worthing/Littlehampton conurbation, which makes it part of the 15th most populous urban area in the United Kingdom. Since 2010 northern parts of the borough, including the Worthing Downland Estate, have formed part of the South Downs National Park.
Borough status in the United Kingdom is granted by royal charter to local government districts in England, Wales and Northern Ireland. The status is purely honorary, and does not give any additional powers to the council or inhabitants of the district. In Scotland, similarly chartered communities were known as royal burghs, although the status is no longer granted.
West Sussex is a county in the south of England, bordering East Sussex to the east, Hampshire to the west and Surrey to the north, and to the south the English Channel.
After the election, the composition of the council was
The Conservative Party, officially the Conservative and Unionist Party, is a centre-right political party in the United Kingdom. Presently led by Theresa May, it has been the governing party since 2010. It presently has 314 Members of Parliament in the House of Commons, 249 members of the House of Lords, and 18 members of the European Parliament. It also has 31 Members of the Scottish Parliament, 12 members of the Welsh Assembly, eight members of the London Assembly and 9,008 local councillors. One of the major parties of UK politics, it has formed the government on 45 occasions, more than any other party.
The Liberal Democrats are a liberal, centrist political party in the United Kingdom. They presently have 11 Members of Parliament in the House of Commons, 96 members of the House of Lords, and one member of the European Parliament. They also have five Members of the Scottish Parliament and a member each in the Welsh Assembly and London Assembly. The party reached the height of its influence in the early 2010s, forming a junior partner in a coalition government from 2010 to 2015. It is presently led by Vince Cable.
Party | Seats | Gains | Losses | Net gain/loss | Seats % | Votes % | Votes | +/− | |
---|---|---|---|---|---|---|---|---|---|
Conservative | 11 | 1 | 1 | 0 | 84.6 | ||||
Liberal Democrat | 2 | 1 | 1 | 0 | 15.4 | ||||
UKIP | 0 | 0 | 0 | 0 | 0 | ||||
Labour | 0 | 0 | 0 | 0 | 0 | ||||
Green | 0 | 0 | 0 | 0 | 0 |
Party | Candidate | Votes | % | ± | |
---|---|---|---|---|---|
Liberal Democrat | Victoria Michelle Taylor | 979 | 38.2 | - 2.6 | |
Conservative | Michael Pisko | 828 | 32.3 | -8.9 | |
Labour | John Turley | 479 | 18.6 | +10.3 | |
UKIP | John Strange | 276 | 10.7 | +3.3 | |
Rejected ballots | 13 | 0.5 | +0.02 | ||
Majority | 151 | 5.86 | +6.72 | ||
Turnout | 2575 | 38 | -25 | ||
Liberal Democrat gain from Conservative | Swing | 3.36 Conservative to Liberal Democrats | |||
Party | Candidate | Votes | % | ± | |
---|---|---|---|---|---|
Conservative | Daniel Humphreys | 892 | |||
Liberal Democrat | Robin Rogers | 807 | |||
Labour | Russel Dean | 436 | |||
UKIP | Christopher Chatfield | 251 | |||
Rejected ballots | 16 | ||||
Majority | 85 | ||||
Turnout | 38.9 | - 21.1 | |||
Conservative gain from Liberal Democrat | Swing | ||||
Party | Candidate | Votes | % | ± | |
---|---|---|---|---|---|
Conservative | Clive Roberts | 893 | |||
Liberal Democrat | Christine Allen | 600 | |||
Labour | Janet Haden | 528 | |||
UKIP | Christopher Woodward | 202 | |||
Rejected ballots | 31 | ||||
Majority | 293 | ||||
Turnout | 32.1 | -21.9 | |||
Conservative hold | Swing | ||||
Party | Candidate | Votes | % | ± | |
---|---|---|---|---|---|
Conservative | Bryan Turner | 1,133 | 42.5 | ||
Liberal Democrat | Keith Sunderland | 767 | 28.7 | ||
Labour | John Steels | 485 | 18.2 | ||
UKIP | John Harwood | 281 | 10.5 | ||
Rejected ballots | 15 | ||||
Majority | 366 | ||||
Turnout | 40 | -24 | |||
Conservative hold | Swing | ||||
Party | Candidate | Votes | % | ± | |
---|---|---|---|---|---|
Conservative | Roy Barraclough | 1956 | |||
Labour | James Elwood | 411 | |||
UKIP | Richard Bater | 385 | |||
Green | David Aherne | 382 | |||
Liberal Democrat | Michael Finch | 253 | |||
Rejected ballots | 16 | ||||
Majority | 1,545 | ||||
Turnout | 50.7 | 21.8 | |||
Conservative hold | Swing | ||||
Party | Candidate | Votes | % | ± | |
---|---|---|---|---|---|
Conservative | Paul Howard | 1,144 | |||
Labour | Susan Marsh | 598 | |||
Liberal Democrat | Wayne Hoban | 433 | |||
Rejected ballots | 27 | ||||
Majority | 546 | ||||
Turnout | 35.4 | -20.6 | |||
Conservative hold | Swing | ||||
Party | Candidate | Votes | % | ± | |
---|---|---|---|---|---|
Conservative | Paul Yalop | 1614 | |||
Labour | Alexandra Wagstaff | 465 | |||
Liberal Democrat | Yvonne Leonard | 448 | |||
UKIP | Phillip Ruddock | 312 | |||
Rejected ballots | 19 | ||||
Majority | 1149 | ||||
Turnout | 2858 | 44.1 | -20.9 | ||
Conservative hold | Swing | ||||
Party | Candidate | Votes | % | ± | |
---|---|---|---|---|---|
Conservative | Graham Fabes | 1754 | 58.9 | ||
UKIP | Michael Glennon | 465 | 15.6 | ||
Liberal Democrat | Neil Condon | 431 | 14.4 | ||
Labour | Ann Saunders | 327 | 11.0 | ||
Rejected ballots | 17 | ||||
Majority | 1,289 | ||||
Turnout | 47.9 | -26.1 | |||
Conservative hold | Swing | ||||
Party | Candidate | Votes | % | ± | |
---|---|---|---|---|---|
Conservative | Noël Atkins | 1539 | |||
UKIP | Patricia Hall | 443 | |||
Liberal Democrat | Emma Davies | 415 | |||
Labour | Linda Salter | 403 | |||
Rejected ballots | 16 | ||||
Majority | 1094 | ||||
Turnout | 39.3 | -23.7 | |||
Conservative hold | Swing | ||||
Party | Candidate | Votes | % | ± | |
---|---|---|---|---|---|
Conservative | Roger Oakley | 802 | 34.3 | ||
Liberal Democrat | Jacqueline Cranefield | 783 | 33.5 | ||
Labour | Mike Barrett | 504 | 21.5 | ||
UKIP | Brian Head | 246 | |||
Rejected ballots | 19 | ||||
Majority | 19 | ||||
Turnout | -22.4 | ||||
Conservative hold | Swing | ||||
Party | Candidate | Votes | % | ± | |
---|---|---|---|---|---|
Liberal Democrat | Hazel Thorpe | 1107 | |||
Conservative | Nadeem Khan | 701 | |||
Labour | Peter Barnes | 368 | |||
UKIP | Shaune King | 282 | |||
Rejected ballots | 19 | ||||
Majority | 407 | ||||
Turnout | 38.5 | -27.5 | |||
Liberal Democrat hold | Swing | ||||
The 1998 Worthing Borough Council election took place on 7 May 1998 to elect members of Worthing Borough Council in West Sussex, England. One third of the council was up for election and the Liberal Democrat party kept overall control of the council.
The 1999 Worthing Borough Council election took place on 6 May 1999 to elect members of Worthing Borough Council in West Sussex, England. One third of the council was up for election and the Conservative party gained overall control of the council from the Liberal Democrats. Overall turnout was 34.8%.
The 2000 Worthing Borough Council election took place on 4 May 2000 to elect members of Worthing Borough Council in West Sussex, England. One third of the council was up for election and the Conservative party held overall control of the council.
The 2002 Worthing Borough Council election took place on 2 May 2002 to elect members of Worthing Borough Council in West Sussex, England. One third of the council was up for election and the Liberal Democrats gained overall control of the council from the Conservative party. Overall turnout was 30.67%.
The 2003 Worthing Borough Council election took place on 1 May 2003 to elect members of Worthing Borough Council in West Sussex, England. One third of the council was up for election and the Liberal Democrats lost overall control of the council to no overall control. Overall turnout was 28.61%.
The 2006 Worthing Borough Council election took place on 4 May 2006 to elect members of Worthing Borough Council in West Sussex, England. One third of the council was up for election and the Conservative party stayed in overall control of the council.
The 2007 Worthing Borough Council election took place on 3 May 2007 to elect members of Worthing Borough Council in West Sussex, England. One third of the council was up for election and the Conservative party stayed in overall control of the council.
The 2008 Worthing Borough Council election took place on 1 May 2008 to elect members of Worthing Borough Council in West Sussex, England. One third of the council was up for election and the Conservative party stayed in overall control of the council. Overall turnout was 35%.
The 2006 Rushmoor Council election took place on 4 May 2006 to elect members of Rushmoor Borough Council in Hampshire, England. One third of the council was up for election and the Conservative party stayed in overall control of the council.
The 2006 Cheltenham Council election took place on 4 May 2006 to elect members of Cheltenham Borough Council in Gloucestershire, England. Half of the council was up for election and the council stayed under no overall control.
The 2010 Pendle Borough Council election took place on 6 May 2010 to elect members of Pendle Borough Council in Lancashire, England. One third of the council was up for election and the council stayed under no overall control.
The 2010 Worthing Borough Council election took place on 6 May 2010 to elect members of Worthing Borough Council in West Sussex, England. One third of the council was up for election and the Conservative party stayed in overall control of the council.
The 2007 Basingstoke and Deane Council election took place on 3 May 2007 to elect members of Basingstoke and Deane Borough Council in Hampshire, England. One third of the council was up for election and the Conservative party stayed in overall control of the council.
The 2006 Enfield Council election took place on 4 May 2006 to elect members of Enfield London Borough Council in London, England. The whole council was up for election and the Conservative party stayed in overall control of the council.
The 2012 Worthing Borough Council election took place on 3 May 2012 to elect members of Worthing Borough Council in West Sussex, England. One third of the council was elected, including a double vacancy in Offington ward. The Conservative party remained in overall control of the council.
The 2003 Hertsmere Borough Council election took place on 1 May 2003 to elect members of Hertsmere Borough Council in Hertfordshire, England. One third of the council was up for election and the Conservative party stayed in overall control of the council.
The 2006 Hertsmere Borough Council election took place on 4 May 2006 to elect members of Hertsmere Borough Council in Hertfordshire, England. One third of the council was up for election and the Conservative party stayed in overall control of the council.
The 2007 Hertsmere Borough Council election took place on 3 May 2007 to elect members of Hertsmere Borough Council in Hertfordshire, England. One third of the council was up for election and the Conservative party stayed in overall control of the council.
The 2003 Eastbourne Borough Council election took place on 1 May 2003 to elect members of Eastbourne Borough Council in East Sussex, England. One third of the council was up for election and the Liberal Democrats stayed in overall control of the council.
The 2018 Worthing Borough Council election took place on 3 May 2018 to elect members of Worthing Borough Council. This was on the same day as other local elections. A third of the council was up for election, meaning a total of 13 councillors were elected from all of the council's wards.