Sunderland City Council election, 2011

Last updated

Map of the results of the 2011 Sunderland council election. Labour in red, Conservatives in blue and independent in grey. Sunderland UK local election 2011 map.svg
Map of the results of the 2011 Sunderland council election. Labour in red, Conservatives in blue and independent in grey.

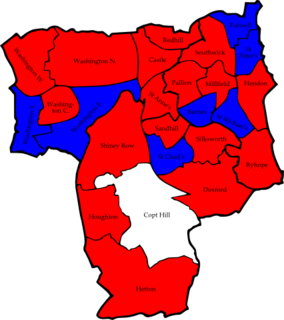
The 2011 Sunderland Council election took place on 5 May 2011 to elect members of Sunderland Metropolitan Borough Council in Tyne and Wear, England. One third of the council was up for election and the Labour party stayed in overall control of the council. [1]

City of Sunderland City and metropolitan borough in England

The City of Sunderland is a local government district of Tyne and Wear, in North East England, with the status of a city and metropolitan borough. It is named after its largest settlement, Sunderland, but covers a far larger area which includes the towns of Hetton-le-Hole, Houghton-le-Spring, and Washington, as well as a range of suburban villages.

Tyne and Wear County of England

Tyne and Wear ( ) is a metropolitan county in the North East region of England around the mouths of the rivers Tyne and Wear. It came into existence in 1974 after the passage of the Local Government Act 1972. It consists of the five metropolitan boroughs of South Tyneside, North Tyneside, City of Newcastle upon Tyne, Gateshead and City of Sunderland. It is bounded on the east by the North Sea, and has borders with Northumberland to the north and County Durham to the south.

England Country in north-west Europe, part of the United Kingdom

England is a country that is part of the United Kingdom. It shares land borders with Wales to the west and Scotland to the north-northwest. The Irish Sea lies west of England and the Celtic Sea lies to the southwest. England is separated from continental Europe by the North Sea to the east and the English Channel to the south. The country covers five-eighths of the island of Great Britain, which lies in the North Atlantic, and includes over 100 smaller islands, such as the Isles of Scilly and the Isle of Wight.

Contents

After the election, the composition of the council was

The Labour Party is a centre-left political party in the United Kingdom which has been described as an alliance of social democrats, democratic socialists and trade unionists. The party's platform emphasises greater state intervention, social justice and strengthening workers' rights. Labour is a full member of the Party of European Socialists and Progressive Alliance, and holds observer status in the Socialist International. As of 2017, the party was considered the "largest party in Western Europe" in terms of party membership, with more than half a million members.

Conservative Party (UK) Political party in the United Kingdom

The Conservative Party, officially the Conservative and Unionist Party, is a centre-right political party in the United Kingdom. Presently led by Theresa May, it has been the governing party since 2010. It presently has 314 Members of Parliament in the House of Commons, 249 members of the House of Lords, and 18 members of the European Parliament. It also has 31 Members of the Scottish Parliament, 12 members of the Welsh Assembly, eight members of the London Assembly and 9,008 local councillors. One of the major parties of UK politics, it has formed the government on 45 occasions, more than any other party.

Liberal Democrats (UK) Political party in the United Kingdom

The Liberal Democrats are a liberal, centrist political party in the United Kingdom. They presently have 11 Members of Parliament in the House of Commons, 96 members of the House of Lords, and one member of the European Parliament. They also have five Members of the Scottish Parliament and a member each in the Welsh Assembly and London Assembly. The party reached the height of its influence in the early 2010s, forming a junior partner in a coalition government from 2010 to 2015. It is presently led by Vince Cable.

Campaign

Before the election Labour ran the council with 52 seats, compared to 18 Conservatives, 1 Liberal Democrat and 4 independents, with 1 of the 4 independents being described as an "Independent Conservative". [3] 26 seats were being contested in the election with 2 seats being available in Sandhill ward, after councillor Jim Scott stood down from the council. [3]

A Councillor is a member of a local government council.

Labour were hopeful of making gains due to a backlash against the national Conservative led government and rising unemployment. [3] However the Conservatives hoped the national council tax freeze and pension increases would help the party do well and blamed the previous Labour government for the economic situation. [3] Meanwhile, the Liberal Democrats said they would focus on local issues and targeted Millfield ward. [3]

Unemployment when people are without work and actively seeking work

Unemployment or joblessness is the situation of actively looking for employment, but not being currently employed.

Other candidates included 7 from the Green Party and 3 from the United Kingdom Independence Party. [3] However the British National Party did not put up any candidates, after contesting every seat in some previous elections. [3]

Green Party of England and Wales Political party in England and Wales

The Green Party of England and Wales is a green, left-wing political party in England and Wales. Headquartered in London, since September 2018, its Co-Leaders are Siân Berry and Jonathan Bartley. The Green Party has one Member of Parliament in the House of Commons, one representative in the House of Lords, and three Members of the European Parliament. It has various councillors in UK local government and two members of the London Assembly.

The British National Party (BNP) is a far-right, fascist political party in the United Kingdom. It is headquartered in Wigton, Cumbria, and its current leader is Adam Walker. A minor party, it has no elected representatives at any level of UK government. Founded in 1982, the party reached its greatest level of success in the 2000s, when it had over fifty seats in local government, one seat on the London Assembly, and two Members of the European Parliament.

Election result

The results saw Labour increase their majority on the council after gaining 4 seats from the Conservatives to have 56 councillors. [4] [5] The gains came in the wards of St Chad's, St Peter's, Washington East and Washington South and left the Conservatives with 14 seats. [4] [5] The Liberal Democrats had a bad election, coming fourth in many seats, after a drop in their share of the vote. [5] Meanwhile, independent Colin Wakefield held his seat in Copt Hill by 428 votes over Labour. [5] Neither the Green Party or the United Kingdom Independence Party won any seats, but the Greens came third in 6 of the 7 seats they had contested and the United Kingdom Independence Party came second in Hetton. [6] Overall turnout in the election was 35.1%. [4]

Washington, Tyne and Wear town in the City of Sunderland, in Tyne and Wear, England

Washington is a new town in the City of Sunderland local government district of Tyne and Wear, England, and part of historic County Durham. Washington is located geographically at an equal distance from the centres of Newcastle, Durham and Sunderland, hence it has close ties to all three cities.

Hetton-le-Hole town in the City of Sunderland in Tyne and Wear, England

Hetton-le-Hole is a town and civil parish situated in the City of Sunderland, Tyne and Wear, England. Historically in County Durham, it is on the A182 between Houghton-le-Spring and Easington Lane, at the southwest corner of Sunderland, off the A690 and close to the A1(M). It has a population of 14,402 including the village of Easington Lane and Warden Law.

Voter turnout percentage of eligible voters who cast a ballot in an election

Voter turnout is the percentage of eligible voters who cast a ballot in an election. Eligibility varies by country, and the voting-eligible population should not be confused with the total adult population. Age and citizenship status are often among the criteria used to determine eligibility, but some countries further restrict eligibility based on sex, race, or religion.

Sunderland kept up its position as a quick counter of results, with the first result in Pallion being declared at 10.53pm, after the polls had closed at 10pm. [5] The council was also the first to finish counting with the final results being declared at 1am. [7] The Labour leader of the council Paul Watson held the seat in Pallion and put Labour's success down to the cuts being made by the national government [5] and as an endorsement of the city council. [6] The Conservative group leader Paul Morrissey meanwhile said his party had suffered due to being in government nationally. [6]

Sunderland Local Election Result 2011 [8]
PartySeatsGainsLossesNet gain/lossSeats %Votes %Votes+/−
  Labour 22 4 0 +4 84.6 60.3 49,898 +11.3%
  Conservative 3 0 4 -4 11.5 25.7 21,303 +0.5%
  Independent 1 0 0 0 3.8 4.6 3,782 +0.6%
  Liberal Democrat 0 0 0 0 0 5.1 4,185 -13.2%
  Green 0 0 0 0 0 2.4 1,979 +2.1%
  UKIP 0 0 0 0 0 2.0 1,654 +2.0%

Ward results

Barnes [8]
PartyCandidateVotes%±
Conservative Lee Martin 1,989 49.1 +13.1
Labour Rebecca Atkinson 1,896 46.8 +5.6
Liberal Democrat Anthony Usher 170 4.2 -13.9
Majority 93 2.3
Turnout 4,055 45.7 -16.9
Conservative hold Swing
Castle [8]
PartyCandidateVotes%±
Labour Stephen Foster 2,202 84.6 +33.3
Conservative Geoff Scott 294 11.3 +0.7
Liberal Democrat Paul Hillman 108 4.1 -7.8
Majority 1,908 73.3 +40.3
Turnout 2,604 30.4 -19.6
Labour hold Swing
Copt Hill [8]
PartyCandidateVotes%±
Independent Colin Wakefield 1,961 56.1 +14.3
Labour Juliana Heron 1,533 43.9 -1.1
Majority 428 12.2
Turnout 3,494 39.6 -15.6
Independent hold Swing
Doxford [8]
PartyCandidateVotes%±
Labour David Errington 1,906 59.7 +7.7
Conservative Hilary Johnson 946 29.6 -0.2
Green Caroline Robinson 296 9.3 +9.3
Liberal Democrat Matt MacDonald 46 1.4 -16.9
Majority 960 30.1 +7.9
Turnout 3,194 40.5 -20.2
Labour hold Swing
Fulwell [8]
PartyCandidateVotes%±
Conservative John Wiper 1,992 47.3 +2.1
Labour Paul Middleton 1,799 42.7 +7.0
Liberal Democrat Geoffrey Pryke 423 10.0 -9.2
Majority 193 4.6 -4.9
Turnout 4,214 46.5 -21.9
Conservative hold Swing
Hendon [8]
PartyCandidateVotes%±
Labour Thomas Martin 1,781 68.1 +15.4
Conservative Debbie Lorraine 535 20.4 -6.1
Green Sam May 301 11.5 +11.5
Majority 1,246 47.6 +21.4
Turnout 2,617 29.9 -14.8
Labour hold Swing
Hetton [8]
PartyCandidateVotes%±
Labour Florence Anderson 1,940 58.8 +2.7
UKIP John Defty 956 29.0 +29.0
Conservative Pat Francis 239 7.2 -5.9
Liberal Democrat Philip Dowell 167 5.1 -16.9
Majority 984 29.8 -4.3
Turnout 3,302 37.6 -12.8
Labour hold Swing
Houghton [8]
PartyCandidateVotes%±
Labour Kath Rolph 1,820 52.3 +5.2
Independent John Ellis 1,660 47.7 +11.8
Majority 160 4.6 -6.7
Turnout 3,480 38.6 -16.1
Labour hold Swing
Millfield [8]
PartyCandidateVotes%±
Labour Lynda Scanlan 1,363 53.8 +15.2
Liberal Democrat Paul Edgeworth 585 23.1 -12.0
Conservative Vijaya Das 289 11.4 -5.0
Independent Rod MacPherson 161 6.4 +2.6
Green Jack McGlen 134 5.3 +5.3
Majority 778 30.7 +27.2
Turnout 2,532 33.1 -14.9
Labour hold Swing
Pallion [8]
PartyCandidateVotes%±
Labour Paul Watson 1,688 63.8 +12.4
Conservative Peter O'Connor 506 19.1 -1.2
Green David Campbell 451 17.1 +17.1
Majority 1,182 44.7 +13.7
Turnout 2,645 35.1 -13.6
Labour hold Swing
Redhill [8]
PartyCandidateVotes%±
Labour Richard Bell 2,104 87.6 +18.1
Conservative Martin Anderson 299 12.4 -5.4
Majority 1,805 75.1 +23.4
Turnout 2,403 29.9 -15.3
Labour hold Swing
Ryhope [8]
PartyCandidateVotes%±
Labour Ellen Ball 2,022 64.2 +1.5
Conservative Shaun Cudworth 1,129 35.8 -1.5
Majority 893 28.3 +2.9
Turnout 3,151 39.0 -19.1
Labour hold Swing
St Annes [8]
PartyCandidateVotes%±
Labour Lisa Smiles 1,908 71.4 +12.6
Conservative Paula Wilkinson 436 16.3 -0.7
Green Emily Blyth 238 8.9 +5.0
Liberal Democrat Kathy Walker 90 3.4 -16.9
Majority 1,472 55.1 +16.6
Turnout 2,672 31.2 -15.1
Labour hold Swing
St Chads [8]
PartyCandidateVotes%±
Labour Stuart Porthouse 1,851 52.9 +12.6
Conservative Michael Dixon 1,647 47.1 -0.1
Majority 204 5.8
Turnout 3,498 44.6 -14.3
Labour gain from Conservative Swing
St Michaels [8]
PartyCandidateVotes%±
Conservative Peter Wood 1,962 50.8 +8.4
Labour David Owens 1,364 35.3 +3.0
Green John Appleton 285 7.4 +4.2
Liberal Democrat Andrew Wood 248 6.4 -12.0
Majority 598 15.5 +5.4
Turnout 3,859 42.8 -21.4
Conservative hold Swing
St Peters [8]
PartyCandidateVotes%±
Labour Barry Curran 1,755 49.6 +12.4
Conservative Graham Hall 1,521 43.0 +7.2
Liberal Democrat Diana Matthew 259 7.3 -12.8
Majority 234 6.6 +5.2
Turnout 3,535 41.7 -18.7
Labour gain from Conservative Swing
Sandhill (2) [8]
PartyCandidateVotes%±
Labour John Gallagher 1,783
Labour Debra Waller 1,637
Conservative Paul Tweddle 456
Conservative Juliette Muca 440
Liberal Democrat Susan Wilson 241
Turnout 4,557 33.7 -12.8
Labour hold Swing
Labour hold Swing
Shiney Row [8]
PartyCandidateVotes%±
Labour John Scott 2,423 64.9 +10.6
Conservative Malcolm Vardy 1,035 27.7 +1.8
Liberal Democrat Carol Attewell 278 7.4 -12.4
Majority 1,388 37.2 +8.8
Turnout 3,736 37.5 -18.6
Labour hold Swing
Silksworth [8]
PartyCandidateVotes%±
Labour Peter Gibson 2,227 66.7 +9.0
Conservative Dominic McDonough 709 21.2 -2.5
Green Joella Lynch 274 8.2 +8.2
Liberal Democrat Andy Bex 130 3.9 -14.7
Majority 1,518 45.4 +11.4
Turnout 3,340 39.6 -17.1
Labour hold Swing
Southwick [8]
PartyCandidateVotes%±
Labour Christine Shattock 1,930 69.7 +15.6
Conservative Terence Docherty 691 24.9 +3.3
Liberal Democrat Anne Griffin 149 5.4 -10.1
Majority 1,239 44.7 +12.3
Turnout 2,770 33.8 -14.9
Labour hold Swing
Washington Central [8]
PartyCandidateVotes%±
Labour Len Lauchlan 2,240 61.9 +8.8
Conservative Tracy Young 706 19.5 -4.3
UKIP Erland Polden 443 12.2 +12.2
Liberal Democrat John McLelland 230 6.4 -16.7
Majority 1,534 42.4 +13.1
Turnout 3,619 40.5 -19.7
Labour hold Swing
Washington East [8]
PartyCandidateVotes%±
Labour Fiona Miller 1,935 53.9 +8.9
Conservative Ian Cuthbert 1,201 33.4 +1.6
UKIP Linda Hudson 255 7.1 +7.1
Liberal Democrat Malcolm Bannister 201 5.6 -13.1
Majority 734 20.4 +7.2
Turnout 3,592 40.9 -19.8
Labour gain from Conservative Swing
Washington North [8]
PartyCandidateVotes%±
Labour Peter Walker 2,253 76.3 +19.1
Conservative Joyce Wake 469 15.9 +1.8
Liberal Democrat Kevin Morris 232 7.9 -11.8
Majority 1,784 60.4 +22.9
Turnout 2,954 34.0 -17.2
Labour hold Swing
Washington South [8]
PartyCandidateVotes%±
Labour George Thompson 2,126 60.5 +19.1
Conservative Martin Talbot 1,102 31.3 -0.5
Liberal Democrat David Griffin 288 8.2 -18.6
Majority 1,024 29.1 +19.5
Turnout 3,516 43.0 -17.7
Labour gain from Conservative Swing
Washington West [8]
PartyCandidateVotes%±
Labour Harry Trueman 2,412 69.7 +20.3
Conservative Olwyn Bird 710 20.5 +1.0
Liberal Democrat Irene Bannister 340 9.8 -15.2
Majority 1,702 49.2 +24.9
Turnout 3,462 38.3 -20.1
Labour hold Swing

Related Research Articles

Sunderland City Council Local government body in England

Sunderland City Council is the local authority of the City of Sunderland in Tyne and Wear, England. It is a metropolitan district council, one of five in Tyne and Wear and one of 36 in the metropolitan counties of England, and provides the majority of local government services in Sunderland.

2008 Winchester City Council election

The 2008 Winchester Council election took place on 1 May 2008 to elect members of Winchester District Council in Hampshire, England. One third of the council was up for election and the Conservative party stayed in overall control of the council.

The 2002 Sunderland Council election took place on 2 May 2002 to elect members of Sunderland Metropolitan Borough Council in Tyne and Wear, England. One third of the council was up for election and the Labour party stayed in overall control of the council.

The 2003 Sunderland Council election took place on 1 May 2003 to elect members of Sunderland Metropolitan Borough Council in Tyne and Wear, England. One third of the council was up for election and the Labour party stayed in overall control of the council.

2006 Sunderland City Council election

The 2006 Sunderland Council election took place on 4 May 2006 to elect members of Sunderland City Council in Tyne and Wear, England. One third of the Council was up for election and the Labour party stayed in overall control.

2007 Sunderland City Council election

The 2007 Sunderland Council election took place on 3 May 2007 to elect members of Sunderland Metropolitan Borough Council in Tyne and Wear, England. One third of the council was up for election and the Labour party stayed in overall control of the council.

2008 Sunderland City Council election

The 2008 Sunderland Council election took place on 1 May 2008 to elect members of Sunderland Metropolitan Borough Council in Tyne and Wear, England. One third of the council was up for election and the Labour party stayed in overall control of the council.

2010 Sunderland City Council election

The 2010 Sunderland Council election took place on 6 May 2010 to elect members of Sunderland Metropolitan Borough Council in Tyne and Wear, England. One third of the council was up for election and the Labour party stayed in overall control of the council. The election took place on the same day as the 2010 General Election.

2004 Pendle Borough Council election

The 2004 Pendle Borough Council election took place on 10 June 2004 to elect members of Pendle Borough Council in Lancashire, England. One third of the council was up for election and the Liberal Democrats gained overall control of the council from no overall control.

The 1999 Sandwell Metropolitan Borough Council election took place on 6 May 1999 to elect members of Sandwell Metropolitan Borough Council in the West Midlands, England. One third of the council was up for election and the Labour party stayed in overall control of the council.

2008 Basildon District Council election

The 2008 Basildon District Council election took place on 1 May 2008 to elect members of Basildon District Council in Essex, England. One third of the council was up for election and the Conservative party stayed in overall control of the council.

The 2002 Basingstoke and Deane Council election took place on 2 May 2002 to elect members of Basingstoke and Deane Borough Council in Hampshire, England. The whole council was up for election with boundary changes since the last election in 2000 increasing the number of seats by 3. The council stayed under no overall control.

2006 Basingstoke and Deane Borough Council election

The 2006 Basingstoke and Deane Council election took place on 4 May 2006 to elect members of Basingstoke and Deane Borough Council in Hampshire, England. One third of the council was up for election and the council stayed under no overall control.

2011 Basingstoke and Deane Borough Council election

The 2011 Basingstoke and Deane Council election took place on 5 May 2011 to elect members of Basingstoke and Deane Borough Council in Hampshire, England. One third of the council was up for election and the Conservative party stayed in overall control of the council.

2007 Redcar and Cleveland Borough Council election

The 2007 Redcar and Cleveland Borough Council election took place on 3 May 2007 to elect members of Redcar and Cleveland Unitary Council in England. The whole council was up for election and the council stayed under no overall control.

2011 Wealden District Council election

The 2011 Wealden District Council election took place on 5 May 2011 to elect members of Wealden District Council in East Sussex, England. The whole council was up for election and the Conservative party stayed in overall control of the council.

2012 Huntingdonshire District Council election

The 2012 Huntingdonshire District Council election took place on 3 May 2012 to elect members of Huntingdonshire District Council in Cambridgeshire, England. One third of the council was up for election and the Conservative party stayed in overall control of the council.

2012 St Helens Metropolitan Borough Council election

The 2012 St Helens Metropolitan Borough Council election took place on 3 May 2012 to elect members of St Helens Metropolitan Borough Council in Merseyside, England. One third of the council was up for election and the Labour party stayed in overall control of the council.

2015 Christchurch Borough Council election

The 2015 Christchurch Borough Council election took place on 7 May 2015 to elect members of Christchurch Borough Council in Dorset, England. The whole council was up for election and the Conservative party stayed in overall control of the council.

2018 Sunderland City Council election

The 2018 Sunderland City Council election took place on 3 May 2018 to elect members of Sunderland City Council in England. The election took place on the same day as other local elections.

References

  1. "England council elections". BBC News Online . Retrieved 27 July 2011.
  2. "Election results 2011: English council summary results". guardian.co.uk. 6 May 2011. Retrieved 30 July 2011.
  3. 1 2 3 4 5 6 7 Robertson, Russ (5 April 2011). "BNP will not contest Sunderland Council election". Sunderland Echo . Retrieved 30 July 2011.
  4. 1 2 3 "Sunderland Council elections - Results - Labour gains from Tories". Sunderland Echo . 5 May 2011. Retrieved 30 July 2011.
  5. 1 2 3 4 5 6 Unwin, Bruce (6 May 2011). "Labour hold Sunderland and South Tyneside". The Northern Echo . Retrieved 30 July 2011.
  6. 1 2 3 "Labour celebrates a night of success". Sunderland Echo . 6 May 2011. Retrieved 30 July 2011.
  7. "Labour takes back Newcastle from Lib Dems". BBC News Online. 6 May 2011. Retrieved 30 July 2011.
  8. 1 2 3 4 5 6 7 8 9 10 11 12 13 14 15 16 17 18 19 20 21 22 23 24 25 26 "Results of Poll". Sunderland City Council. Retrieved 27 July 2011.
Preceded by
Sunderland Council election, 2010
Sunderland local elections Succeeded by
Sunderland Council election, 2012