Thurrock Council election, 2011

Last updated

Thurrock Council election, 2014 [1]
  2010 3 May 2012 2012  

16 of the 49 seats to Thurrock Council
25 seats needed for a majority

  First party Second party Third party
 
Party Labour Conservative Independent
Seats won 9 6 1
Seats after 24 22 3
Seat changeIncrease2.svg1Decrease2.svg1Steady2.svg

Council control before election

No overall control

Council control after election

No overall control

On 5 May 2011, one-third of seats on Thurrock Council were contested. The result of the election was that Thurrock Council stayed under no overall control. [2] The Labour gained one seat from the Conservative party. [3]

Thurrock Council

Thurrock Council is the local council for the borough of Thurrock in Essex, England. Since 1997, Thurrock has been a unitary authority, combining the functions of a non-metropolitan county with that of a non-metropolitan district. The other such authority in Essex is Southend-on-Sea. It is a member of the East of England Local Government Association.

In the context of local authorities in the United Kingdom, the term no overall control refers to a situation in which no single political group achieves a majority of seats; and is analogous to a hung parliament. Of the 310 councils who had members up for election in the 2007 local elections, 85 resulted in a NOC administration.

The Labour Party is a centre-left political party in the United Kingdom which has been described as an alliance of social democrats, democratic socialists and trade unionists. The party's platform emphasises greater state intervention, social justice and strengthening workers' rights.

Contents

Results

Of the 16 wards that were contested, nine were won by Labour, six by the Conservatives and one by an independent. [4]

Thurrock Local Election Result 2011 [5]
PartySeatsGainsLossesNet gain/lossSeats %Votes %Votes+/−
  Labour 9 1 0 +1 56.25 41.0 13,428 +6.9%
  Conservative 6 0 1 -1 37.5 32.7 10,719 -10.6%
  Independent 1 0 0 0 6.25 5.4 1,771 +5.4%
  UKIP 0 0 0 0 0 12.7 4,169 +12.7%
  BNP 0 0 0 0 0 4.2 1,368 -20.4%
  Liberal Democrat 0 0 0 0 0 3.7 1,203 +3.7%
  Green 0 0 0 0 0 0.2 62 +0.2%

Council Composition

After the election the composition of the council was:

24223
LabourConservativeOther

Following the election the vote for mayor was tied between Cllr Curtis and deputy mayor Cllr Tunde Ojetola. Outgoing Mayor Anne Cheale exercised her casting vote in favour of Councollor Curtis. [6] [7] In the election for council leader, Councillor Curtis then used his casting vote to elect John Kent as council leader, thus maintaining the Labour administration. [7]

Anne Cheale was a councillor in Thurrock, England and former leader of the Conservative group on Thurrock Council who was first elected to the council in 2000 to represent the Corringham and Fobbing Ward.

Results by ward

Each of the 16 wards elected one councillor for this election. Incumbent councillors are marked by an asterisk.

Aveley & Uplands

Aveley & Uplands
PartyCandidateVotes%±
Conservative Maureen Carol Pearce 626 27.9 -9.1
Independent Colin James Churchman 551 24.5N/A
UKIP Tim Mark Aker 528 23.5N/A
Labour Clifford Holloway 497 22.1 -1.9
Liberal Democrat John Livermore 45 2.0 -6.0
Majority 75 3.4
Turnout 2,247 35.2 +7.2
Conservative hold Swing

Belhus

Belhus
PartyCandidateVotes%±
Labour Charles John Curtis* 1,034 51.7 +15.7
Conservative Rita Ajidagba 393 19.6 -14.9
UKIP Stanley Christopher Baker 301 15.0N/A
BNP Susan Sibthorpe 219 11.0 -11.7
Liberal Democrat Tracy Denise Rowe 55 2.7 -4.1
Majority 641 32.1
Turnout 2,002 30.6 +3.5
Labour hold Swing

Chadwell St. Mary

Chadwell St. Mary
PartyCandidateVotes%±
Labour Anthony William Fish 1,174 53.3 +10.0
Conservative Lee Dove 523 23.7 +6.1
UKIP James Nicholas Baker 262 11.9N/A
BNP Derek William Beackon 165 7.5 -25.3
Liberal Democrat Natalie Butcher 80 3.6 -2.7
Majority 651 29.6
Turnout 2,204 31.0 0
Labour hold Swing

Chafford & North Stifford

Chafford & North Stifford
PartyCandidateVotes%±
Conservative Simon Ernest Wootton 857 55.2 +18.7
Labour Augustine Nwanze 449 28.9 +13.8
Liberal Democrat James Donald 127 8.2 -20.7
UKIP Adrian Philip Short 120 7.7 +3.0
Majority 408 26.3
Turnout 1,553 29.2 +0.5
Conservative hold Swing

Corringham & Fobbing

Corringham & Fobbing
PartyCandidateVotes%±
Conservative Mark Steven Coxshall 909 46.6 +5.1
Labour Robert Adam Fitch 666 34.1 +2.1
UKIP Thomas Patrick Kelleher 290 14.8N/A
Liberal Democrat Kirsty Louise Beard 88 4.5N/A
Majority 243 12.5
Turnout 1,953 44.0 +4.3
Conservative hold Swing

East Tilbury

East Tilbury
PartyCandidateVotes%±
Independent John Ronald Purkiss* 912 57.7 -8.6
Labour Eleanor Lowe 303 19.2 +9.7
Conservative Paul Polley 211 13.3N/A
UKIP Peter Michael Fox 100 6.3N/A
Liberal Democrat Luke Anthony Tyson 56 3.5N/A
Majority 609 38.5
Turnout 1,582 33.6 +2.8
Independent hold Swing

Grays Riverside

Grays Riverside
PartyCandidateVotes%±
Labour Valerie Morris-Cook* 1,036 52.8 +9.1
Conservative Dawn Evans 515 26.2 +5.5
BNP Stephen Mark McNab 167 8.5 -17.2
UKIP Jagdev Singh Bal 124 6.3N/A
Liberal Democrat Kevin Mulroue 121 6.2 -3.7
Majority 521 26.6
Turnout 1,963 27.2 +4.0
Labour hold Swing

Grays Thurrock

Grays Thurrock
PartyCandidateVotes%±
Labour Catherine Angela Kent* 1,193 52.8 +4.3
Conservative Tracy Geraldine Barnes 584 25.8 -1.9
BNP Thomas Richard Davis 200 8.9 -15.9
UKIP Rajnikant Mistry 186 8.2N/A
Liberal Democrat William Andrew Jackson 97 4.3N/A
Majority 609 27.0
Turnout 2,260 36.1 +2.5
Labour hold Swing

Little Thurrock Rectory

Little Thurrock Rectory
PartyCandidateVotes%±
Conservative Thomas Anthony Kelly 852 46.9 +8.6
Labour Eileen O'Reilly 693 38.2 +9.1
UKIP Alan David Broad 214 11.8N/A
Liberal Democrat Matthew James Orbell 56 3.1 -8.0
Majority 159 8.7
Turnout 1,815 40.4 +7.7
Conservative hold Swing

Ockendon

Ockendon
PartyCandidateVotes%±
Labour Aaron Kiely 1,096 41.6 +7.5
Conservative Barry William Johnson* 1,009 38.3 3.5
BNP Karne Thomas McGinn 231 8.8 -11.9
UKIP Jill Heather Broad 223 8.5 -1.9
Liberal Democrat David Paul Shirley 73 2.8N/A
Majority 87 3.3
Turnout 2,632 38.9 +7.8
Labour gain from Conservative Swing

Stanford East & Corringham Town

Stanford East & Corringham Town
PartyCandidateVotes%±
Labour Philip George Smith 1,104 42.0 +4.3
Conservative Natalie Jay Gannon Quirk 968 36.8 +1.6
UKIP Roy Robert Jones 487 18.5N/A
Liberal Democrat Adrian Leslie Stevart 70 2.7N/A
Majority 136 5.2
Turnout 2,629 40.9 +4.1
Labour hold Swing

Stanford-Le-Hope West

Stanford-Le-Hope West
PartyCandidateVotes%±
Conservative Shane Steven Hebb 720 39.6 -0.1
Labour Gemma Robbins 653 35.9 +8.2
UKIP Stuart St.Clair-Haslam 374 20.5 +5.9
Liberal Democrat Christopher Greenaway 73 4.0N/A
Majority 67 3.7
Turnout 1,820 39.1 +7.9
Conservative hold Swing

Stifford Clays

Stifford Clays
PartyCandidateVotes%±
Labour Diana Elizabeth Hale* 877 45.1 +3.4
Conservative Johanna Catherine Morris 523 26.9 -7.7
UKIP Clive Herbert Broad 475 24.5N/A
Liberal Democrat Claire Jones 68 3.5N/A
Majority 354 18.2
Turnout 1,943 40.4 +2.1
Labour hold Swing

The Homesteads

The Homesteads
PartyCandidateVotes%±
Conservative Pauline Maria Tolson* 1,298 43.2 -7.7
Labour Richard Speight 1,055 35.1 +3.4
UKIP Peter Geoffrey Henry Prendergast 485 16.1N/A
Liberal Democrat Alan Maylin 107 3.5N/A
Green Simon John Barnes 62 2.1N/A
Majority 243 8.1
Turnout 3,007 45.5 +6.5
Conservative hold Swing

Tilbury Riverside & Thurrock Park

Tilbury Riverside & Thurrock Park
PartyCandidateVotes%±
Labour Clare Esther Baldwin 647 49.7 +15.8
Independent Keith John Hatcher 308 23.7N/A
BNP Michael Edward Braun 193 14.8 -15.4
Conservative Georgette Polley 153 11.8 -0.3
Majority 339 26.0
Turnout 1,301 30.3 +5.3
Labour hold Swing

West Thurrock & South Stifford

West Thurrock & South Stifford
PartyCandidateVotes%±
Labour Victoria Holloway 951 52.6 +10.7
Conservative Benjamin Robert Gadsby 578 31.9 +3.4
BNP Warren Michael Parish 193 10.7 -18.9
Liberal Democrat Daniel Allen 87 4.8N/A
Majority 373 20.7
Turnout 1,809 28.5 +5.3
Labour hold Swing

See also

Related Research Articles

Croydon London Borough Council elections

Elections for the Council in the London Borough of Croydon are held every four years to elect 70 councillors. At the last elections, which were held in May 2014, 30 Conservative councillors and 40 Labour councillors, providing a Labour majority of ten seats.

Liverpool City Council has existed since 1880, when Liverpool was awarded city status. Prior to this date the local authority was a town council.

2006 Barnet London Borough Council election

The 2006 Barnet Council election took place on 4 May 2006 to elect members of Barnet London Borough Council in London, England. The whole council was up for election and the Conservative party stayed in overall control of the council.

High Peak Borough Council

High Peak Borough Council is the local authority for High Peak, a borough of Derbyshire, England. It forms part of the two-tier system of local government for High Peak, alongside Derbyshire County Council. The administrative base of High Peak Borough Council is split between sites in the towns of Buxton and Glossop. Full council meetings are usually held in Buxton. The whole council is elected once every four years. As of May 2015 the council is controlled by the Conservatives.

The For Darwen Party was a local political party in Darwen, south of Blackburn, England, with a platform that Darweners were not properly represented on Blackburn with Darwen Borough Council.

The 2008 Thurrock Council election took place on 1 May 2008 to elect members of Thurrock Council in Essex, England. One third of the council was up for election and the council stayed under no overall control.

The 2007 Thurrock Council election took place on 3 May 2007 to elect members of Thurrock Council in Essex, England. One third of the council was up for election and the Conservative party lost overall control of the council to no overall control.

2007 St Albans City and District Council election

The 2007 St Albans City and District Council election took place on 3 May 2007 to elect members of St Albans District Council in Hertfordshire, England. One third of the council was up for election and the Liberal Democrats lost overall control of the council to no overall control.

The result of the Thurrock Council election, 2010 was that Thurrock Council stay under no overall control. The Conservative party gained two seats from Labour while Labour gained one seat from the Conservatives. Of the 16 wards contested, eight were won by the Conservatives and eight by Labour. The composition of the resulting council was:

2008 Pendle Borough Council election

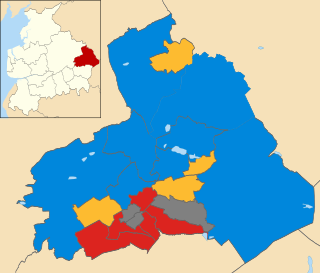
The 2008 Pendle Borough Council election took place on 1 May 2008 to elect members of Pendle Borough Council in Lancashire, England. One third of the council was up for election and the Liberal Democrats lost overall control of the council to no overall control.

2011 Great Yarmouth Borough Council election

The 2011 Great Yarmouth Borough Council election took place on 5 May 2011 to elect members of Great Yarmouth Borough Council in Norfolk, England. One third of the council was up for election and the Conservative party stayed in overall control of the council. At the same time as the election, the introduction of a directly elected mayor in Great Yarmouth was rejected in a referendum.

2008 Basildon District Council election

The 2008 Basildon District Council election took place on 1 May 2008 to elect members of Basildon District Council in Essex, England. One third of the council was up for election and the Conservative party stayed in overall control of the council.

2006 Basingstoke and Deane Borough Council election

The 2006 Basingstoke and Deane Council election took place on 4 May 2006 to elect members of Basingstoke and Deane Borough Council in Hampshire, England. One third of the council was up for election and the council stayed under no overall control.

2007 Hertsmere Borough Council election

The 2007 Hertsmere Borough Council election took place on 3 May 2007 to elect members of Hertsmere Borough Council in Hertfordshire, England. One third of the council was up for election and the Conservative party stayed in overall control of the council.

2007 Carlisle City Council election

The 2007 Carlisle City Council election took place on 3 May 2007 to elect members of Carlisle District Council in Cumbria, England. One third of the council was up for election and the council stayed under no overall control.

2011 Pendle Borough Council election

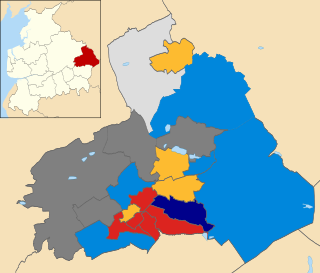
The 2011 Pendle Borough Council election took place on 5 May 2011 to elect members of Pendle Borough Council in Lancashire, England. One third of the council was up for election and the council stayed under no overall control.

2015 Norwich City Council election

The 2015 Norwich City Council election took place on 7 May 2015 to elect approximately one third of the members of Norwich City Council in England. This was on the same day as other local elections and the UK general election. Thirteen seats were due to be contested, with a further two seats up for election where casual vacancies had arisen. Labour won ten of the available seats, the Green Party won four, and the Liberal Democrats one. The Conservatives gained their highest ever vote in many city wards including Town Close and Thorpe Hamlet, and across Norwich came within almost 2000 votes of the Green Party, however failed to gain any seats. Just one seat changed hands - Wensum - which Labour gained from the Greens. Labour retained overall control of the council with 22 seats out of 39, the Greens continue to form the main opposition with 14 seats, and the Liberal Democrats have 3.

2015 Wychavon District Council election

The 2015 Wychavon District Council election took place on 7 May 2015 to elect members of Wychavon District Council in Worcestershire, England. The whole council was up for election and the Conservative party stayed in overall control of the council.

2018 Lambeth London Borough Council election

The 2018 Lambeth Council election took place on 3 May 2018 to elect members of Lambeth Council in England. The election saw Labour remain in control of Lambeth Council with a slightly reduced majority, winning over 90% of the seats. The Green Party of England and Wales achieved its best-ever result in the borough, winning 5 seats and becoming the official opposition.

References