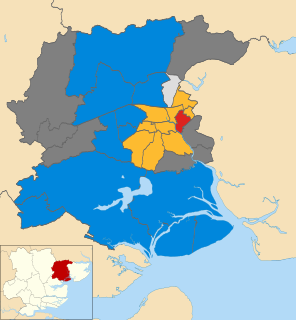
The 2000 Colchester Borough Council election took place on 4 May 2000 to elect members of Colchester Borough Council in Essex, England. One third of the council was up for election and the council stayed under no overall control. [1]
Borough status in the United Kingdom is granted by royal charter to local government districts in England, Wales and Northern Ireland. The status is purely honorary, and does not give any additional powers to the council or inhabitants of the district. In Scotland, similarly chartered communities were known as royal burghs, although the status is no longer granted.
Essex is a county in the south-east of England, north-east of London. One of the home counties, it borders Suffolk and Cambridgeshire to the north, Hertfordshire to the west, Kent across the estuary of the River Thames to the south, and London to the south-west. The county town is Chelmsford, the only city in the county. For government statistical purposes Essex is placed in the East of England region.
England is a country that is part of the United Kingdom. It shares land borders with Wales to the west and Scotland to the north-northwest. The Irish Sea lies west of England and the Celtic Sea lies to the southwest. England is separated from continental Europe by the North Sea to the east and the English Channel to the south. The country covers five-eighths of the island of Great Britain, which lies in the North Atlantic, and includes over 100 smaller islands, such as the Isles of Scilly and the Isle of Wight.
After the election, the composition of the council was
The Liberal Democrats are a liberal political party in the United Kingdom. They presently have 11 Members of Parliament in the House of Commons, 96 members of the House of Lords, and one member of the European Parliament. They also have five Members of the Scottish Parliament and a member each in the Welsh Assembly and London Assembly. The party reached the height of its influence in the early 2010s, forming a junior partner in a coalition government from 2010 to 2015. It is presently led by Vince Cable.
The Conservative Party, officially the Conservative and Unionist Party, is a centre-right political party in the United Kingdom. Presently led by Theresa May, it has been the governing party since 2010. It presently has 314 Members of Parliament in the House of Commons, 249 members of the House of Lords, and 18 members of the European Parliament. It also has 31 Members of the Scottish Parliament, 12 members of the Welsh Assembly, eight members of the London Assembly and 9,008 local councillors. One of the major parties of UK politics, it has formed the government on 45 occasions, more than any other party.
The Labour Party is a centre-left political party in the United Kingdom which has been described as an alliance of social democrats, democratic socialists and trade unionists. The party's platform emphasises greater state intervention, social justice and strengthening workers' rights.
Before the election the Liberal Democrats had the most seats on the council with 25, compared to 18 for the Conservative Party, 15 for the Labour Party, 1 for the Tiptree Residents' Association and 1 other independent. [2] Among the 20 councillors who were defending seats at the election were the Liberal Democrat leader of the council for the last two years, [3] Colin Sykes in Stanway, and the Liberal Democrat mayor Martin Hunt in Prettygate. [2]
A Councillor is a member of a local government council.
Stanway is a village and civil parish in Essex, England located near Colchester and within Colchester Borough. It is now widely referred to as a suburb. 'Stanway' is an Anglo-Saxon name for the 'stone way' of the Roman road, now the A12.
In England, the offices of mayor and lord mayor have long been ceremonial posts, with few or no duties attached to them. In recent years they have doubled as more influential political roles while retaining the ceremonial functions. A mayor's term of office denotes the municipal year. The most famous example is that of the Lord Mayor of the City of London.
Four Liberal Democrat and three Labour councillors stood down at the election including the Liberal Democrat former leader of the council, Steve Cawley in Shrub End. [2]
The Conservatives gained four seats, while the Liberal Democrats suffered a net loss of two seats. [3] The Liberal Democrats just remained the largest party, but among those to lose their seats to the Conservatives were the council leader Colin Sykes in Stanway by 54 votes and the mayor Martin Hunt in Prettygate by 213 votes. [3] Labour remained third after losing two seats, but also gaining one, while Tony Webb was the only independent to remain on the council after holding his seat in Tiptree. [3]
Tiptree is a village and civil parish in the English county of Essex, situated 10 miles (16 km) south-west of Colchester and around 50 miles (80 km) north-east of London. Surrounding villages include Messing, Tolleshunt Knights, Tolleshunt Major, Layer Marney, Inworth, Birch, Great Braxted, Great Totham and Little Totham.
Following the election Bill Frame was chosen as leader of the Liberal Democrat group defeating Terry Sutton and he then became the new leader of the council. [4]
Party | Seats | Gains | Losses | Net gain/loss | Seats % | Votes % | Votes | +/− | |
---|---|---|---|---|---|---|---|---|---|
Conservative | 9 | 4 | 0 | +4 | 45.0 | 38.8 | 11,951 | ||
Liberal Democrat | 6 | 1 | 3 | -2 | 30.0 | 33.1 | 10,192 | ||
Labour | 4 | 1 | 2 | -1 | 20.0 | 24.1 | 7,429 | ||
Tiptree Residents | 1 | 0 | 0 | 0 | 5.0 | 2.4 | 727 | ||
Independent | 0 | 0 | 1 | -1 | 0 | 1.6 | 478 | ||
Natural Law | 0 | 0 | 0 | 0 | 0 | 0.1 | 39 |
Party | Candidate | Votes | % | ± | |
---|---|---|---|---|---|
Liberal Democrat | Dave Smith | 874 | 44.3 | ||
Labour | Dave Harris | 788 | 40.0 | ||
Conservative | Pat Armstrong | 310 | 15.7 | ||
Majority | 86 | 4.4 | |||
Turnout | 1,972 | 34 | |||
Liberal Democrat hold | Swing |
Party | Candidate | Votes | % | ± | |
---|---|---|---|---|---|
Liberal Democrat | Henry Spyvee | 788 | 42.9 | ||
Conservative | Neil Stock | 525 | 28.6 | ||
Labour | Kim Naish | 486 | 26.4 | ||
Natural Law | Loretta Basker | 39 | 2.1 | ||
Majority | 263 | 14.3 | |||
Turnout | 1,838 | 31 | |||
Liberal Democrat hold | Swing |
Party | Candidate | Votes | % | ± | |
---|---|---|---|---|---|
Conservative | Wendy Scattergood | 582 | 73.9 | ||
Liberal Democrat | Caroline West | 168 | 21.3 | ||
Labour | Jean Quinn | 38 | 4.8 | ||
Majority | 414 | 52.5 | |||
Turnout | 788 | ||||
Conservative hold | Swing |
Party | Candidate | Votes | % | ± | |
---|---|---|---|---|---|
Conservative | Patricia Sanderson | 321 | 43.4 | ||
Labour | Tina Cooke | 248 | 33.5 | ||
Liberal Democrat | Elizabeth Flanagan | 171 | 23.1 | ||
Majority | 73 | 9.9 | |||
Turnout | 740 | 42 | |||
Conservative gain from Labour | Swing | ||||
Party | Candidate | Votes | % | ± | |
---|---|---|---|---|---|
Conservative | David Cannon | 418 | 76.0 | ||
Labour | Richard Bartholomew | 68 | 12.4 | ||
Liberal Democrat | Craig Sutton | 64 | 11.6 | ||
Majority | 350 | 63.6 | |||
Turnout | 550 | ||||
Conservative hold | Swing |
Party | Candidate | Votes | % | ± | |
---|---|---|---|---|---|
Liberal Democrat | Terry Brady | 696 | 40.1 | ||
Labour | Paul Bishop | 553 | 31.9 | ||
Conservative | Mike Segal | 306 | 17.6 | ||
Old Heath Residents' Association | 181 | 10.4 | |||
Majority | 143 | 8.2 | |||
Turnout | 1,736 | 28 | |||
Liberal Democrat hold | Swing |
Party | Candidate | Votes | % | ± | |
---|---|---|---|---|---|
Conservative | Sonia Lewis | 1,252 | 64.6 | ||
Liberal Democrat | John Martin | 573 | 29.6 | ||
Labour | Edna Salmon | 113 | 5.8 | ||
Majority | 679 | 35.0 | |||
Turnout | 1,938 | ||||
Conservative hold | Swing |
Party | Candidate | Votes | % | ± | |
---|---|---|---|---|---|
Conservative | Richard Gower | 447 | 65.4 | ||
Liberal Democrat | Christopher Treloar | 134 | 19.6 | ||
Labour | John Coombes | 103 | 15.1 | ||
Majority | 313 | 45.8 | |||
Turnout | 684 | 33 | |||
Conservative hold | Swing |
Party | Candidate | Votes | % | ± | |
---|---|---|---|---|---|
Liberal Democrat | Gerard Oxford | 1,094 | 41.1 | ||
Conservative | David Adams | 934 | 35.1 | ||
Labour | Lucy Wood | 634 | 23.8 | ||
Majority | 160 | 6.0 | |||
Turnout | 2,662 | ||||
Liberal Democrat gain from Labour | Swing | ||||
Party | Candidate | Votes | % | ± | |
---|---|---|---|---|---|
Liberal Democrat | Sandra Gray | 681 | 57.2 | ||
Labour | Dave Speed | 309 | 25.9 | ||
Conservative | Mike Coyne | 201 | 16.9 | ||
Majority | 372 | 31.2 | |||
Turnout | 1,191 | 23 | |||
Liberal Democrat hold | Swing |
Party | Candidate | Votes | % | ± | |
---|---|---|---|---|---|
Conservative | Ian McCord | 1,034 | 48.7 | ||
Liberal Democrat | Martin Hunt | 821 | 38.7 | ||
Labour | Andy Frost | 267 | 12.6 | ||
Majority | 213 | 10.0 | |||
Turnout | 2,122 | 36 | |||
Conservative gain from Liberal Democrat | Swing | ||||
Party | Candidate | Votes | % | ± | |
---|---|---|---|---|---|
Labour | Don Quinn | 559 | 57.2 | ||
Liberal Democrat | Anthony Gant | 216 | 22.1 | ||
Conservative | Richard Lambeth | 203 | 20.8 | ||
Majority | 343 | 35.1 | |||
Turnout | 978 | 17 | |||
Labour hold | Swing |
Party | Candidate | Votes | % | ± | |
---|---|---|---|---|---|
Labour | Tina Dopson | 738 | 43.4 | ||
Liberal Democrat | John Fellows | 731 | 42.9 | ||
Conservative | Debbie White | 233 | 13.7 | ||
Majority | 7 | 0.4 | |||
Turnout | 1,702 | 34 | |||
Labour hold | Swing |
Party | Candidate | Votes | % | ± | |
---|---|---|---|---|---|
Liberal Democrat | Roy Gamble | 958 | 49.4 | ||
Conservative | Derek Smith | 674 | 34.8 | ||
Labour | Peter Brine | 206 | 15.8 | ||
Majority | 284 | 14.7 | |||
Turnout | 1,938 | 33 | |||
Liberal Democrat hold | Swing |
Party | Candidate | Votes | % | ± | |
---|---|---|---|---|---|
Conservative | Roger Buston | 840 | 48.4 | ||
Liberal Democrat | Una Jones | 631 | 36.3 | ||
Labour | Edmund Chinnery | 265 | 15.3 | ||
Majority | 209 | 12.0 | |||
Turnout | 1,736 | 33 | |||
Conservative gain from Independent | Swing | ||||
Party | Candidate | Votes | % | ± | |
---|---|---|---|---|---|
Labour | Richard Bourne | 435 | 38.5 | ||
Liberal Democrat | Barbara Williamson | 424 | 37.5 | ||
Conservative | Ron Levy | 272 | 24.0 | ||
Majority | 11 | 1.0 | |||
Turnout | 1,131 | 19 | |||
Labour gain from Liberal Democrat | Swing | ||||
Party | Candidate | Votes | % | ± | |
---|---|---|---|---|---|
Conservative | Jonathan Pyman | 866 | 44.7 | ||
Liberal Democrat | Colin Sykes | 812 | 41.9 | ||
Labour | Ian Yates | 259 | 13.4 | ||
Majority | 54 | 2.8 | |||
Turnout | 1,937 | 32 | |||
Conservative gain from Liberal Democrat | Swing | ||||
Party | Candidate | Votes | % | ± | |
---|---|---|---|---|---|
Tiptree Residents | Tony Webb | 727 | 41.2 | ||
Conservative | Richard Martin | 418 | 23.7 | ||
Labour | Tania Rogers | 324 | 18.3 | ||
Tiptree Independent Resident | Helen Bunney | 297 | 16.8 | ||
Majority | 309 | 17.5 | |||
Turnout | 1,766 | 28 | |||
Independent hold | Swing |
Party | Candidate | Votes | % | ± | |
---|---|---|---|---|---|
Conservative | John Jowers | 1,342 | 76.5 | ||
Labour | Bry Mogridge | 258 | 14.7 | ||
Liberal Democrat | Sally Scott | 154 | 8.8 | ||
Majority | 1,084 | 61.8 | |||
Turnout | 1,754 | ||||
Conservative hold | Swing |
Party | Candidate | Votes | % | ± | |
---|---|---|---|---|---|
Labour | Bob Newman | 778 | 44.4 | ||
Conservative | Judith Kennerdale | 773 | 44.1 | ||
Liberal Democrat | Stephen Lancaster | 202 | 11.5 | ||
Majority | 5 | 0.3 | |||
Turnout | 1,753 | 25 | |||
Labour hold | Swing |
Party | Candidate | Votes | % | ± | |
---|---|---|---|---|---|
Conservative | 939 | 55.9 | -8.7 | ||
Liberal Democrat | 639 | 38.0 | +8.4 | ||
Labour | 103 | 6.1 | +0.3 | ||
Majority | 300 | 17.9 | |||
Turnout | 1,681 | 39.2 | |||
Conservative hold | Swing |
Party | Candidate | Votes | % | ± | |
---|---|---|---|---|---|
Liberal Democrat | 1,674 | 41.4 | +2.7 | ||
Conservative | 1,498 | 37.1 | -11.7 | ||
Labour | 869 | 21.5 | +8.9 | ||
Majority | 176 | 4.3 | |||
Turnout | 4,041 | ||||
Liberal Democrat gain from Conservative | Swing | ||||
A by-election took place in Mile End on the 22 November 2001 after the resignation of Liberal Democrat councillor David Goatley due to pressure of work. [7]
Party | Candidate | Votes | % | ± | |
---|---|---|---|---|---|
Liberal Democrat | 529 | 33.6 | -7.7 | ||
Conservative | 468 | 29.7 | -5.5 | ||
Labour | 443 | 28.1 | +4.6 | ||
Independent | 135 | 8.6 | +8.6 | ||
Majority | 61 | 3.9 | |||
Turnout | 1,575 | 14.0 | |||
Liberal Democrat hold | Swing |
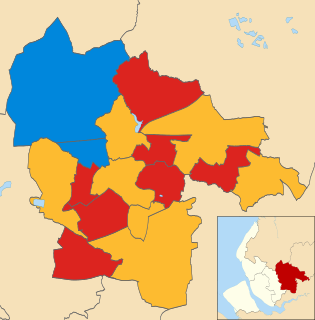
The 1999 St Helens Metropolitan Borough Council election took place on 6 May 1999 to elect members of St Helens Metropolitan Borough Council in Merseyside, England. One third of the council was up for election and the Labour party stayed in overall control of the council.
Colchester Politics: Colchester is a historic town located in Essex, England. It served as the first capital of Roman Britain and makes a claim to be the oldest town in Britain.
The 2000 St Helens Metropolitan Borough Council election took place on 4 May 2000 to elect members of St Helens Metropolitan Borough Council in Merseyside, England. One third of the council was up for election and the Labour party stayed in overall control of the council.
The 2006 St Helens Metropolitan Borough Council election took place on 4 May 2006 to elect members of St Helens Metropolitan Borough Council in Merseyside, England. One third of the council was up for election and the council stayed under no overall control.
The 1998 Brent London Borough Council election took place on 7 May 1998 to elect members of Brent London Borough Council in London, England. The whole council was up for election and the Labour party gained overall control of the council from no overall control.
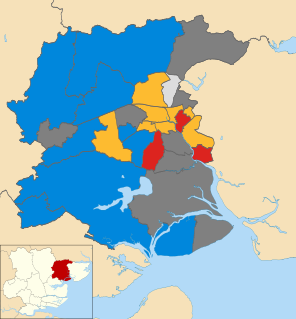
The 2006 Colchester Borough Council election took place on 4 May 2006 to elect members of Colchester Borough Council in Essex, England. One third of the council was up for election and the council stayed under no overall control.
The 2003 Harlow District Council election took place on 1 May 2003 to elect members of Harlow District Council in Essex, England. One third of the council was up for election and the council stayed under no overall control.
The 2007 St Helens Metropolitan Borough Council election took place on 3 May 2007 to elect members of St Helens Metropolitan Borough Council in Merseyside, England. One third of the council was up for election and the council stayed under no overall control.
The 2002 Colchester Borough Council election took place on 2 May 2002 to elect members of Colchester Borough Council in Essex, England. This was the same day as the other 2002 local elections in the United Kingdom. Due to boundary changes, every seat was up for election and the council stayed under no overall control.
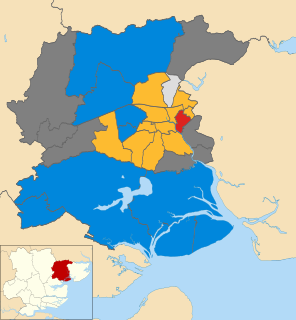
The 2003 Colchester Borough Council election took place on 1 May 2003 to elect members of Colchester Borough Council in Essex, England. This was the same day as the other 2003 United Kingdom local elections. One third of the seats were up for election and the council stayed under no overall control.
The 2004 Colchester Borough Council election took place on 10 June 2004 to elect members of Colchester Borough Council in Essex, England. This was the same day as the other 2004 United Kingdom local elections and as the 2004 European Parliament Elections. One third of the seats were up for election and the council stayed under no overall control.
The 2007 Colchester Borough Council election took place on 3 May 2007 to elect members of Colchester Borough Council in Essex, England. One third of the council was up for election and the council stayed under no overall control.
The 2008 Colchester Borough Council election took place on 1 May 2008 to elect members of Colchester Borough Council in Essex, England. One third of the council was up for election and the Conservative party lost overall control of the council to no overall control.
The 2010 Colchester Borough Council election took place on 6 May 2010 to elect members of Colchester Borough Council in Essex, England. One third of the council was up for election and the council stayed under no overall control.
The 2011 Colchester Borough Council election took place on 5 May 2011 to elect members of Colchester Borough Council in Essex, England. One third of the council was up for election and the council stayed under no overall control.
The 2014 Colchester Borough Council election took place on 22 May 2014 to elect members of Colchester Borough Council in Essex, England. One third of the council was up for election and the council stayed under no overall control.
The 1999 Castle Point Borough Council election took place on 6 May 1999 to elect members of Castle Point Borough Council in Essex, England. The whole council was up for election and the Labour party stayed in overall control of the council.
The 2006 Brent London Borough Council election took place on 4 May 2006 to elect members of Brent London Borough Council in London, England. The whole council was up for election and the Labour party lost overall control of the council to no overall control.
The 2006 West Oxfordshire District Council election took place on 4 May 2006 to elect members of West Oxfordshire District Council in Oxfordshire, England. One third of the council was up for election and the Conservative party stayed in overall control of the council.
Elections to Colchester Borough Council took place on 5 May 2016. Colchester Borough Council normally elects one third of its councillors each year, however, due to boundary changes, the whole council is up for election.