Colchester Borough Council election, 2002

Last updated

Colchester Borough Council election, 2002
Flag of the United Kingdom.svg
  2000 7 May 2002 (2002-05-07) 2003  

60 seats (full council)
31 seats needed for a majority

 First partySecond partyThird party
  No image wide.svg No image wide.svg No image wide.svg
Party Liberal Democrat Conservative Labour
Seats before272210
Seats won26246
Seat changeDecrease2.svg 1Increase2.svg 2Decrease2.svg 4
Popular vote29,89932,45915,669
Percentage36.439.519.1

The 2002 Colchester Borough Council election took place on 2 May 2002 to elect members of Colchester Borough Council in Essex, England. This was the same day as the other 2002 local elections in the United Kingdom. Due to boundary changes, every seat was up for election and the council stayed under no overall control. [1] [2]

Borough status in the United Kingdom is granted by royal charter to local government districts in England, Wales and Northern Ireland. The status is purely honorary, and does not give any additional powers to the council or inhabitants of the district. In Scotland, similarly chartered communities were known as royal burghs, although the status is no longer granted.

Essex County of England

Essex is a county in the south-east of England, north-east of London. One of the home counties, it borders Suffolk and Cambridgeshire to the north, Hertfordshire to the west, Kent across the estuary of the River Thames to the south, and London to the south-west. The county town is Chelmsford, the only city in the county. For government statistical purposes Essex is placed in the East of England region.

England Country in north-west Europe, part of the United Kingdom

England is a country that is part of the United Kingdom. It shares land borders with Wales to the west and Scotland to the north-northwest. The Irish Sea lies west of England and the Celtic Sea lies to the southwest. England is separated from continental Europe by the North Sea to the east and the English Channel to the south. The country covers five-eighths of the island of Great Britain, which lies in the North Atlantic, and includes over 100 smaller islands, such as the Isles of Scilly and the Isle of Wight.

Contents

Election result

Both the Liberal Democrats and Conservatives gained seats to move to 26 and 24 seats respectively. [3] This was at the expense of the Labour party who lost 8 seats to only have 6 councillors. [3]

Liberal Democrats (UK) Political party in the United Kingdom

The Liberal Democrats are a liberal political party in the United Kingdom. They presently have 11 Members of Parliament in the House of Commons, 96 members of the House of Lords, and one member of the European Parliament. They also have five Members of the Scottish Parliament and a member each in the Welsh Assembly and London Assembly. The party reached the height of its influence in the early 2010s, forming a junior partner in a coalition government from 2010 to 2015. It is presently led by Vince Cable.

Conservative Party (UK) Political party in the United Kingdom

The Conservative Party, officially the Conservative and Unionist Party, is a centre-right political party in the United Kingdom. Presently led by Theresa May, it has been the governing party since 2010. It presently has 314 Members of Parliament in the House of Commons, 249 members of the House of Lords, and 18 members of the European Parliament. It also has 31 Members of the Scottish Parliament, 12 members of the Welsh Assembly, eight members of the London Assembly and 9,008 local councillors. One of the major parties of UK politics, it has formed the government on 45 occasions, more than any other party.

The Labour Party is a centre-left political party in the United Kingdom which has been described as an alliance of social democrats, democratic socialists and trade unionists. The party's platform emphasises greater state intervention, social justice and strengthening workers' rights.

In total there were 24 new councillors elected, with a number of sitting councillors being defeated, including the leader of the Liberal Democrats on the council, Bill Frame. [4] Frame had previously represented St Mary's ward, but contested Shrub End at the election and failed to be elected. [3] Colin Sykes returned as the leader of the Liberal Democrat group after winning election, 2 years after having lost his seat on the council. [5]

The wards and electoral divisions in the United Kingdom are electoral districts at sub-national level represented by one or more councillors. The ward is the primary unit of English electoral geography for civil parishes and borough and district councils, electoral ward is the unit used by Welsh principal councils, while the electoral division is the unit used by English county councils and some unitary authorities. Each ward/division has an average electorate of about 5,500 people, but ward-population counts can vary substantially. As at the end of 2014 there were 9,456 electoral wards/divisions in the UK.

Colchester Borough Council Election, 2002 [1] [2]
PartySeatsGainsLossesNet gain/lossSeats %Votes %Votes+/−
  Liberal Democrat 26103+743.336.429,899N/A
  Conservative 24133+1039.532,459N/A
  Labour 638-519.115,669N/A
  Independent 430+36.73.73,078N/A
  Green 0001.2970N/A
  Socialist Alliance 0000.1106N/A

* seat gains include newly created seats won by this party.
** percentage changes are null as there is no result to accurately compare them to.

Council composition

The composition of the council before the election and a summary of which parties' seats are up for election can be found in the following table: [1]

PartyPrevious councilStaying councillorsSeats up for electionElection resultNew council
Liberal Democrats240242626
Conservatives210212424
Labour1401466
Tiptree Residents30333
Independents10111
Greens00000
Total600606060

Ward results

Shown below are ward results according to the council's election results archive. [6] [7]

Berechurch

Berechurch
PartyCandidateVotes%±
Liberal Democrat Terence Sutton 913 50.1 Increase2.svg5.8
Liberal Democrat Craig Sutton 900
Liberal Democrat Susan Brooks 875
Labour Dave Harris66136.3Decrease2.svg3.7
Labour Paul Bishop613
Labour Christopher Pearson592
Conservative Elizabeth Lee24913.7Decrease2.svg2.0
Conservative Peter Burgoyne239
Conservative Patricia Conville234
Majority
Turnout 183031%
Liberal Democrat hold
Liberal Democrat gain from Labour

Birch and Winstree

Birch and Winstree
PartyCandidateVotes%
Conservative Kevin Bentley1,11762.3
Conservative Peter Crowe1,046'
Liberal Democrat Sharon Coveney36420.3
Labour Derek Jones31117.4
Majority
Turnout 1,60539.0
Conservative win (new seat)

Castle

Castle
PartyCandidateVotes%±
Liberal Democrat Christopher Hall 1,068 56.4 Increase2.svg13.5
Liberal Democrat Henry Spyvee 1,044
Liberal Democrat Kenneth Jones 984
Conservative Lynne Dingemans36919.5Decrease2.svg9.1
Conservative Alison Baxter357
Conservative Andrew Baxter357
Labour Lisa Laybourne26814.1Decrease2.svg12.3
Labour Hugh Thomas254
Labour Julia Thomas253
Green Peter Lynn19010.0New
Green Andrew Senter128
Turnout 1,82032.0
Liberal Democrat hold Swing

Christ Church

Christ Church
PartyCandidateVotes%
Liberal Democrat Nicholas Cope55941.9
Conservative Roger Buston54540.8
Liberal Democrat Martin Clifford Hunt530
Conservative Anthony Hauton488
Labour Maureen Lee23117.3
Turnout 127840%
Liberal Democrat win (new seat)
Conservative win (new seat)

Copford & West Stanway

Copford & West Stanway
PartyCandidateVotes%
Conservative Elizabeth Blundell38475.2
Liberal Democrat Sally Scott12524.5
Majority25950.7
Turnout 51135.0
Conservative win (new seat)

Dedham & Langham

Dedham & Langham
PartyCandidateVotes%
Conservative John Garnett75773.7
Liberal Democrat Carolyn West19719.2
Labour Geraldine Harris737.1
Majority56054.5
Turnout 102945.0
Conservative win (new seat)

East Donyland

East Donyland
PartyCandidateVotes%±
Labour Andrew Raison 286 43.2 Increase2.svg9.7
Conservative Patricia Sanderson24637.2Decrease2.svg6.2
Liberal Democrat Barry Woodward13019.6Decrease2.svg3.5
Majority406.0
Turnout 66236.0
Labour gain from Conservative Swing

Fordham & Stour

Fordham & Stour
PartyCandidateVotes%
Conservative John Arnold96062.0
Conservative Nigel Chapman917'
Liberal Democrat Alexander Scott34122.0
Labour Thomas Prosser24816.0
Turnout 1,33833.0
Conservative win (new seat)

Great Tey

Great Tey
PartyCandidateVotes%±
Conservative Peter Chillingworth 566 65.7 Increase2.svg20.0
Liberal Democrat Andrew Phillips29534.3Decrease2.svg11.5
Majority27131.5
Turnout 86240.0
Conservative gain from Liberal Democrat Swing

Harbour

Harbour
PartyCandidateVotes%±
Liberal Democrat Patricia Blandon 674 52.6 Increase2.svg12.5
Liberal Democrat Justin Knight 548
Labour David Canning42433.1Increase2.svg1.2
Labour Jane Green392
Conservative Michael Coyne18414.4Decrease2.svg3.2
Conservative Sandra Ann Rae165
Majority
Turnout 128629.0
Liberal Democrat gain from Labour Swing
Liberal Democrat hold Swing

Highwoods

Highwoods
PartyCandidateVotes%
Liberal Democrat Gerard Oxford66556.0
Liberal Democrat Beverley Oxford649'
Liberal Democrat Ian Ringer560'
Conservative Sarah McClean29424.8
Conservative Alan Blundell293
Conservative Richard Stevenson278
Labour Edmund Chinnery22819.2
Labour Michael Smith208
Turnout 1,13520.0
Liberal Democrat win (new seat)

Lexden

Lexden
PartyCandidateVotes%±
Conservative Sonia Lewis 1,258 57.6 Decrease2.svg7.0
Conservative Donald Henshall 1,091
Liberal Democrat Barbara Williamson68831.5Increase2.svg1.9
Labour Alan Trudgian23910.9Increase2.svg5.1
Turnout 1,88944%
Conservative hold Swing

Marks Tey

Marks Tey
PartyCandidateVotes%±
Conservative Richard Gower 405 64.7 Decrease2.svg0.7
Labour Edna Salmon 125 20.0 Increase2.svg0.4
Liberal Democrat Mark Gray9615.3Increase2.svg0.2
Majority28044.7
Turnout 62731.0
Conservative hold Swing

Mile End

Mile End
PartyCandidateVotes%±
Conservative Nicholas Taylor 599 33.7 Decrease2.svg1.5
Conservative Matthew Eaton 593
Liberal Democrat Anne Turrell 546 30.7 Decrease2.svg10.6
Liberal Democrat Alan Hayman529
Conservative Wendy Scattergood526
Labour Lucy Wood44625.1Increase2.svg1.6
Independent John Sutcliffe18710.5New
Majority
Turnout 130926%
Conservative gain from Liberal Democrat Swing
Conservative hold Swing
Liberal Democrat hold Swing

New Town

New Town
PartyCandidateVotes%±
Liberal Democrat Theresa Higgins 970 57.0 Decrease2.svg0.2
Liberal Democrat Peter Higgins 948
Liberal Democrat Margaret Fisher 932
Labour Jean Quinn46527.3Increase2.svg1.4
Conservative Colin Beattie26715.7Decrease2.svg1.2
Conservative Glenn Bath260
Conservative Angus Allan236
Majority
Turnout 159926.0
Liberal Democrat hold Swing

Prettygate

Prettygate
PartyCandidateVotes%±
Liberal Democrat Paul Sheppard 1,015 43.4 Increase2.svg4.7
Liberal Democrat John Gray 1,013
Conservative Ronald Levy 996 42.6 Decrease2.svg6.1
Conservative PeterCrafford975
Liberal Democrat Sandra Gray974
Conservative Michael Pearson940
Labour Andrew Frost32613.9Increase2.svg1.3
Turnout 2,23937.0
Liberal Democrat hold Swing
Liberal Democrat gain from Conservative Swing
Conservative hold Swing

Pyefleet

Pyefleet
PartyCandidateVotes%±
Conservative Robert Davidson 581 66.9 Increase2.svg0.2
Liberal Democrat Wilma Sutton28733.1Increase2.svg16.8
Majority29433.9
Turnout 87543.0
Conservative hold Swing

St. Andrew's

St Andrew's
PartyCandidateVotes%±
Labour Julie Young 851 56.1 Decrease2.svg1.1
Labour Donald Quinn 818
Labour Tim Young 808
Liberal Democrat John Fellows32321.3Decrease2.svg0.8
Conservative Anne Allan23815.7Decrease2.svg5.1
Conservative Susan Burgoyne213
Conservative Pauline Lucas203
Socialist Alliance Jeremy Jepps1067.0New
Turnout 1,33320.0
Labour hold Swing
Labour hold Swing
Labour hold Swing

St. Anne's

St Anne's
PartyCandidateVotes%±
Liberal Democrat Mike Hogg 895 55.3 Increase2.svg12.1
Liberal Democrat Helen Chuah 824
Liberal Democrat Barrie Cook 785
Labour Peter Brine42526.3Decrease2.svg17.1
Labour David Jonas394
Labour Paul Fryer-Kelsey385
Conservative Brigitte Beard29918.5Increase2.svg4.8
Conservative Richard Lamberth272
Conservative Allan Doran257
Turnout 1,59425.0
Liberal Democrat hold Swing
Liberal Democrat gain from Labour Swing

St. John's

St John's
PartyCandidateVotes%±
Liberal Democrat Raymond Gamble 1,030 67.8 Increase2.svg15.7
Liberal Democrat Paul Smith 919
Conservative Derek Smith36624.1Decrease2.svg12.6
Conservative Elizabeth Gorman308
Labour Anna Trudgian1238.1Decrease2.svg3.1
Turnout 148236.0
Liberal Democrat hold Swing

Shrub End

Shrub End
PartyCandidateVotes%±
Conservative Winifred Foster 593 36.2 Increase2.svg12.2
Conservative Amanda Arnold 589
Conservative Alan Scattergood 561
Labour Richard Bourne55333.8Decrease2.svg4.7
Labour Luke Dopson520
Labour Kim Naish502
Liberal Democrat Keith Hindle49030.0Decrease2.svg7.5
Liberal Democrat William Frame458
Liberal Democrat Susan Waite452
Turnout 1,60825.0
Conservative gain from Liberal Democrat Swing
Conservative gain from Labour Swing

Stanway

Stanway
PartyCandidateVotes%±
Liberal Democrat Colin Sykes 1,137 53.4 Increase2.svg11.5
Liberal Democrat Gwendoline Ilott 1,099
Liberal Democrat Leslie Scott-Boutell 1,043
Conservative Jane Collier73034.4Decrease2.svg10.3
Conservative Jonathan Pyman717
Conservative Michael Segal670
Labour Ian Yates26112.3Decrease2.svg1.1
Turnout 2,02934.0
Liberal Democrat gain from Conservative Swing
Liberal Democrat hold Swing

Tiptree

Tiptree
PartyCandidateVotes%±
Independent John Webb 757 33.8 New
Independent John Elliott 620
Independent Anne Burgess 617
Labour Alan Mogridge56925.4Increase2.svg7.1
Labour Audrey Spencer432
Conservative Agnes Cannon39817.8Decrease2.svg4.9
Conservative Margaret Crowe398
Conservative John Reeves354
Independent Helen Bunney33014.8Decrease2.svg2.0
Green Stella Barnes1838.2New
Turnout 1,68929.0
Independent hold Swing
Independent gain from Labour Swing

West Bergholt & Eight Ash Green

West Bergholt & Eight Ash Green
PartyCandidateVotes%±
Conservative David Cannon 757 47.2
Conservative Jill Todd 692
Liberal Democrat Una Jones32320.1
Labour Gary Griffiths28717.9
Green John Withers23814.8
Majority
Turnout 1,24833.0
Conservative hold Swing

West Mersea

West Mersea
PartyCandidateVotes%±
Conservative John Jowers 1,348 62.2
Conservative John Bouckley 1,184
Conservative Margaret Kimberley 1,136
Labour Bry Mogridge43019.8
Liberal Democrat Ronald Baker38918.0
Turnout 1,81431%
Conservative hold Swing

Wivenhoe Cross

Wivenhoe Cross
PartyCandidateVotes%
Labour Philip Hawkins36944.0
Conservative David Adams30336.1
Conservative Kenneth Rogers290
Labour David Purdy184
Liberal Democrat John Galpin16719.9
Liberal Democrat Patrick Mossop149
Turnout 65817.0
Labour win (new seat)
Conservative win (new seat)

Wivenhoe Quay

Wivenhoe Quay
PartyCandidateVotes%
Labour Robert Newman59232.9
Independent Samuel Davies56731.5
Labour Stephen Ford523
Conservative Eugene Kraft41222.9
Conservative Elizabeth Corke399
Green Christopher Fox23112.8
Turnout 1,45638.0
Labour win (new seat)
Independent win (new seat)

Related Research Articles

Colchester Borough Council elections

One third of Colchester Borough Council in Essex, England is elected each year, followed by one year without election. Since the last boundary changes at the 2016 election, 51 councillors have been elected from 17 wards.

The 1999 St Helens Metropolitan Borough Council election took place on 6 May 1999 to elect members of St Helens Metropolitan Borough Council in Merseyside, England. One third of the council was up for election and the Labour party stayed in overall control of the council.

The 2000 St Helens Metropolitan Borough Council election took place on 4 May 2000 to elect members of St Helens Metropolitan Borough Council in Merseyside, England. One third of the council was up for election and the Labour party stayed in overall control of the council.

2006 St Helens Metropolitan Borough Council election

The 2006 St Helens Metropolitan Borough Council election took place on 4 May 2006 to elect members of St Helens Metropolitan Borough Council in Merseyside, England. One third of the council was up for election and the council stayed under no overall control.

2006 Colchester Borough Council election

The 2006 Colchester Borough Council election took place on 4 May 2006 to elect members of Colchester Borough Council in Essex, England. One third of the council was up for election and the council stayed under no overall control.

2003 Harlow District Council election

The 2003 Harlow District Council election took place on 1 May 2003 to elect members of Harlow District Council in Essex, England. One third of the council was up for election and the council stayed under no overall control.

2007 St Helens Metropolitan Borough Council election

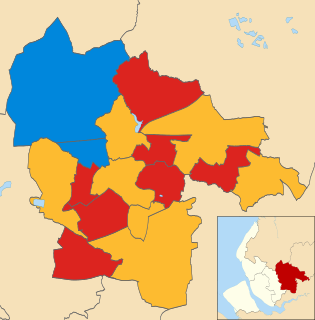
The 2007 St Helens Metropolitan Borough Council election took place on 3 May 2007 to elect members of St Helens Metropolitan Borough Council in Merseyside, England. One third of the council was up for election and the council stayed under no overall control.

2003 St Albans City and District Council election

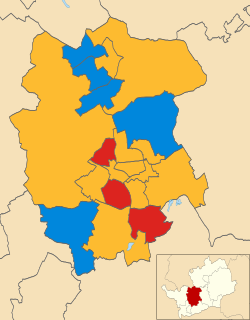
The 2003 St Albans City and District Council election took place on 1 May 2003 to elect members of St Albans District Council in Hertfordshire, England. One third of the council was up for election and the council stayed under no overall control.

2006 St Albans City and District Council election

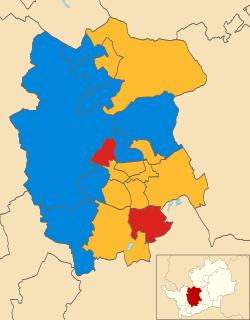
The 2006 St Albans City and District Council election took place on 4 May 2006 to elect members of St Albans District Council in Hertfordshire, England. One third of the council was up for election and the Liberal Democrats gained overall control of the council from no overall control.

2003 Colchester Borough Council election

The 2003 Colchester Borough Council election took place on 1 May 2003 to elect members of Colchester Borough Council in Essex, England. This was the same day as the other 2003 United Kingdom local elections. One third of the seats were up for election and the council stayed under no overall control.

2004 Colchester Borough Council election

The 2004 Colchester Borough Council election took place on 10 June 2004 to elect members of Colchester Borough Council in Essex, England. This was the same day as the other 2004 United Kingdom local elections and as the 2004 European Parliament Elections. One third of the seats were up for election and the council stayed under no overall control.

The 2000 Colchester Borough Council election took place on 4 May 2000 to elect members of Colchester Borough Council in Essex, England. One third of the council was up for election and the council stayed under no overall control.

2007 Colchester Borough Council election

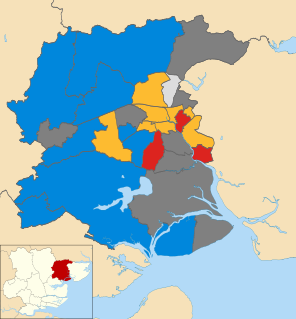
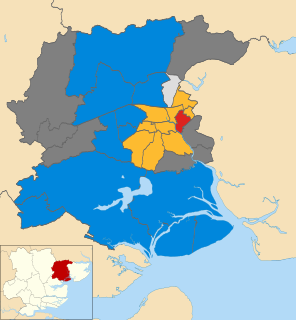
The 2007 Colchester Borough Council election took place on 3 May 2007 to elect members of Colchester Borough Council in Essex, England. One third of the council was up for election and the council stayed under no overall control.

2008 Colchester Borough Council election

The 2008 Colchester Borough Council election took place on 1 May 2008 to elect members of Colchester Borough Council in Essex, England. One third of the council was up for election and the Conservative party lost overall control of the council to no overall control.

2011 Colchester Borough Council election

The 2011 Colchester Borough Council election took place on 5 May 2011 to elect members of Colchester Borough Council in Essex, England. One third of the council was up for election and the council stayed under no overall control.

The 2014 Colchester Borough Council election took place on 22 May 2014 to elect members of Colchester Borough Council in Essex, England. One third of the council was up for election and the council stayed under no overall control.

2012 Pendle Borough Council election

The 2012 Pendle Borough Council election took place on 3 May 2012 to elect members of Pendle Borough Council in Lancashire, England. One third of the council was up for election and the council stayed under no overall control.

2006 Brent London Borough Council election

The 2006 Brent London Borough Council election took place on 4 May 2006 to elect members of Brent London Borough Council in London, England. The whole council was up for election and the Labour party lost overall control of the council to no overall control.

2010 St Helens Metropolitan Borough Council election

The 2010 St Helens Metropolitan Borough Council election took place on 6 May 2010 to elect members of St Helens Metropolitan Borough Council in Merseyside, England. One third of the council was up for election and the Labour party gained overall control of the council from no overall control.

2012 St Helens Metropolitan Borough Council election

The 2012 St Helens Metropolitan Borough Council election took place on 3 May 2012 to elect members of St Helens Metropolitan Borough Council in Merseyside, England. One third of the council was up for election and the Labour party stayed in overall control of the council.

References

  1. 1 2 3 "BBC News Vote 2002 Local Elections". BBC News. BBC. Retrieved 1 July 2012.
  2. 1 2 "Local Elections in England: 2 May 2002" (PDF). House of Commons Library . 9 May 2002. Retrieved 26 May 2014.
  3. 1 2 3 "Colchester : Labour suffer and Lib Dem leader goes". Essex County Publications. NewsBank. 3 May 2002.
  4. "Colchester : Leader Bill's out of the Frame". Essex County Publications. NewsBank. 3 May 2002.
  5. "Colchester : Lib Dems' leader returns recharged". Essex County Publications. NewsBank. 6 May 2002.
  6. "Election Results". Colchester Borough Council. Retrieved 1 July 2012.
  7. "Turnout". Colchester Borough Council. Retrieved 1 July 2012.