| |||||||||||||||||||||||||||||||||||||||||
20 seats (out of 60 seats) 31 seats needed for a majority | |||||||||||||||||||||||||||||||||||||||||
---|---|---|---|---|---|---|---|---|---|---|---|---|---|---|---|---|---|---|---|---|---|---|---|---|---|---|---|---|---|---|---|---|---|---|---|---|---|---|---|---|---|
|
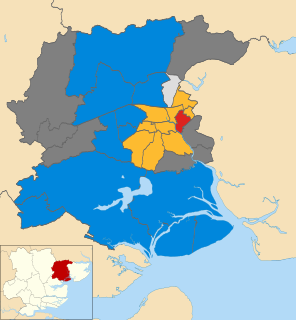
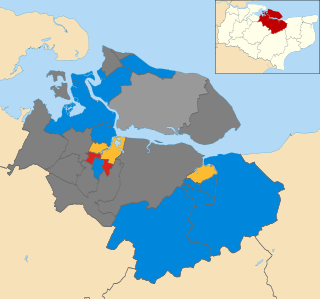
The 2008 Colchester Borough Council election took place on 1 May 2008 to elect members of Colchester Borough Council in Essex, England. One third of the council was up for election and the Conservative party lost overall control of the council to no overall control. [1]
Borough status in the United Kingdom is granted by royal charter to local government districts in England, Wales and Northern Ireland. The status is purely honorary, and does not give any additional powers to the council or inhabitants of the district. In Scotland, similarly chartered communities were known as royal burghs, although the status is no longer granted.
Essex is a county in the south-east of England, north-east of London. One of the home counties, it borders Suffolk and Cambridgeshire to the north, Hertfordshire to the west, Kent across the estuary of the River Thames to the south, and London to the south-west. The county town is Chelmsford, the only city in the county. For government statistical purposes Essex is placed in the East of England region.
England is a country that is part of the United Kingdom. It shares land borders with Wales to the west and Scotland to the north-northwest. The Irish Sea lies west of England and the Celtic Sea lies to the southwest. England is separated from continental Europe by the North Sea to the east and the English Channel to the south. The country covers five-eighths of the island of Great Britain, which lies in the North Atlantic, and includes over 100 smaller islands, such as the Isles of Scilly and the Isle of Wight.
After the election, the composition of the council was
The Conservative Party, officially the Conservative and Unionist Party, is a centre-right political party in the United Kingdom. Presently led by Theresa May, it has been the governing party since 2010. It presently has 314 Members of Parliament in the House of Commons, 249 members of the House of Lords, and 18 members of the European Parliament. It also has 31 Members of the Scottish Parliament, 12 members of the Welsh Assembly, eight members of the London Assembly and 9,008 local councillors. One of the major parties of UK politics, it has formed the government on 45 occasions, more than any other party.
The Liberal Democrats are a liberal political party in the United Kingdom. They presently have 11 Members of Parliament in the House of Commons, 96 members of the House of Lords, and one member of the European Parliament. They also have five Members of the Scottish Parliament and a member each in the Welsh Assembly and London Assembly. The party reached the height of its influence in the early 2010s, forming a junior partner in a coalition government from 2010 to 2015. It is presently led by Vince Cable.
The Labour Party is a centre-left political party in the United Kingdom which has been described as an alliance of social democrats, democratic socialists and trade unionists. The party's platform emphasises greater state intervention, social justice and strengthening workers' rights.
After the last election in 2007 the Conservatives held half of the seats on the council with 30 councillors, while the Liberal Democrats had 21 seats, Labour 6 seats and there were 3 independents. [3] However, in July 2007, 2 Liberal Democrat councilors, Craig and Terry Sutton, defected to the Conservatives after falling out with the local Liberal Democrat Member of parliament Bob Russell over a new community stadium. [4] This gave the Conservatives a majority on the council with 32 of the 60 seats. [5]
A Councillor is a member of a local government council.
A member of parliament (MP) is the representative of the voters to a parliament. In many countries with bicameral parliaments, this category includes specifically members of the lower house, as upper houses often have a different title. Member of Congress is an equivalent term in other jurisdictions.
20 seats were contested at the election, with the Conservatives defending 12 of the seats. [6] A total of 82 candidates stood at the election, including full slates from the Conservative, Liberal Democrat, Labour and Green parties, along with one candidate from the British National Party. [5]
The British National Party (BNP) is a far-right, fascist political party in the United Kingdom. It is headquartered in Wigton, Cumbria, and its current leader is Adam Walker. A minor party, it has no elected representatives at any level of UK government. Founded in 1982, the party reached its greatest level of success in the 2000s, when it had over fifty seats in local government, one seat on the London Assembly, and two Members of the European Parliament.
The Conservatives lost their majority on the council after losing 5 seats, 4 to the Liberal Democrats and 1 to Labour. [7] Among those who lost seats were 2 members of the Conservative council cabinet, while Craig Sutton in Berechurch lost his seat to Labour after having defected to the Conservatives from the Liberal Democrats in 2007. [7] Conservative defeats were attributed to high levels of housebuilding in the area, with the Conservatives dropping to 27 seats, while the Liberal Democrats rose to 23 seats and Labour went up to 7 seats. [7] Meanwhile, the British National Party came fourth in High Woods ward with 131 votes after putting up the party's first candidate for Colchester council. [8] Overall turnout at the election was 34.5%. [9]
A Cabinet is a body of high-ranking state officials, typically consisting of the top leaders of the executive branch. Members of a cabinet are usually called Cabinet ministers or secretaries. The function of a Cabinet varies: in some countries it is a collegiate decision-making body with collective responsibility, while in others it may function either as a purely advisory body or an assisting institution to a decision making head of state or head of government. Cabinets are typically the body responsible for the day-to-day management of the government and response to sudden events, whereas the legislative and judicial branches work in a measured pace, in sessions according to lengthy procedures.
Berechurch is a village in Colchester, Essex, England.
The wards and electoral divisions in the United Kingdom are electoral districts at sub-national level represented by one or more councillors. The ward is the primary unit of English electoral geography for civil parishes and borough and district councils, electoral ward is the unit used by Welsh principal councils, while the electoral division is the unit used by English county councils and some unitary authorities. Each ward/division has an average electorate of about 5,500 people, but ward-population counts can vary substantially. As at the end of 2014 there were 9,456 electoral wards/divisions in the UK.
Following the election the Liberal Democrat, Labour and independent groups made a deal to take control over the council from the Conservatives, with Liberal Democrat Anne Turrell becoming the new leader of the council. [10]
Party | Seats | Gains | Losses | Net gain/loss | Seats % | Votes % | Votes | +/− | |
---|---|---|---|---|---|---|---|---|---|
Liberal Democrat | 9 | 4 | 0 | +4 | 45.0 | 37.2 | 13,111 | +3.0 | |
Conservative | 7 | 0 | 5 | -5 | 35.0 | 37.3 | 13,142 | -3.6 | |
Labour | 3 | 1 | 0 | +1 | 15.0 | 13.0 | 4,593 | -5.2 | |
Independent | 1 | 0 | 0 | 0 | 5.0 | 3.5 | 1,247 | -3.2 | |
Green | 0 | 0 | 0 | 0 | 0 | 8.5 | 3,012 | N/A | |
BNP | 0 | 0 | 0 | 0 | 0 | 0.4 | 131 | N/A |
Party | Candidate | Votes | % | ± | |
---|---|---|---|---|---|
Labour | Kim Naish | 735 | 37.0 | -12.7 | |
Liberal Democrat | John Stevens | 682 | 34.3 | +8.5 | |
Conservative | Craig Sutton | 435 | 21.9 | +3.1 | |
Green | Philippa Lane | 136 | 6.8 | +1.0 | |
Majority | 53 | 2.7 | -21.2 | ||
Turnout | 1,988 | 33.5 | +0.8 | ||
Labour gain from Conservative | Swing | ||||
Party | Candidate | Votes | % | ± | |
---|---|---|---|---|---|
Liberal Democrat | William Spyvee | 1,111 | 45.2 | +4.2 | |
Green | Peter Lynn | 779 | 31.7 | -0.6 | |
Conservative | Darius Laws | 434 | 17.6 | -2.9 | |
Labour | John Cooke | 136 | 5.5 | -0.7 | |
Majority | 332 | 13.5 | +4.8 | ||
Turnout | 2,460 | 38.1 | +0.7 | ||
Liberal Democrat hold | Swing |
Party | Candidate | Votes | % | ± | |
---|---|---|---|---|---|
Conservative | John Garnett | 895 | 82.8 | +3.8 | |
Liberal Democrat | Carolyn Catney | 102 | 9.4 | -4.9 | |
Labour | Andrew Maxwell | 46 | 4.3 | -2.4 | |
Green | Sandra Moog | 38 | 3.5 | +3.5 | |
Majority | 793 | 73.4 | +8.8 | ||
Turnout | 1,081 | 45.6 | -8.1 | ||
Conservative hold | Swing |
Party | Candidate | Votes | % | ± | |
---|---|---|---|---|---|
Labour | Michael Lilley | 351 | 42.8 | -1.1 | |
Conservative | Peter Hare | 344 | 42.0 | +11.7 | |
Liberal Democrat | Barry Woodward | 67 | 8.2 | -1.3 | |
Green | Tracy Lee-Newman | 58 | 7.1 | +7.1 | |
Majority | 7 | 0.9 | -12.6 | ||
Turnout | 820 | 41.2 | -7.7 | ||
Labour hold | Swing |
Party | Candidate | Votes | % | ± | |
---|---|---|---|---|---|
Liberal Democrat | Justin Knight | 727 | 59.3 | -4.5 | |
Conservative | Barry McConnell | 271 | 22.1 | +4.0 | |
Labour | Michael Gilheany | 141 | 11.5 | -0.1 | |
Green | Stephen Ford | 88 | 7.2 | +0.8 | |
Majority | 456 | 37.2 | -8.5 | ||
Turnout | 1,227 | 27.7 | -2.0 | ||
Liberal Democrat hold | Swing |
Party | Candidate | Votes | % | ± | |
---|---|---|---|---|---|
Independent | Beverley Oxford | 1,247 | 59.5 | +6.9 | |
Conservative | Anne Allan | 320 | 15.3 | -6.1 | |
Liberal Democrat | John Baker | 237 | 11.3 | -4.0 | |
BNP | Patrick Sullivan | 131 | 6.3 | +6.3 | |
Labour | Jordan Newell | 97 | 4.6 | -1.8 | |
Green | Robert Spence | 63 | 3.0 | -1.4 | |
Majority | 927 | 44.2 | +12.9 | ||
Turnout | 2,095 | 31.4 | +0.5 | ||
Independent hold | Swing |
Party | Candidate | Votes | % | ± | |
---|---|---|---|---|---|
Conservative | Michael Hardy | 1,079 | 62.3 | -3.5 | |
Liberal Democrat | John Loxley | 477 | 27.6 | +7.8 | |
Green | Clare Palmer | 104 | 6.0 | +0.6 | |
Labour | Adam Fox | 71 | 4.1 | -1.2 | |
Majority | 602 | 34.8 | -11.2 | ||
Turnout | 1,731 | 41.2 | -5.9 | ||
Conservative hold | Swing |
Party | Candidate | Votes | % | ± | |
---|---|---|---|---|---|
Conservative | Elizabeth Blundell | 450 | 63.7 | +2.2 | |
Labour | John Wood | 123 | 17.4 | +4.8 | |
Liberal Democrat | Josephine Hayes | 88 | 12.5 | -3.5 | |
Green | Roger Bamforth | 45 | 6.4 | +6.4 | |
Majority | 327 | 46.3 | +0.7 | ||
Turnout | 706 | 34.5 | -6.5 | ||
Conservative hold | Swing |
Party | Candidate | Votes | % | ± | |
---|---|---|---|---|---|
Liberal Democrat | Martin Goss | 1,500 | 61.1 | +14.0 | |
Conservative | Brian Jarvis | 790 | 32.2 | -11.2 | |
Green | Mary Bryan | 84 | 3.4 | -0.9 | |
Labour | Rossanna Trudgian | 83 | 3.4 | -1.7 | |
Majority | 710 | 28.9 | +25.1 | ||
Turnout | 2,457 | 39.0 | -0.5 | ||
Liberal Democrat gain from Conservative | Swing | ||||
Party | Candidate | Votes | % | ± | |
---|---|---|---|---|---|
Liberal Democrat | Peter Higgins | 1,046 | 62.6 | +7.0 | |
Conservative | Glenn Bath | 277 | 16.6 | -0.7 | |
Green | Linda Wonnacott | 198 | 11.8 | -4.3 | |
Labour | Luke Dopson | 150 | 9.0 | -2.0 | |
Majority | 769 | 46.0 | +7.7 | ||
Turnout | 1,671 | 27.5 | +0.5 | ||
Liberal Democrat hold | Swing |
Party | Candidate | Votes | % | ± | |
---|---|---|---|---|---|
Conservative | Beverley Davies | 1,197 | 45.5 | -8.7 | |
Liberal Democrat | Paul Ost | 1,167 | 44.3 | +10.5 | |
Labour | Michael Dale | 142 | 5.4 | -1.6 | |
Green | Peter Appleton | 127 | 4.8 | -0.2 | |
Majority | 30 | 1.1 | -19.3 | ||
Turnout | 2,633 | 44.2 | +0.5 | ||
Conservative hold | Swing |
Party | Candidate | Votes | % | ± | |
---|---|---|---|---|---|
Labour | Tina Dopson | 837 | 51.2 | -10.4 | |
Liberal Democrat | Mark Warner | 496 | 30.3 | +11.3 | |
Conservative | Alexander Wilson | 240 | 14.7 | -0.4 | |
Green | Andrew Senter | 63 | 3.9 | -0.4 | |
Majority | 341 | 20.8 | -21.8 | ||
Turnout | 1,636 | 24.9 | +0.1 | ||
Labour hold | Swing |
Party | Candidate | Votes | % | ± | |
---|---|---|---|---|---|
Liberal Democrat | Gaik Chiuah | 1,049 | 56.5 | +7.2 | |
Conservative | Stephen Levy | 393 | 21.2 | +3.0 | |
Labour | Robert Fisher | 272 | 14.7 | -12.3 | |
Green | Mervyn Carter | 141 | 7.6 | +2.1 | |
Majority | 656 | 35.4 | +13.1 | ||
Turnout | 1,855 | 28.7 | -3.5 | ||
Liberal Democrat hold | Swing |
Party | Candidate | Votes | % | ± | |
---|---|---|---|---|---|
Liberal Democrat | Paul Smith | 1,244 | 71.6 | +9.8 | |
Conservative | Glenn Granger | 389 | 22.4 | -6.8 | |
Labour | Scott Harris | 59 | 3.4 | -1.2 | |
Green | Tobie Glenny | 45 | 2.6 | -1.8 | |
Majority | 855 | 49.2 | +16.7 | ||
Turnout | 1,737 | 42.0 | -1.4 | ||
Liberal Democrat hold | Swing |
Party | Candidate | Votes | % | ± | |
---|---|---|---|---|---|
Liberal Democrat | David Offen | 822 | 42.9 | +8.4 | |
Conservative | Roger Buston | 811 | 42.3 | +3.8 | |
Labour | Bruce Tuxford | 196 | 10.2 | -11.5 | |
Green | Walter Schwarz | 89 | 4.6 | -0.8 | |
Majority | 11 | 0.6 | |||
Turnout | 1,918 | 30.0 | -1.2 | ||
Liberal Democrat gain from Conservative | Swing | ||||
Party | Candidate | Votes | % | ± | |
---|---|---|---|---|---|
Liberal Democrat | Laura Sykes | 1,118 | 45.6 | -6.6 | |
Conservative | Andrew Ellis | 1,063 | 43.3 | +4.7 | |
Labour | Carole Spademan | 176 | 7.2 | +1.1 | |
Green | Pamela Nelson | 96 | 3.9 | +0.7 | |
Majority | 55 | 2.2 | -11.4 | ||
Turnout | 2,453 | 38.8 | +1.1 | ||
Liberal Democrat gain from Conservative | Swing | ||||
Party | Candidate | Votes | % | ± | |
---|---|---|---|---|---|
Conservative | Richard Martin | 1,116 | 60.5 | -4.9 | |
Liberal Democrat | Jonathan Longman | 345 | 18.7 | +10.4 | |
Labour | Audrey Spencer | 242 | 13.1 | -5.1 | |
Green | Katherine Bamforth | 142 | 7.7 | -0.4 | |
Majority | 771 | 41.8 | -5.4 | ||
Turnout | 1,845 | 30.4 | +0.2 | ||
Conservative hold | Swing |
Party | Candidate | Votes | % | ± | |
---|---|---|---|---|---|
Conservative | John Bouckley | 1,583 | 77.7 | +3.6 | |
Liberal Democrat | Jennifer Stevens | 195 | 9.6 | -0.3 | |
Labour | Barbara Nichols | 139 | 6.8 | -1.9 | |
Green | Beverley Maltby | 120 | 5.9 | -1.4 | |
Majority | 1,388 | 68.1 | +3.8 | ||
Turnout | 2,037 | 34.5 | -0.5 | ||
Conservative hold | Swing |
Party | Candidate | Votes | % | ± | |
---|---|---|---|---|---|
Liberal Democrat | Jonathan Manning | 506 | 48.4 | +5.9 | |
Conservative | Eugene Kraft | 377 | 36.1 | -3.8 | |
Green | Maria Iacovou | 83 | 7.9 | -1.0 | |
Labour | Janet Smith | 79 | 7.6 | -1.0 | |
Majority | 129 | 12.3 | +9.7 | ||
Turnout | 1,045 | 29.7 | +2.4 | ||
Liberal Democrat gain from Conservative | Swing | ||||
Party | Candidate | Votes | % | ± | |
---|---|---|---|---|---|
Conservative | Ann Quarrie | 678 | 36.8 | +1.1 | |
Labour | Josephine Richardson | 518 | 28.1 | -7.8 | |
Green | Christopher Fox | 513 | 27.9 | +7.4 | |
Liberal Democrat | Claire Rodgers | 132 | 7.2 | -0.9 | |
Majority | 160 | 8.7 | |||
Turnout | 1,841 | 43.8 | -0.6 | ||
Conservative hold | Swing |
A by-election took place in Birch and Winstree ward on the 4 December 2008 after the death of the Conservative councillor Peter Crowe. [12] Andrew Ellis retained the seat for the Conservatives by a majority of 322 votes. [12]
Party | Candidate | Votes | % | ± | |
---|---|---|---|---|---|
Conservative | Andrew Ellis | 745 | 58.1 | -12.1 | |
Liberal Democrat | Jonathan Longman | 423 | 33.0 | +14.1 | |
Labour | James Spencer | 83 | 6.5 | +0.4 | |
Green | Katherine Bamforth | 32 | 2.5 | -2.5 | |
Majority | 322 | 25.1 | |||
Turnout | 1,283 | 29.3 | |||
Conservative hold | Swing |
Colchester Politics: Colchester is a historic town located in Essex, England. It served as the first capital of Roman Britain and makes a claim to be the oldest town in Britain.
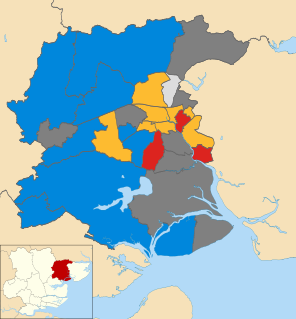
The 2006 Colchester Borough Council election took place on 4 May 2006 to elect members of Colchester Borough Council in Essex, England. One third of the council was up for election and the council stayed under no overall control.
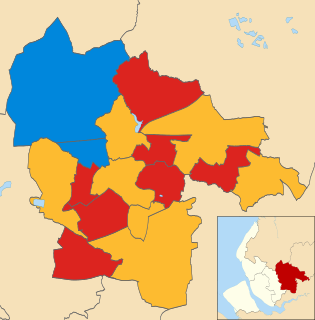
The 2008 St Helens Metropolitan Borough Council election took place on 1 May 2008 to elect members of St Helens Metropolitan Borough Council in Merseyside, England. One third of the council was up for election and the council stayed under no overall control.
The 2007 Thurrock Council election took place on 3 May 2007 to elect members of Thurrock Council in Essex, England. One third of the council was up for election and the Conservative party lost overall control of the council to no overall control.
The 2007 St Helens Metropolitan Borough Council election took place on 3 May 2007 to elect members of St Helens Metropolitan Borough Council in Merseyside, England. One third of the council was up for election and the council stayed under no overall control.
The 2006 Solihull Metropolitan Borough Council election took place on 4 May 2006 to elect members of Solihull Metropolitan Borough Council in the West Midlands, England. One third of the council was up for election and the Conservative party stayed in overall control of the council.
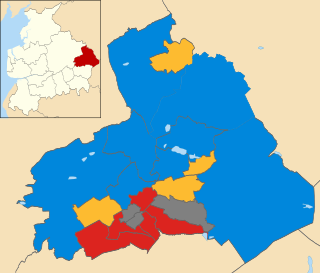
The 2006 Pendle Borough Council election took place on 4 May 2006 to elect members of Pendle Borough Council in Lancashire, England. One third of the council was up for election and the Liberal Democrats stayed in overall control of the council.
The 2012 Colchester Borough Council election took place on 3 May 2012 to elect members of Colchester Borough Council in Essex, England. One third of the council was up for election and the council stayed under no overall control.
The 2002 Colchester Borough Council election took place on 2 May 2002 to elect members of Colchester Borough Council in Essex, England. This was the same day as the other 2002 local elections in the United Kingdom. Due to boundary changes, every seat was up for election and the council stayed under no overall control.
The 2003 Colchester Borough Council election took place on 1 May 2003 to elect members of Colchester Borough Council in Essex, England. This was the same day as the other 2003 United Kingdom local elections. One third of the seats were up for election and the council stayed under no overall control.
The 2004 Colchester Borough Council election took place on 10 June 2004 to elect members of Colchester Borough Council in Essex, England. This was the same day as the other 2004 United Kingdom local elections and as the 2004 European Parliament Elections. One third of the seats were up for election and the council stayed under no overall control.
The 2000 Colchester Borough Council election took place on 4 May 2000 to elect members of Colchester Borough Council in Essex, England. One third of the council was up for election and the council stayed under no overall control.
The 2007 Colchester Borough Council election took place on 3 May 2007 to elect members of Colchester Borough Council in Essex, England. One third of the council was up for election and the council stayed under no overall control.
The 2011 Colchester Borough Council election took place on 5 May 2011 to elect members of Colchester Borough Council in Essex, England. One third of the council was up for election and the council stayed under no overall control.
The 2014 Colchester Borough Council election took place on 22 May 2014 to elect members of Colchester Borough Council in Essex, England. One third of the council was up for election and the council stayed under no overall control.
The 2011 Pendle Borough Council election took place on 5 May 2011 to elect members of Pendle Borough Council in Lancashire, England. One third of the council was up for election and the council stayed under no overall control.
The 2012 Pendle Borough Council election took place on 3 May 2012 to elect members of Pendle Borough Council in Lancashire, England. One third of the council was up for election and the council stayed under no overall control.
The 2008 Havant Borough Council election took place on 1 May 2008 to elect members of Havant Borough Council in Hampshire, England. One third of the council was up for election and the Conservative party stayed in overall control of the council.
The 2011 St Helens Metropolitan Borough Council election took place on 5 May 2011 to elect members of St Helens Metropolitan Borough Council in Merseyside, England. One third of the council was up for election and the Labour party stayed in overall control of the council.
The 2008 Swale Borough Council election took place on 1 May 2008 to elect members of Swale Borough Council in Kent, England. One third of the council was up for election and the Conservative party stayed in overall control of the council.