Chelmsford City Council election, 2015

Last updated

Chelmsford City Council election, 2015
Flag of the United Kingdom.svg
  2011 7 May 2015 (2015-05-07)2019 

47 seats
24 seats needed for a majority

  First party Second party Third party
 
Party Conservative Liberal Democrat Labour
Last election 40 15 1
Seats before 40 15 1
Seats won 52 5 0
Seat changeIncrease2.svg 12Decrease2.svg 10Decrease2.svg 1
Popular vote 91,268 35,507 23,042
Percentage 50.8 20.2 12.8
SwingIncrease2.svg0.5Decrease2.svg4.9Decrease2.svg3.9

  Fourth party Fifth party Sixth party
 
Party UKIP Green SWF Independent
Last election 0 0 0
Seats before 0 0 0
Seats won 0 0 0
Seat changeSteady2.svgSteady2.svgSteady2.svg
Popular vote 16,726 6,457 5,469
Percentage 9.4 3.4 2.9
SwingIncrease2.svg8.3Increase2.svg1.5Steady2.svg0.0

  Seventh party
 
Party Independent
Last election 1
Seats before 1
Seats won 0
Seat changeDecrease2.svg 1
Popular vote 398
Percentage 0.4
SwingDecrease2.svg1.7

The 2015 Chelmsford City Council election took place on 7 May 2015 to elect members of Chelmsford City Council in England. [1] This was on the same day as other local elections.

Contents

Ward Results

Bicknacre and East and West Hanningfield

Bicknacre and East and West Hanningfield
PartyCandidateVotes%±
Conservative Matt Flack 1,896 36.9 +0.4
Conservative Richard Poulter 1,884 36.6 +1.3
Labour Anthony Lees 359 7.0 -1.2
Labour Joyce Lees 309 6.0 -1.8
Green Jasmine Lawrence 278 5.4N/A
Liberal Democrat David Frost 234 4.6 -1.6
Liberal Democrat Ian Mascot 181 3.5 -2.5
Turnout 72.0
Conservative hold Swing

Party vote

Party%+/-
Conservative 73.5 +1.7
Labour 13.0 -3.0
Liberal Democrat 8.1 -4.1
Green 5.4 N/A

Boreham and The Leighs

Boreham and The Leighs
PartyCandidateVotes%±
Conservative John Galley 2,343 46.2 +9.4
Conservative Philip Wilson 1,402 27.6 -2.1
Labour Jason Buckley 489 9.6 -0.5
Liberal Democrat Martin Bracken 436 8.6 +1.6
Liberal Democrat Michael Giles 404 8.0 +1.3
Majority
Conservative hold Swing

Party vote

Party%+/-
Conservative 73.8 +7.3
Liberal Democrat 16.6 +2.9
Labour 9.6 -10.2

Broomfield and The Walthams

Broomfield and The Walthams
PartyCandidateVotes%±
Conservative Sandra Pontin 2,095 17.2 +0.3
Conservative Barry Knight 1,994 16.3 +1.2
Conservative James Raven 1,886 15.5 +3.3
UKIP Charles Cole 964 7.9N/A
UKIP Peter Carter 868 7.1N/A
UKIP Andrew Ives 863 7.1N/A
Labour Sandra Sterne 668 5.5 +0.9
Labour Aidan Jones 595 4.9 +0.4
Liberal Democrat Jenifer Goldfinch 511 4.2 -6.2
Liberal Democrat Mike Farn 466 3.8 -2.8
Liberal Democrat Jan Farn 448 3.7 -2.8
Green Reza Hossain 434 3.6 -1.3
Green John Howard 410 3.4N/A
Majority
Turnout
Conservative hold Swing
Conservative gain from Independent Swing

Party vote

Party%+/-
Conservative 49.0 +4.1
UKIP 22.1 N/A
Liberal Democrat 11.7 -11.8
Labour 10.4 -3.0
Green 6.9 +2.0

Chelmer Village and Beaulieu Park

Chelmer Village and Beaulieu Park
PartyCandidateVotes%±
Conservative Ron Alcock 3,134 22.4 -1.5
Conservative Neil Gulliver 2,906 20.7 +2.0
Conservative Duncan Lumley 2,606 18.6 +3.8
UKIP Nigel Carter 929 6.6N/A
Labour Daniel Ebdon 790 5.6 -1.0
Liberal Democrat Martin Ashby 773 5.5 +0.9
Labour Nastassia Player 731 5.2 -1.1
Labour Paul Walentowicz 626 4.5 -1.1
Liberal Democrat Mary Bastick 579 4.1 -0.1
Green Thomas Fleetham 472 3.4N/A
Liberal Democrat Richard Pennicard 459 3.3 -0.6
Majority
Conservative hold Swing

Chelmsford Rural West

Chelmsford Rural West
PartyCandidateVotes%±
Conservative Nicolette Chambers 1,294 78.1 -0.5
Liberal Democrat Paul Chaplin 188 11.3 -0.5
Labour Prudence Jones 175 10.6 +1.0
Majority
Turnout
Conservative hold Swing

Galleywood

Galleywood
PartyCandidateVotes%±
Conservative Janette Potter 1,757 35.3 +1.6
Conservative David Stevenson 1,159 23.3 +6.6
UKIP Simon Norburn 614 12.3N/A
Labour Richard Hyland 599 12.0 +0.1
Liberal Democrat Andy Cook 454 9.1 +1.5
Liberal Democrat Chris Shaw 394 7.9 -0.7
Turnout
Conservative hold Swing

Goat Hall

Goat Hall
PartyCandidateVotes%±
Conservative Anthony McQuiggan 1,261 22.3 +0.9
Liberal Democrat Freda Mountain 1,084 19.2 -5.2
Liberal Democrat Linda Mascot 1,046 18.5 -4.6
Conservative Piers Riley 967 17.1 -2.6
UKIP Eric Johnston 613 10.9N/A
Labour John Leslie 345 6.1 +0.5
Labour Susan Leslie 331 5.9 +0.3
Majority
Turnout
Conservative gain from Liberal Democrat Swing
Liberal Democrat hold Swing

Great Baddow East

Great Baddow East
PartyCandidateVotes%±
Conservative Gillian Smith 1,740 15.1 +2.3
Conservative Liz Ahmed 1,698 14.7 +2.1
Conservative Stephanie Scott 1,596 13.8 +2.5
Liberal Democrat Chris Rycroft 1,385 12.0 -3.0
Liberal Democrat Andrew Sosin 1,259 10.9 -3.7
Liberal Democrat Veronica Sadowsky 1,243 10.8 -3.7
UKIP Ray Hodgkinson 793 6.9 +2.2
UKIP Jesse Pryke 754 6.5N/A
Labour Jack Swan 548 4.8 -0.3
Labour Tony Taylor 518 4.5 -0.2
Turnout
Conservative gain from Liberal Democrat Swing

Great Baddow West

Great Baddow West
PartyCandidateVotes%±
Conservative Jenny Chandler 1,453 27.2 +2.8
Conservative Bob Villa 997 18.7 +1.7
UKIP Jeanette Howes 565 10.6 +3.8
UKIP Steve Bater 544 10.2N/A
Liberal Democrat Jannetta Sosin 537 10.0 -7.1
Liberal Democrat Andrew Robson 524 9.8 -7.3
Labour Ann Monk 482 9.0 +1.1
Green Kathleen Stein 242 4.5N/A
Turnout
Conservative hold Swing

Little Baddow, Danbury and Sandon

Little Baddow, Danbury and Sandon
PartyCandidateVotes%±
Conservative Richard Ambor 2,967 24.1 +2.2
Conservative Ian Wright 2,956 24.0 +2.2
Conservative Bob Shepherd 2,922 23.7 +2.4
UKIP Tim Clayton 977 7.9N/A
Liberal Democrat David Whiteing 551 4.5 +0.8
Green Rory Carlton 529 4.3 -0.9
Labour John Devane 497 4.0 -0.3
Liberal Democrat Lawrence O'Brien 455 3.7N/A
Liberal Democrat Nicola Nunn 453 3.7N/A
Majority
Turnout
Conservative hold Swing

Marconi

Marconi
PartyCandidateVotes%±
Conservative Yvonne Spence 883 16.7 +1.2
Liberal Democrat Judith Deakin 725 13.7 -5.2
Conservative Timothy Worrall 713 13.5 -0.8
Labour William Horslen 703 13.3 -4.7
Labour Sandra Massey 673 12.7 -3.6
Liberal Democrat Graham John 586 11.1 -6.0
UKIP Helen Camblin-Smith 418 7.9 N/A
Green Timothy Leeson 295 5.6 N/A
Independent Anthony O'Donnell 149 2.8 N/A
Liberal Henry Boyle 110 2.1 N/A
Liberal Kyle Townsend 40 0.8 N/A
Majority
Turnout 57.0
Conservative gain from Labour Swing
Liberal Democrat hold Swing

Party Results

Party%+/-
Conservative 30.1 +0.5
Liberal Democrat 24.8 -10.9
Labour 26.0 -8.8
UKIP 7.9 N/A
Green 5.6 N/A
Independent 2.8 N/A
Liberal 2.8 N/A

Moulsham and Central

Moulsham and Central
PartyCandidateVotes%±
Conservative Richard Madden 2,335 18.0 +2.0
Conservative Victoria Camp 2,160 16.7 +1.1
Conservative Sameh Hindi 1,952 15.0 -0.1
Labour Edward Massey 966 7.5 0.0
Liberal Democrat Matt Bellard 909 7.0 -3.7
Liberal Democrat Lois Speller 870 6.7 -4.0
Labour Mark Player 854 6.6 -0.4
Liberal Democrat Matt Klesel 838 6.5 -3.8
Green Antony Lane 779 6.0 N/A
UKIP John Theedom 766 5.9 N/A
Independent Michael Boyd 546 4.2 N/A
Majority
Turnout
Conservative hold Swing

Party Results

Party%+/-
Conservative 49.8 +3.0
Liberal Democrat 20.1 -11.7
Labour 14.0 -7.5
Green 6.0 N/A
UKIP 5.9 N/A
Independent 4.1 N/A

Moulsham Lodge

Moulsham Lodge
PartyCandidateVotes%±
Conservative Simon Cook 1,252 23.6 +3.4
Liberal Democrat Mark Springett 962 18.2 -4.4
Liberal Democrat David Jones 891 16.8 -4.8
Conservative Gilbert Smith 875 16.5 -2.2
UKIP Hilary Stockwell 491 9.3N/A
Labour Max Gibson 313 5.9 -2.9
Labour Angela Medici 307 5.8 -2.3
Green Andrew Abbott 208 3.9N/A
Majority
Turnout
Conservative gain from Liberal Democrat Swing
Liberal Democrat hold Swing

Patching Hall

Patching Hall
PartyCandidateVotes%±
Conservative Jon De Vries 1,754 14.6 +2.3
Liberal Democrat Stephen Robinson 1,580 13.2 -1.7
Conservative Michael Holoway 1,554 12.9 -0.9
Liberal Democrat Christopher Davidson 1,456 12.1 -2.0
Conservative Neil Spooner 1,414 11.8 +0.4
Liberal Democrat David Everest-Ring 1,293 10.8 -2.0
Labour Joan Bliss 862 7.2 +0.4
UKIP Mark Rose 775 6.5N/A
Labour Stuart Hatwell 680 5.7 +0.0
Labour David Howell 642 5.3 +0.2
Majority
Turnout
Conservative gain from Liberal Democrat Swing
Liberal Democrat hold Swing
Conservative gain from Liberal Democrat Swing

Rettendon and Runwell

Rettendon and Runwell
PartyCandidateVotes%±
Majority
Turnout
[[|N/A]] hold Swing
[[|N/A]] gain from [[|N/A]] Swing

South Hanningfield, Stock and Margaretting

South Hanningfield, Stock and Margaretting
PartyCandidateVotes%±
Majority
Turnout
[[|N/A]] hold Swing
[[|N/A]] gain from [[|N/A]] Swing

South Woodham - Chetwood and Collingwood

South Woodham - Chetwood and Collingwood
PartyCandidateVotes%±
Conservative Robert Massey 1,991 22.5 +3.7
Conservative Ashley John 1,811 20.5 +2.1
Conservative Malcolm Sismey 1,640 18.4 +1.0
SWF Independent Jill Winn 885 10.0 +0.8
SWF Independent Lawrence Brennan 881 10.0 +1.4
SWF Independent Roy Hardman 724 8.2 +0.9
Labour Darek Barnett 520 5.9 -3.6
Green David Rey 381 4.3N/A
Majority
Turnout
Conservative hold Swing

South Woodham - Elmwood and Woodville

South Woodham - Elmwood and Woodville
PartyCandidateVotes%±
Conservative Bob Denston 1,841 18.6 +1.4
Conservative Linda Denston 1,734 17.5 +0.7
Conservative Trica Hughes 1,649 16.6 +0.3
SWF Independent Sam Coley 1,115 11.2 -2.2
SWF Independent Ian Roberts 992 10.0 -3.0
SWF Independent Kevin Golding 872 8.8 -3.0
UKIP Janet Jones 868 8.7N/A
Labour Clifford Vanner 448 4.5 +1.2
Labour Margaret Vanner 405 4.1 +1.2
Majority
Turnout
Conservative hold Swing
Conservative gain from SWF Independent Swing
Conservative hold Swing

Springfield North

Springfield North
PartyCandidateVotes%±
Conservative Paul Hutchinson 1,955 17.3 +2.8
Conservative Susan Sullivan 1,590 14.0 +0.8
Conservative Louis Ward 1,385 12.2 -0.3
Liberal Democrat Michael Mackrory 1,340 11.8 -2.3
Liberal Democrat Ian Fuller 1,317 11.6 -2.4
Liberal Democrat Martin Rew 1,068 9.4 -4.5
UKIP David Flower 797 7.0N/A
Labour Evelyn Haigh 659 5.8 -0.2
Labour Karen Kennedy 632 5.6 -0.2
Labour Russell Kennedy 585 5.2 -0.4
Majority
Turnout
Conservative hold Swing
Conservative gain from Liberal Democrat Swing

St. Andrew's

St. Andrew's
PartyCandidateVotes%±
Conservative Peter Cousins 1,556 14.0 +0.9
Conservative Stephen Fowell 1,345 12.1 +0.3
Liberal Democrat Lee Ashley 1,275 11.5 -1.5
Conservative Michael Wetton 1,215 10.9 +0.3
Liberal Democrat John Hunnable 1,175 10.6 -1.8
Liberal Democrat Tom Willis 936 8.4 -2.7
Labour Paul Bishop 856 7.7 -1.7
UKIP Thomas Jones 854 7.7N/A
Labour Linda Findlay 783 7.0 -2.2
Labour John Knott 743 6.7 -2.0
Green Colin Budgey 370 3.3N/A
Majority
Turnout
Conservative hold Swing
Conservative gain from Liberal Democrat Swing
Liberal Democrat hold Swing

The Lawns

The Lawns
PartyCandidateVotes%±
Conservative Christine Garrett 1,459 25.3 +1.3
Conservative Julia Jeapes 1,284 22.2 -1.7
Liberal Democrat Richard Lee 1,101 19.1 -2.0
Liberal Democrat Robin Stevens 1,044 18.1 -1.6
Labour Roger Patterson 328 5.7 -0.1
Labour Steven Haigh 325 5.6 -0.1
Green David Cochrane 237 4.1N/A
Majority
Turnout
Conservative hold Swing

Trinity

Trinity
PartyCandidateVotes%±
Conservative Jean Murray 1,622 28.5 +2.0
Conservative Graham Seeley 1,232 21.6 -3.4
Liberal Democrat Julia Frascona 784 13.8 -3.6
Liberal Democrat Tim Rothwell 714 12.5 -3.2
Labour Elaine Baldwin 547 9.6 +1.6
Labour Jon Legg 477 8.4 -1.1
Green George Malynicz 321 5.6N/A
Majority
Turnout
Conservative hold Swing

Waterhouse Farm

Waterhouse Farm
PartyCandidateVotes%±
Conservative Alan Chambers 1,194 22.7 +2.5
Conservative Malcolm Watson 1,023 19.4 -0.8
Labour Peter Dixon 687 13.0 +1.9
Liberal Democrat Lorraine Cobbold 629 11.9 -7.6
Labour Colin Farquhar 602 11.4 +0.7
UKIP Marion Harvey 597 11.3N/A
Liberal Democrat Ian Gale 539 10.2 -8.1
Majority
Turnout
Conservative hold Swing

Writtle

Writtle
PartyCandidateVotes%±
Majority
Turnout
[[|N/A]] hold Swing
[[|N/A]] gain from [[|N/A]] Swing

Related Research Articles

Chelmsford city in Essex, United Kingdom

Chelmsford is the principal settlement of the City of Chelmsford district, and the county town of Essex, in the East of England. It is located in the London commuter belt, approximately 30 miles (48 km) northeast of the notional centre of London at Charing Cross and approximately 22 miles (35 km) from Colchester. The urban area of the city has a population of approximately 112,000, whilst the district has a population of 168,310.

Simon Burns British politician

Sir Simon Hugh McGuigan Burns is a British politician, who served as Member of Parliament (MP) for Chelmsford since being elected at the 1987 general election until 2017 general election.

Frederic John Napier Thesiger, 1st Viscount Chelmsford, was a British statesman who served as Governor of Queensland from 1905 to 1909, Governor of New South Wales from 1909 to 1913, and Viceroy of India from 1916 to 1921, where he was responsible for the creation of the Montagu-Chelmsford reforms. After serving a short time as First Lord of the Admiralty in the government of Ramsay MacDonald, he was appointed the Agent-General for New South Wales by the government of Jack Lang before his retirement.

City of Chelmsford Place in England

The City of Chelmsford is a local government district in Essex, England. It is named after its main settlement, Chelmsford, which is also the county town of Essex. On 1 June 2012 Chelmsford was granted city status to mark the Diamond Jubilee of Elizabeth II.

Borough of Brentwood Place in England

The Borough of Brentwood is a local government district and borough in Essex in the East of England.

Midlothian (UK Parliament constituency) Parliamentary constituency in the United Kingdom

Midlothian in Scotland is a county constituency of the House of Commons of the Parliament of the United Kingdom. It elects one Member of Parliament (MP) by the first-past-the-post voting system.

Livingston (UK Parliament constituency) Parliamentary constituency in the United Kingdom

Livingston is a county constituency of the House of Commons of the Parliament of the United Kingdom, to which it returns one Member of Parliament (MP). Elections are held using the first-past-the-post voting system.

Ochil and South Perthshire (UK Parliament constituency) Parliamentary constituency in the United Kingdom

Ochil and South Perthshire is a county constituency of the House of Commons of the Parliament of the United Kingdom. It elects one Member of Parliament (MP) by the first past the post system of election.

Linlithgow and East Falkirk (UK Parliament constituency) Parliamentary constituency in the United Kingdom

Linlithgow and East Falkirk is a county constituency of the House of Commons of the Parliament of the United Kingdom, created for use in the 2005 general election. It replaced most of Falkirk East and Linlithgow.

Westminster North (UK Parliament constituency) Parliamentary constituency in the United Kingdom (2010 onwards)

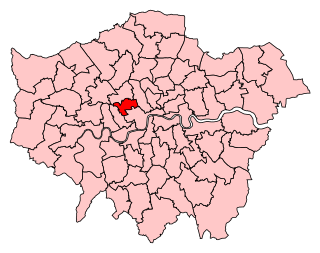
Westminster North is a constituency represented in the House of Commons of the UK Parliament since its 2010 recreation by Karen Buck, a member of the Labour Party. Its previous 1983 to 1997 existence is also covered by this article.

Leeton Shire Local government area in New South Wales, Australia

Leeton Shire is a local government area in the Riverina region of New South Wales, Australia. The Shire is located adjacent to the Murrumbidgee River and falls within the Murrumbidgee Irrigation Area.

Braintree District Council in Essex, England is elected every four years. Since the last boundary changes in 2015, 49 councillors have been elected from 26 wards.

Chelmsford (UK Parliament constituency) Parliamentary constituency in the United Kingdom (2010 onwards)

Chelmsford is a constituency represented in the House of Commons of the UK Parliament since 2017 by Vicky Ford of the Conservative Party.

Chelmsford City Council in Essex, England is elected every four years. Since the last boundary changes in 2003 57 councillors have been elected from 24 wards.

Chelmsford City F.C. association football club

Chelmsford City Football Club is a football club based in the city of Chelmsford, Essex, England. They are currently members of the National League South, the sixth tier of English football, and play at the Melbourne Stadium.

Essex County of England

Essex is a county in the south-east of England, north-east of London. One of the home counties, it borders Suffolk and Cambridgeshire to the north, Hertfordshire to the west, Kent across the estuary of the River Thames to the south, and London to the south-west. The county town is Chelmsford, the only city in the county. For government statistical purposes Essex is placed in the East of England region.

2011 Harlow District Council election

The 2011 Harlow District Council election took place on 5 May 2011 to elect members of Harlow District Council in Essex, England. One third of the council was up for election and the Conservative party stayed in overall control of the council.

2015 Salford City Council election

The 2015 Salford City Council election took place on 7 May 2015 to elect members of Salford City Council in England. This was the same day as other local elections, and the United Kingdom general election, 2015. The last time these seats were contested was in 2011.

Elections to Chelmsford Borough Council were held in 2011 alongside local elections in other parts of the United Kingdom.

New Writtle Street Stadium was a football and short lived greyhound racing stadium located in Chelmsford, Essex.

References

  1. "Upcoming elections & referendums". The Electoral Commission. Archived from the original on 15 March 2015. Retrieved 7 April 2015.