Bedford Borough Council election, 2015

Last updated

The 2015 Bedford Borough Council election took place on 7 May 2015 to elect members of Bedford Borough Council in England. [1] This was on the same day as other local elections.

Bedford Borough Council

Bedford Borough Council is the local authority of the Borough of Bedford in Bedfordshire, England. It is a unitary authority, having the powers of a non-metropolitan county and district council combined. The executive of the council is the directly elected mayor of Bedford. It is a member of the East of England Local Government Association.

Contents

Overall Results

Bedford Local Election Result 2015
PartySeatsGainsLossesNet gain/lossSeats %Votes %Votes+/−
  Conservative 1530+337.539.7345,874+2.8
  Labour 1431+235.027.4831,738-1.35
  Liberal Democrat 903-322.519.3522,342-6.33
  Independent 202-25.01.784346-4.06
  Green 000005.456291+4.27
  UKIP 000004.975742+4.69

A total of 115,477 valid votes were cast and there were 1,060 rejected ballots.
The turnout was 66.3%

A ballot is a device used to cast votes in an election, and may be a piece of paper or a small ball used in secret voting. It was originally a small ball used to record decisions made by voters.

Council Composition

Prior to the election the composition of the council was:

Election process by which a population chooses an individual to hold public office

An election is a formal group decision-making process by which a population chooses an individual to hold public office. Elections have been the usual mechanism by which modern representative democracy has operated since the 17th century. Elections may fill offices in the legislature, sometimes in the executive and judiciary, and for regional and local government. This process is also used in many other private and business organizations, from clubs to voluntary associations and corporations.

A council is a group of people who come together to consult, deliberate, or make decisions. A council may function as a legislature, especially at a town, city or county/shire level, but most legislative bodies at the state or national level are not considered councils. At such levels, there may be no separate executive branch, and the council may effectively represent the entire government. A board of directors might also be denoted as a council. A committee might also be denoted as a council, though a committee is generally a subordinate body composed of members of a larger body, while a council may not be. Because many schools have a student council, the council is the form of governance with which many people are likely to have their first experience as electors or participants.

1212124
ConservativeLabourLiberal
Democrats
Ind

After the election the composition of the council was:

151492
ConservativeLabourLiberal
Democrats
Ind

Ind - Independent

Ward Results

Incumbent councillors are denoted by an asterisk.

Brickhill

Brickhill (2 Seats)
PartyCandidateVotes%±
Liberal Democrat Charles Royden*2,12326.41-6.89
Liberal Democrat Wendy Rider*1,88223.41-5.20
Conservative Olly Richbell1,23115.31+1.65
Conservative Rubina Shaikh89211.09-1.36
Labour Cathrine Ward7759.64+2.75
Labour Robert Frank Atkins7559.39+4.30
Green Sara Frances Browne3824.75N/A
Majority6518.1
Turnout 8,04071.0
Liberal Democrat hold Swing

Bromham and Biddenham

Bromham and Biddenham (2 Seats)
PartyCandidateVotes%±
Conservative Roger Rigby*2,73038.22+1.51
Conservative Jon Gambold*2,39333.51-1.36
Labour Elizabeth Jane Luder6809.52-0.22
Labour Ashley Spencer Firth6388.930.67
Liberal Democrat Stelios Mores4366.11-0.25
Liberal Democrat Stephen John Rutherford2653.71-0.34
Majority1,71323.99
Turnout 7,14266.0
Conservative hold Swing

Castle

Castle (2 Seats)
PartyCandidateVotes%±
Conservative David Stanton Fletcher97816.17+1.68
Labour Luigi Reale85314.10+1.9
Conservative Shish Miah77412.80-0.87
Castle Ward IndependentApu Bagchi*75312.45-6.78
Labour Mashuk Miah Ullah69811.54-0.56
Castle Ward IndependentCaroline Sara Fensome67811.21N/A
Green Lucy Clare Bywater5398.91+4.34
Green Ben Foley3906.45+4.22
Liberal Democrat Muhmud Henry Rogers1812.99-2.08
Liberal Democrat Richard Rashid Rogers1402.32+1.79
Independent Ameer Shajahan Mohammed641.06N/A
Majority791.30
Turnout 6,04860.0
Conservative hold Swing
Labour gain from Independent Swing

Cauldwell

Cauldwell (2 Seats)
PartyCandidateVotes%±
Labour Randolph Charles*1,76230.93+4.15
Labour Sue Oliver*1,55927.37+0.34
Conservative Darren Jason Russell67011.76+0.39
Conservative Nurul Islam59010.36+0.06
UKIP Janet Culley4778.37N/A
Green Esin Esat2284.0N/A
Liberal Democrat Jake Sale2163.79-9.56
Liberal Democrat Mohammad Sabir Rahman1532.68-8.49
Independent Aleksandr Zabolotnov420.74N/A
Majority88915.61
Turnout 5,69752.0
Labour hold Swing
Labour hold Swing

Clapham

Clapham
PartyCandidateVotes%±
Conservative Jane Anne Walker*1,14049.5-9.78
Labour Jenni Jackson51122.19-8.76
UKIP Peter Lund-Conlon42018.24N/A
Green Sarah Mingay1245.8N/A
Liberal Democrat John Robert Ryan1084.69-5.08
Majority62927.31
Turnout 2,30367.0
Conservative hold Swing

De Parys

De Parys (2 Seats)
PartyCandidateVotes%±
Liberal Democrat Henry Paul Vann*1,04017.76-1.95
Liberal Democrat David Alexander Sawyer*1,00717.2-7.51
Conservative Adrian Alexander Lennox-Lamb94816.19-1.36
Conservative Robin Calverey Illingworth93716.00-1.69
Labour Monika Golebiewska5739.79+0.65
Labour Louise Whatham5098.70-0.21
UKIP John Lathaen3425.84N/A
Green Alex Charlton2243.83+0.95
Green Alex Willmott1763.00N/A
Independent John Lloyd991.69N/A
Majority591.01
Turnout 5,85564.0
Liberal Democrat hold Swing

Eastcotts

Eastcotts
PartyCandidateVotes%±
Liberal Democrat Sarah Holland*80447.66-16.66
Conservative Michael Peter Abbott53931.95+11.49
Labour James Alexander Grady34420.39+5.17
Majority26515.71
Turnout 1,68762.0
Liberal Democrat hold Swing

Elston & Stewartby

Elston & Stewartby
PartyCandidateVotes%±
Liberal Democrat Tim Hill*94146.61+8.45
Conservative Margaret Jean Turner56527.98-5.07
Labour Susan Ann Hoskin35517.58+4.25
Independent Tony Hare1587.83-7.63
Majority37618.63
Turnout 2,01964.0
Liberal Democrat hold Swing

Goldington

Goldington
PartyCandidateVotes%±
Labour Anthony James Forth1,29119.99+4.7
Labour Jade Chelsea Uko96114.88+0.53
Conservative Phillippa Anne Martin-Moran94514.63+1.26
Liberal Democrat Lorna Rose Marchant94214.59-9.08
Liberal Democrat Richard Jefferies Harrison87413.53-8.59
UKIP Adrian John Haynes66310.27N/A
Conservative Zulika Maria Wightman5648.73-2.47
Green Brant Carl Tilds2183.38N/A
Majority160.25
Turnout 6,45860.0
Labour gain from Liberal Democrat Swing

Great Barford

Great Barford (2 Seats)
PartyCandidateVotes%±
Conservative Stephen Hellier Moon*2,61537.31+3.97
Conservative Sheryl Lesley Maxwell Corp2,24231.99-3.98
Liberal Democrat Stephen James Lawson78511.20+3.67
Green Mark Bowler73210.45N/A
Liberal Democrat Paul Stekelis6349.05+2.11
Majority1,45720.79
Turnout 7,00872.0
Conservative hold Swing

Harpur

Harpur (2 Seats)
PartyCandidateVotes%±
Labour Colleen Atkins*1,79331.01-0.61
Labour Louise King*1,31622.76+0.05
Conservative Andrea Clare Spice77513.40-2.57
Conservative Sanjit Kaur Gill Chowdrey5419.36-3.99
UKIP Derek John Few3235.59N/A
Independent David John Allen2724.70N/A
Liberal Democrat Paul Martin Whitehead2243.870.27
Green Jen Foley2103.63-0.61
Liberal Democrat Ripal Pranesh Patel1753.03-1.72
Green Racheall Monton1532.65-1.10
Majority5419.36
Turnout 5,78251.0
Labour hold Swing
Labour hold Swing

Harrold

Harrold
PartyCandidateVotes%±
Conservative Alison Jane Foster1,76274.60+27.77
Green Gary Nicholas Lloyd37715.96N/A
Liberal Democrat Joy Rose Winder2239.44-34.75
Majority1,38558.64
Turnout 2,36275.0
Conservative hold Swing

Kempton Central and East

Kempton Central and East (2 Seats)
PartyCandidateVotes%±
Conservative Anthony Frank John Boutall1,21021.95+2.85
Labour Mohammed Nawaz*1,03418.76-2.60
Labour James Emmanuel Valentine*1,02818.65-5.16
Conservative Kuldip Singh76913.95+4.14
UKIP Nicky Attenborough76413.86N/A
Green Richard James Baker3045.52N/A
Liberal Democrat Terry Gasson2454.440.45
Liberal Democrat Bipin Shah1582.87-0.86
Majority60.11
Turnout 5,51261.0
Conservative gain from Labour Swing
Labour hold Swing

Kempton North

Kempton North
PartyCandidateVotes%±
Labour Shan Hunt*87047.08+9.71
Conservative Matt McCarthy81043.83+7.51
Green Alex Sebastian Jones1206.49N/A
Liberal Democrat Mamun Islam482.60-4.28
Majority603.25
Turnout 1,84864.0
Labour hold Swing

Kempston Rural

Kempston Rural
PartyCandidateVotes%±
Conservative Mark William Smith*2,07470.14+12.64
Labour Shah Shanoor Miah54018.26+1.0
Liberal Democrat Conrad Holden Longmore34311.60-4.14
Majority1,63451.88
Turnout 2,95769.0
Conservative hold Swing

Kempston South

Kempston South
PartyCandidateVotes%±
Labour Carl Rex Meader1,47169.29-6.34
Conservative Sarah King McGee54525.67+5.74
Green Tim Crowhurst542.54N/A
Liberal Democrat Philip Downing Standley532.50-1.94
Majority92643.62
Turnout 2,12367.0
Labour hold Swing

Kempston West

Kempston West
PartyCandidateVotes%±
Labour Will Hunt95642.58-11.21
Conservative Ryan Darren Michael Gray74633.23-7.55
UKIP Peter Hull33214.79N/A
Green Rosemary Josephine Elizabeth Wright1124.99N/A
Liberal Democrat Simon Paul Hart994.41-1.02
Majority2109.35
Turnout 2,24561.0
Labour hold Swing

Kingsbrook

Kingsbrook
PartyCandidateVotes%±
Labour James Saunders*1,46125.032.73
Liberal Democrat Anita Joan Gerard*92315.81-5.71
Labour Abu Sultan84814.53-2.59
Liberal Democrat Becky Guynn75112.86-8.17
UKIP Chris Billington60310.33N/A
Conservative Martine Moon5549.49-0.79
Conservative Shekh Sayed4567.81+0.06
Green Lynn Herron2424.14N/A
Majority751.28
Turnout 5,83855.0
Labour hold Swing
Liberal Democrat hold Swing

Newnham

Newnham
PartyCandidateVotes%±
Conservative John Kenneth Samuel Mingay*1,51621.06+0.64
Conservative Giovanni Carofano1,14315.88-2.52
Labour Margaret Ann Badley97613.56+2.13
Labour June Aileen McDonald74910.41+0.75
Liberal Democrat Gordon Willey6669.25-6.28
Liberal Democrat Dean Gary Crofts6489.00-3.94
UKIP John Norman Robertson3825.31N/A
UKIP Domenico Canzoneri36150.2N/A
Green Janice Mary Jones3284.56-0.92
Independent Saverio Bongo2283.17N/A
Green George Lewis Murphy2002.78N/A
Majority1672.32
Turnout 7,19769.0
Conservative hold Swing

Oakley

Oakley
PartyCandidateVotes%±
Independent Patricia Margaret Olney95541.20-42.86
Conservative Ade Clewlow91439.43N/A
UKIP Sebastian Sharpe1717.38N/A
Labour Anne Saunders1526.56-2.64
Liberal Democrat Daniel Millington Norton843.62-3.11
Green David Peter Mingay421.81N/A
Majority411.77
Turnout 2,31878.0
Independent hold Swing

Putnoe (2 Seats)

Putnoe (2 Seats)
PartyCandidateVotes%±
Liberal Democrat Michael Paul Headley*2,01426.71-5.65
Liberal Democrat Rosemary Jean Bootiman1,57820.93-4.45
Conservative Peter Anthony Allen1,44719.19+7.57
Conservative Susan Mary Spratt1,10514.65-0.72
Labour Ceciliah Chigwada5887.80-0.04
Labour Graham John Tranquada5337.07-0.37
Green Rosie Layton2753.65N/A
Majority4365.78
Turnout 7,54074.0
Liberal Democrat hold Swing

Queens Park

Queens Park (2 Seats)
PartyCandidateVotes%±
Labour Mohammed Yasin*2,06230.42+1.76
Labour Mohammed Masud*1,94728.72+1.82
Conservative Balal Shah1,26218.61-2.44
Conservative Muzakkir Hussain Khan96514.24-0.57
Green Hannah Mary Jones2974.38N/A
Liberal Democrat Dorothea Manar Rogers1382.04+0.47
Liberal Democrat Richard William Struck1081.59-0.21
Majority1151.70
Turnout 6,77965.0
Labour hold Swing
Labour hold Swing

Riseley

Riseley
PartyCandidateVotes%±
Conservative Martin Edward James Towler1,20657.95+31.19
UKIP James Timkey34416.53N/A
Labour John Gerard Dawson23511.29+4.13
Independent Eileen Brenda Whitmore1547.40N/A
Liberal Democrat Patrick Solomon1426.83+4.00
Majority86241.42
Turnout 2,08176.0
Conservative gain from Independent Swing

Sharnbrook

Sharnbrook
PartyCandidateVotes%±
Independent Doug McMurdo*1,04242.53-16.63
Conservative Robert Peter Tickle88636.16+7.57
Labour Susan Jane Caroline Aykin26610.86+1.97
Green Elisabeth Magda Evershed1586.45N/A
Liberal Democrat Janet Elizabeth Trengrove984.00+0.65
Majority1566.37
Turnout 2,45076.0
Independent hold Swing

Wilshamstead

Wilshamstead
PartyCandidateVotes%±
Conservative Graeme Stuart Coombes*1,69872.78+8.68
Labour Akm Masum38316.42-2.58
Liberal Democrat Steve Mason25210.80-6.10
Majority1,31556.36
Turnout 2,33368.0
Conservative hold Swing

Wootton

Wootton
PartyCandidateVotes%±
Conservative John Stephen Wheeler1,11942.91+4.47
UKIP Bill Hall56021.47+8.32
Liberal Democrat Gareth Trevor Lloyd52520.13-18.31
Labour Ali Askor26610.20-0.27
Green Carlos Linnett1385.29N/A
Majority55921.44
Turnout 2,60871.0
Conservative gain from Liberal Democrat Swing

Wyboston

Wyboston
PartyCandidateVotes%±
Conservative Tom Wootton*1,61873.48+2.95
Liberal Democrat Martin Joseph Kavanagh31614.35+1.18
Green Lisa Bradbury26812.17N/A
Majority1,30259.13
Turnout 2,20273.0
Conservative hold Swing

Related Research Articles

Borough of Bedford Unitary Authority & Borough in England

Bedford is a unitary authority area with borough status in the ceremonial county of Bedfordshire, England. Its council is based at Bedford, the county town of Bedfordshire. The borough contains one large urban area, the 71st largest in the United Kingdom that comprises Bedford and the adjacent town of Kempston, surrounded by a rural area with many villages. 75% of the borough's population live in the Bedford Urban Area and the five large villages which surround it, which makes up slightly less than 6% of the total land area of the Borough.

Bedford (UK Parliament constituency) Parliamentary constituency in the United Kingdom, 1997 onwards

Bedford is a constituency represented in the House of Commons of the UK Parliament since the 2017 general election by Mohammad Yasin of the Labour Party. The seat dates to the earliest century of regular parliaments, in 1295; its double representation was halved in 1885, then being altered by the later-termed Third Reform Act in 1918.

Croydon London Borough Council elections

Elections for the Council in the London Borough of Croydon are held every four years to elect 70 councillors. At the last elections, which were held in May 2014, 30 Conservative councillors and 40 Labour councillors, providing a Labour majority of ten seats.

Bedford is a unitary authority in Bedfordshire, England. Until 1 April 2009 it was a non-metropolitan district. Since 2002 it has also had a directly elected mayor.

The 1998 Bedford Borough Council election took place on 7 May 1998 to elect members of Bedford Borough Council in Bedfordshire, England. One third of the council was up for election and the council stayed under no overall control.

Swindon is a unitary authority in Wiltshire, England. Until 1 April 1998 its area was a non-metropolitan district called Thamesdown Borough Council, with Wiltshire County Council providing the county-level services. In 1998 all such powers were transferred to the new Borough of Swindon.

Mayor of Bedford

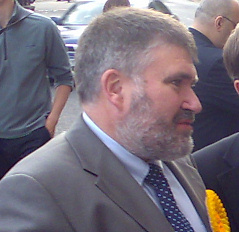
The Mayor of Bedford is a directly elected mayor responsible for the executive function, and ceremonial duty of Bedford Borough Council in Bedfordshire. The incumbent is Dave Hodgson of the Liberal Democrats.

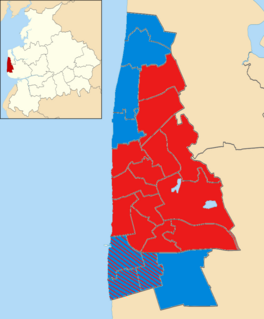
The 2011 Bedford Borough Council election took place on 9 May 2011 to elect members of Bedford Borough Council in Bedfordshire, England. All 40 seats of the council were up for election and the council stayed under no overall control.

2015 Bolton Metropolitan Borough Council election

The 2015 Bolton Metropolitan Borough Council election were held on 7 May 2015 to elect members of Bolton Metropolitan Borough Council in Greater Manchester, England. This took place on the same day as other local elections

The 2015 Bury Metropolitan Borough Council took place on 7 May 2015 to elect members of the Metropolitan Borough of Bury in England. This was on the same day as other local elections.

2015 Oldham Metropolitan Borough Council election

The 2015 Oldham Metropolitan Borough Council election took place on 7 May 2015 to elect members of Oldham Metropolitan Borough Council in England. The election took place on the same day as the UK General Election. One third of the Council was up for election and Labour retained control of the Council.

2015 Blackpool Borough Council election

The 2015 Blackpool Borough Council election took place on 7 May 2015 to elect members of Blackpool Borough Council in England. All 21 wards of 2 seats each on the council were contested with newly elected members next due to serve a four-year term and next contest their seats in 2019. The council is made up oThis election took place on the same day as other local elections as well as the 2015 UK General Election.

2015 Hyndburn Borough Council election

A by-thirds Hyndburn Borough Council local election took place on 7 May 2015. Approximately one third of the second tier council's 35 seats fell up for election, and the General Election was held on the same day.

Elections to Burnley Borough Council in Lancashire, England were held on 7 May 2015, as part of the wider United Kingdom local elections, 2015.

The 2015 Colchester Borough Council election took place on 7 May 2015 to elect one third of the members of Colchester Borough Council in England. This was the same day as other local elections and as the General Election. Colchester Borough Council is made up of 60 councillors: 20 councillors were up for election.

2015 Thanet District Council election

Elections to elect all members (councillors) of Thanet District Council were held on 7 May 2015, as part of the United Kingdom local elections, 2015 taking place simultaneously with the 2015 General Election. Local UK Independence Party candidates won the council, becoming the governing group, the first time UKIP had won control of any type of local government unit above the level of a civil parish council, whether London Borough, Metropolitan Borough, Unitary Authority, Non-Metropolitan Borough or a District Council. The District has as its main towns the beach resort towns of Ramsgate, Margate and Broadstairs.

The 2016 Knowsley Metropolitan Borough Council election took place on 5 May 2016 to elect members of the Knowsley Metropolitan Borough Council in England. Following a boundary review, the number of seats was reduced from 63 to 45, with all of these new seats being up for election at the same time. This was held on the same day as other local elections.

2016 Wirral Metropolitan Borough Council election

The 2016 Wirral Metropolitan Borough Council election took place on 5 May 2016 to elect members of Wirral Metropolitan Borough Council in England. This election was held on the same day as other local elections.

The 2019 Bedford Borough Council election is due to take place on 2 May 2019 to elect members of Bedford Borough Council in England.

References

  1. "Upcoming elections & referendums". The Electoral Commission. Archived from the original on 15 March 2015. Retrieved 26 March 2015.