Central Bedfordshire Council election, 2009

Last updated

Central Bedfordshire Council Elections, 2009
4 June 2009 2011  

Whole Council

  First party Second party Third party
 
Party Conservative Liberal Democrat Independent
Seats won 54, 81.8% 11, 16.7% 1, 1.5%
Popular vote 88,524 49,583 6,901
Percentage 51.67% 28.94% 4.03%

Elected Largest Party


Conservative

Elections to Central Bedfordshire Council were held on 4 June 2009. This was the first elections to the newly formed council, with all 66 seats being up for election. All Councillors elected would serve a two year term, expiring in 2011, when ward boundaries would be reviewed. The Conservative Party won overall control of the council, managing to win 54 of 66 seats on the council.

Central Bedfordshire Council

Central Bedfordshire Council is the unitary authority for Central Bedfordshire in the ceremonial county of Bedfordshire, England.

Contents

Result

Central Bedfordshire Council Election Result 2009
PartySeatsGainsLossesNet gain/lossSeats %Votes %Votes+/−
  Conservative 54 54 0 +54 81.82 51.67 88,524N/A
  Liberal Democrat 11 11 0 +11 16.67 28.94 49,583N/A
  Independent 1 1 0 +1 1.51 4.03 6,901N/A
  Labour 0 0 0 0 0.0 12.05 20,637N/A
  Green 0 0 0 0 0.0 1.52 2,612N/A
  BNP 0 0 0 0 0.0 1.29 2,215N/A
  UK First 0 0 0 0 0.0 0.50 856N/A

The overall turnout was 40.59% with a total of 171,328 valid votes cast.

Council Composition

After the election, the composition of the council was:

54111
ConservativeLib DemI

I - Independent

Ward Results

Ampthill

Ampthill (2 seats) [1]
PartyCandidateVotes%±
Liberal Democrat Gary Summerfield97119.39
Conservative Paul Alan Duckett85517.07
Independent Mark Andrew Smith 840 16.77
Conservative Mrs C M E Gibson 633 12.64
Independent Ghislain Pascal 548 10.94
Liberal Democrat Michael John Cottier 418 8.35
Independent Chris Hayes 417 8.33
Independent John Bingham 177 3.53
Labour David Edwin Hogan 76 1.52
Labour Mark Richard Cant 73 1.46
Majority 15 0.30
Turnout 5,008 48.8
Liberal Democrat win (new seat)
Conservative win (new seat)

Barton

Barton (2 Seats) [2]
PartyCandidateVotes%±
Liberal Democrat Tony Northwood1,30227.31
Liberal Democrat Janet Nunn1,26826.60
Conservative Martin Hawkins 1,000 20.98
Conservative Frederick James Wilson 898 18.84
Labour Terri Miller 157 3.29
Labour Christopher Atkinson 142 2.98
Majority 268 5.62
Turnout 4,767 44.20
Liberal Democrat win (new seat)

Biggleswade

Biggleswade (4 seats) [3]
PartyCandidateVotes%±
Conservative Peter Frank Vickers2,15713.84
Conservative Maurice R Jones2,09113.42
Conservative David John Lawrence1,98912.76
Conservative Jane G Lawrence1,93012.38
Liberal Democrat Gregory Burke 1,060 6.80
Labour Bernard Victor Briars 963 6.18
Labour Rex Skinner 951 6.10
Liberal Democrat Neil Cliff 850 5.45
Labour Sheila Margaret Grayston 808 5.18
Liberal Democrat Dante Virgil Conning 726 4.66
Labour Allister James Dennis 714 4.58
BNP Kevin Austin 709 4.55
Liberal Democrat Chris Leslie 639 4.10
Majority 870 5.58
Turnout 15,587 37.60
Conservative win (new seat)

Cranfield

Cranfield (2 seats) [4]
PartyCandidateVotes%±
Conservative Kenneth Charles Matthews85830.41
Conservative Alan Richard Bastable85730.38
Liberal Democrat Sheila Booth 354 12.55
Liberal Democrat Malcolm Sinclair 305 10.81
Labour Laurence Alexander Pollock 229 8.12
Labour Alan Joseph Morris 218 7.73
Majority 503 17.83
Turnout 2,821 34.80
Conservative win (new seat)

Dunstable Downs

Dunstable Downs (4 seats) [5]
PartyCandidateVotes%±
Conservative Tony Green2,01114.23
Conservative Nigel Young1,85513.12
Conservative Paul Darryl Freeman1,82812.93
Conservative Carole Hegley1,66411.77
UK First Peter Arthur Cole 856 6.06
Labour Wendy Anne Bater 855 6.05
Liberal Democrat David William Larkman 799 5.65
Liberal Democrat Lesley Elizabeth Gates 775 5.48
Liberal Democrat Sally Frances Pointer 746 5.28
Liberal Democrat Ian Witherick 692 4.89
Labour Joy Amelia Shaw 557 3.94
Labour David King 556 3.93
Labour James Kenneth O’Neill 520 3.68
BNP Derek Esau Godfrey 423 2.99
Majority 808 5.71
Turnout 14,137 36.30
Conservative win (new seat)

Flitwick East

Flitwick East (2 seats) [6]
PartyCandidateVotes%±
Conservative James Gerald Jamieson1,21323.31
Conservative Andrew Michael Turner1,14021.91
Green Gareth Ellis 685 13.17
Liberal Democrat Stephen Mitchell 641 12.32
Green Chris Fryer 496 9.53
Liberal Democrat Les Thompson 475 9.13
Independent Andy Ausden 320 6.15
Labour Sheila Gardner 125 2.40
Labour Stephen John Hunt 108 2.08
Majority 455 8.74
Turnout 5,203 44.70
Conservative win (new seat)

Flitwick West

Flitwick West (2 seats) [7]
PartyCandidateVotes%±
Conservative Dennis Gale1,36530.12
Conservative Steve Male1,36130.03
Liberal Democrat Louise Watton 760 16.77
Liberal Democrat Richard Kennedy 698 15.40
Labour Peter Joyce 197 4.35
Labour Iain Stuart Matuaru 151 3.33
Majority 601 13.26
Turnout 4,532 42.50
Conservative win (new seat)

Grovebury

Grovebury (2 seats) [8]
PartyCandidateVotes%±
Conservative Raymond D Berry1,05228.04
Conservative Adam Fahn1,02827.41
Liberal Democrat Hugo Friffin-Jorgensen 504 13.44
Liberal Democrat Peter Aidan McMorrow 444 11.84
Labour Jenny Bone 398 10.61
Labour Chris Northedge 325 8.66
Majority 524 13.97
Turnout 3,751 30.40
Conservative win (new seat)

Houghton Regis

Houghton Regis (4 seats) [9]
PartyCandidateVotes%±
Liberal Democrat Susan Goodchild1,87716.11
Liberal Democrat Rita Egan1,65014.16
Liberal Democrat David John Jones1,62813.97
Liberal Democrat Peter Williams1,55313.32
Conservative John Anthony Chatterley 998 8.56
Conservative Claire Elizabeth Meakins-Jell 799 6.86
Conservative Peter Frederick Swaisland 746 6.40
BNP Steven Bridgeman 735 6.31
Labour Robert James Roche 482 4.14
Labour Ruth Harris-Small 463 3.97
Labour Roger Harold Turner 444 3.81
Conservative Beryl Mary Meakins 279 2.39
Majority 555 4.76
Turnout 11,654 31.40
Liberal Democrat win (new seat)

Icknield

Icknield (2 seats) [10]
PartyCandidateVotes%±
Conservative David John McVicar1,04630.35
Conservative John Robert Kane91326.50
Liberal Democrat Peter Frances Hatswell 487 14.13
Liberal Democrat Alan David Winter 405 11.75
Labour Catherine Howes 299 8.68
Labour Michelle Jayne Henderson 296 8.59
Majority 426 12.37
Turnout 3,446 36.60
Conservative win (new seat)

Langford & Henlow Village

Langford & Henlow Village (2 seats) [11]
PartyCandidateVotes%±
Conservative Tony A Rogers1,78333.47
Conservative Jon A E Clarke1,68131.56
Liberal Democrat Tim Troon 722 13.55
Liberal Democrat Trevor Barnes 589 11.06
Labour David Charles Devereux 295 5.54
Labour Ann Brown 257 4.82
Majority 959 18.01
Turnout 5,327 44.10
Conservative win (new seat)

Leighton Linslade Central

Leighton Linslade Central (4 seats) [12]
PartyCandidateVotes%±
Conservative Kenneth Sharer1,76912.94
Conservative Brian J Spurr1,75212.81
Conservative Roy W Johnstone1,74712.78
Conservative David Bowater1,72812.64
Liberal Democrat Mark Freeman 1,328 9.71
Liberal Democrat Russ Goodchild 1,165 8.52
Liberal Democrat Anne Jennifer Guess 1,145 8.37
Liberal Democrat Stephen Henry Martin Owen 1,039 7.60
Labour Sara Monissa Harris 517 3.78
Labour Joan Rampley 513 3.75
Labour John Stephen Bone 505 3.69
Labour Maurice Rampley 466 3.41
Majority 400 2.93
Turnout 13,674 33.90
Conservative win (new seat)

Marston

Marston (2 seats) [13]
PartyCandidateVotes%±
Conservative Roger A Baker70624.87
Conservative Mike Gibson60121.17
Independent Iain Clapman 553 19.48
Liberal Democrat Ian J Booth 486 17.12
Liberal Democrat Jo Sinclair 247 8.70
Labour Roy Arden 130 4.58
Labour Sean Patrick Walter Carolan 116 4.08
Majority 48 3.70
Turnout 2,839 36.50
Conservative win (new seat)

Maulden & Houghton Conquest

Maulden & Houghton Conquest (2 seats) [14]
PartyCandidateVotes%±
Conservative Angela Barker1,43027.59
Conservative Howard J Lockey1,39026.81
Liberal Democrat Roger Baines 907 17.50
Liberal Democrat Tracy Wilbur 853 16.45
Green Saqhib Ijthehad Ali 341 6.58
Labour George Henry Legate 135 2.60
Labour Peter Reginald Wicks 128 2.47
Majority 483 9.31
Turnout 5,184 48.80
Conservative win (new seat)

Northfields

Northfields (2 seats) [15]
PartyCandidateVotes%±
Independent Julian David Murray75520.82
Conservative Jeannette Freeman61817.04
Conservative Nigel Austin Warren 511 14.09
Labour Duncan Ross 480 13.23
Labour Michael Joseph Hearty 413 11.39
BNP Shelley Rose 348 9.59
Liberal Democrat Rod Keyes 258 7.11
Liberal Democrat Elaine Ann Morgan 244 6.73
Majority 107 2.95
Turnout 3,627 40.30
Independent win (new seat)
Conservative win (new seat)

Northill & Blunham

Northill & Blunham (2 seats) [16]
PartyCandidateVotes%±
Conservative Caroline Maudlin2,01336.57
Conservative Patricia E Turner1,82333.11
Liberal Democrat James Blackburn 674 12.24
Liberal Democrat Gail Davis 645 11.72
Labour Hilary Janet Broderick 180 3.27
Labour Peter Charles Doland 170 3.09
Majority 1,149 20.87
Turnout 5,505 44.10
Conservative win (new seat)

Plantation

Plantation (2 seats) [17]
PartyCandidateVotes%±
Conservative Peter R Rawcliffe1,29032.17
Conservative Alan J Shadbolt1,20430.03
Liberal Democrat Anne Elizabeth Gray 519 12.94
Liberal Democrat Rosalind Mennie 458 11.42
Labour Maurice Blackman 279 6.96
Labour Gerry Sandison 260 6.48
Majority 685 17.09
Turnout 4,010 35.70
Conservative win (new seat)

Potton

Potton (2 seats) [18]
PartyCandidateVotes%±
Conservative Anita Lewis1,23228.95
Conservative Doreen B Gurney1,15627.16
Independent Richard Gilbert Baker 731 17.17
Liberal Democrat Patrick Jones 631 14.83
Labour Rose Forbes 298 7.00
Labour Dennis James 208 4.89
Majority 425 9.99
Turnout 4,256 41.60
Conservative win (new seat)

Sandy

Sandy (2 seats) [19]
PartyCandidateVotes%±
Liberal Democrat Peter Blaine1,38326.74
Liberal Democrat Nigel Aldis1,20923.38
Green Ken Lynch 748 14.46
Conservative Dawn Michele McNeil 689 13.32
Conservative Steven Watkins 619 11.97
Green Kate Layden 266 5.14
Labour Cheryl Ann McDonald 135 2.61
Labour David Ian Hadley 123 2.38
Majority 461 8.92
Turnout 5,172 40.40
Liberal Democrat win (new seat)

Shefford

Shefford (2 seats) [20]
PartyCandidateVotes%±
Conservative Lewis Birt1,30928.66
Conservative Tony Brown1,23427.01
Liberal Democrat Paul Francis John Mackin 881 19.29
Liberal Democrat John Henry Goode 650 14.23
Labour Carolyn Devereux 286 6.26
Labour Nigel Ian Rushby 208 4.55
Majority 353 7.72
Turnout 4,568 41.40
Conservative win (new seat)

Silsoe and Shillington

Silsoe and Shillington (2 seats) [21]
PartyCandidateVotes%±
Conservative Rita Jane Drinkwater1,50328.91
Liberal Democrat Alison M W Graham1,22623.58
Conservative Kathy Keen 1,163 22.37
Liberal Democrat Myles Collett Greenhalgh 1,089 20.95
Labour Paul Bouch 138 2.65
Labour Anthony Kent 80 1.54
Majority 63 1.21
Turnout 5,199 46.30
Conservative win (new seat)
Liberal Democrat win (new seat)

South East Bedfordshire

South East Bedfordshire (2 seat) [22]
PartyCandidateVotes%±
Conservative Richard Stay1,72035.11
Conservative Ruth B Gammons1,55131.66
Liberal Democrat Stephen Goss 582 11.88
Liberal Democrat Adrees Latif 542 11.06
Labour Alyson Jane Read 292 5.96
Labour John George Smith 212 4.33
Majority 969 19.78
Turnout 4,899 43.40
Conservative win (new seat)

South West Bedfordshire

South West Bedfordshire (2 seats) [23]
PartyCandidateVotes%±
Conservative Ken James1,74439.97
Conservative Marion Mustoe1,70539.08
Liberal Democrat Jack Goodchild 499 11.44
Labour Roger Charles Croft 222 5.09
Labour Bill Amos 193 4.42
Majority 1,206 27.64
Turnout 4,363 44.90
Conservative win (new seat)

Southcott

Southcott (2 seats) [24]
PartyCandidateVotes%±
Conservative David John Hopkin98624.71
Liberal Democrat Peter J Snelling85821.50
Conservative George Edward Albert Rolfe 829 20.78
Liberal Democrat Mark Oliver Nathan Fried 591 14.81
Green Ken Barry 417 10.45
Labour Peter William Palfrey 189 4.74
Labour John Sydney Kenneth Raymond 120 3.01
Majority 29 0.72
Turnout 3,990 40.90
Conservative win (new seat)
Liberal Democrat win (new seat)

Stotfold and Arlesey

Stotfold and Arlesey (4 seats) [25]
PartyCandidateVotes%±
Conservative John A G Saunders2,13915.03
Conservative John Street2,13114.97
Conservative Christina Turner1,98113.92
Conservative Ian Dalgarno1,93113.57
Independent Hugh Harper 1,073 7.54
Liberal Democrat Alan Reginald Cooper 958 6.73
Independent Vic Williams 915 6.43
Liberal Democrat Pam Manfield 802 5.63
Liberal Democrat Larry Stoter 743 5.22
Labour Sandra May Lunn 432 3.03
Labour Douglas A Landman 422 2.96
Labour Lorraine Jean Warwick 394 2.77
Labour Mike Smith 313 2.20
Majority 858 6.03
Turnout 14,234 38.10
Conservative win (new seat)

Toddington

Toddington (2 seats) [26]
PartyCandidateVotes%±
Conservative Tom Nicols1,18828.35
Conservative Norman B Costin1,13927.18
Independent Ian Leslie Shingler 677 16.15
Independent John Walter Gilbey 448 10.69
Liberal Democrat Ray Ross Morgan 223 5.32
Liberal Democrat Tony Swain 203 4.84
Labour Rodney Evan Richard Evans 166 3.96
Labour Marshall Miller 147 3.51
Majority 462 11.03
Turnout 4,191 44.60
Conservative win (new seat)

Watling

Watling (2 seats) [27]
PartyCandidateVotes%±
Conservative Peter N Hollick1,26732.65
Conservative Ann J Sparrow1,26532.60
Liberal Democrat Susan Christine Thorne 454 11.70
Liberal Democrat Lynda Margaret Walmsley 353 9.10
Labour Raymond Ian Harris 285 7.35
Labour Michael Andrew Rogers 256 6.60
Majority 811 20.90
Turnout 3,880 38.20
Conservative win (new seat)

Woburn & Harlington

Woburn & Harlington (2 seats) [28]
PartyCandidateVotes%±
Conservative Fiona Chapman1,74327.24
Conservative Budge Wells1,68826.39
Liberal Democrat Brian James Golby 1,332 20.82
Liberal Democrat Robert John Hallam 1,068 16.69
Labour Rachel Joy Elizabeth Garnham 304 4.75
Labour Susan Marie Morris 263 4.11
Majority 356 5.57
Turnout 6,398 46.10
Conservative win (new seat)

Related Research Articles

Mid Bedfordshire District former English non-metropolitan district in the county of Bedfordshire, abolished in 2009

Mid Bedfordshire was, from 1974 to 2009, a local government district in Bedfordshire, England.

South West Bedfordshire (UK Parliament constituency) Parliamentary constituency in the United Kingdom

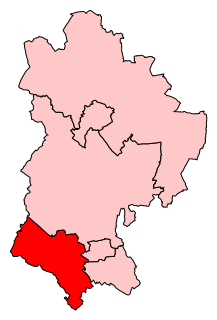
South West Bedfordshire is a constituency represented in the House of Commons of the UK Parliament. As with all constituencies of the UK Parliament, it elects one Member of Parliament by the first past the post system of election.

Mid Bedfordshire (UK Parliament constituency) Parliamentary constituency in the United Kingdom

Mid Bedfordshire is a constituency represented in the House of Commons of the UK Parliament since 2005 by Nadine Dorries, of the Conservative Party. Apart from four early years, the constituency has returned a Conservative since its creation in 1918.

Luton North (UK Parliament constituency) Parliamentary constituency in the United Kingdom

Luton North is a constituency represented in the House of Commons of the UK Parliament since 1997 by Kelvin Hopkins, elected as a member of the Labour Party. In November 2017, Hopkins was suspended from the Labour Party due to allegations of sexual misconduct, thus he currently sits as an Independent.

Luton South (UK Parliament constituency) Parliamentary constituency in the United Kingdom

Luton South is a constituency in Bedfordshire represented in the House of Commons of the UK Parliament since 2010 by Gavin Shuker. Shuker was a member of the Labour Party and the Co-operative Party until 19 February 2019, when he resigned his membership to sit as part of The Independent Group.

Milton Keynes is a unitary authority in Buckinghamshire, England. Until 1 April 1997 it was a non-metropolitan district.

Elections to Central Bedfordshire Council were held on 7 May 2015, along with the United Kingdom general election, 2015 and other local elections. The whole council was up for election, with each successful candidate serving a four-year term of office, expiring in 2019.

Elections to Central Bedfordshire Council were held on 5 May 2011, along with other United Kingdom local elections. The whole council was up for election following boundary changes, with each successful candidate serving a four-year term of office, expiring in 2015.

2007 Mid Bedfordshire District Council election

Elections to Mid Bedfordshire District Council were held in May 2007. These were the last elections to council, with all 53 seats being up for election. Councillors elected would serve a two-year term, expiring in 2009, when Mid Bedfordshire District Council was replaced by Central Bedfordshire Council. The Conservative Party retained overall control of the council, winning 37 of 53 seats on the council. The Conservatives won 8 seats unopposed, as did an Independent candidate in one ward.

2003 Mid Bedfordshire District Council election

Elections to Mid Bedfordshire District Council were held on 1 May 2003. All 53 seats were up for election. Councillors elected would serve a four-year term, expiring in 2007. The Conservative Party retained overall control of the council, winning 37 of 53 seats on the council. The Conservatives won 7 seats unopposed.

1999 Mid Bedfordshire District Council election

Elections to Mid Bedfordshire District Council were held on 6 May 1999. All 53 seats were up for election. The Conservative Party gained overall control of the council, increasing their number of seats from 22 to 34, whilst the Labour Party declined from having 20 seats in 1995 to 7.

1995 Mid Bedfordshire District Council election

Elections to Mid Bedfordshire District Council were held on 4 May 1995. All 53 seats were up for election.

1991 Mid Bedfordshire District Council election

Elections to Mid Bedfordshire District Council were held on 2 May 1991. All 53 seats were up for election.

1987 Mid Bedfordshire District Council election

Elections to Mid Bedfordshire District Council were held on 7 May 1987. All 53 seats were up for election.

1983 Mid Bedfordshire District Council election

Elections to Mid Bedfordshire District Council were held on 5 May 1983. All 53 seats were up for election.

1979 Mid Bedfordshire District Council election


Elections to Mid Bedfordshire District Council were held on 3 May 1979, on the same day as the general election, so turnout was higher than usual in district council elections for Mid Bedfordshire. All 53 seats were up for election.

1976 Mid Bedfordshire District Council election

Elections to Mid Bedfordshire District Council were held in May 1976. All 53 seats were up for election.

References

  1. Central Bedfordshire Council (4 June 2009). "Election results for Ampthill, 4 June 2009". www.centralbedfordshire.gov.uk.
  2. Central Bedfordshire Council (4 June 2009). "Election results for Barton, 4 June 2009". www.centralbedfordshire.gov.uk.
  3. Central Bedfordshire Council (4 June 2009). "Election results for Biggleswade, 4 June 2009". www.centralbedfordshire.gov.uk.
  4. Central Bedfordshire Council (4 June 2009). "Election results for Cranfield Ward, 4 June 2009". www.centralbedfordshire.gov.uk.
  5. Central Bedfordshire Council (4 June 2009). "Election results for Dunstable Downs, 4 June 2009". www.centralbedfordshire.gov.uk.
  6. Central Bedfordshire Council (4 June 2009). "Election results for Flitwick East, 4 June 2009". www.centralbedfordshire.gov.uk.
  7. Central Bedfordshire Council (4 June 2009). "Election results for Flitwick West, 4 June 2009". www.centralbedfordshire.gov.uk.
  8. Central Bedfordshire Council (4 June 2009). "Election results for Grovebury, 4 June 2009". www.centralbedfordshire.gov.uk.
  9. Central Bedfordshire Council (4 June 2009). "Election results for Houghton Regis, 4 June 2009". www.centralbedfordshire.gov.uk.
  10. Central Bedfordshire Council (4 June 2009). "Election results for Icknield, 4 June 2009". www.centralbedfordshire.gov.uk.
  11. Central Bedfordshire Council (4 June 2009). "Election results for Langford & Henlow Village, 4 June 2009". www.centralbedfordshire.gov.uk.
  12. Central Bedfordshire Council (4 June 2009). "Election results for Leighton Linslade Central, 4 June 2009". www.centralbedfordshire.gov.uk.
  13. Central Bedfordshire Council (4 June 2009). "Election results for Marston, 4 June 2009". www.centralbedfordshire.gov.uk.
  14. Central Bedfordshire Council (4 June 2009). "Election results for Maulden & Houghton Conquest, 4 June 2009". www.centralbedfordshire.gov.uk.
  15. Central Bedfordshire Council (4 June 2009). "Election results for Northfields, 4 June 2009". www.centralbedfordshire.gov.uk.
  16. Central Bedfordshire Council (4 June 2009). "Election results for Northill & Blunham, 4 June 2009". www.centralbedfordshire.gov.uk.
  17. Central Bedfordshire Council (4 June 2009). "Election results for Plantation, 4 June 2009". www.centralbedfordshire.gov.uk.
  18. Central Bedfordshire Council (4 June 2009). "Election results for Potton, 4 June 2009". www.centralbedfordshire.gov.uk.
  19. Central Bedfordshire Council (4 June 2009). "Election results for Sandy, 4 June 2009". www.centralbedfordshire.gov.uk.
  20. Central Bedfordshire Council (4 June 2009). "Election results for Shefford, 4 June 2009". www.centralbedfordshire.gov.uk.
  21. Central Bedfordshire Council (4 June 2009). "Election results for Silsoe and Shillington, 4 June 2009". www.centralbedfordshire.gov.uk.
  22. Central Bedfordshire Council (4 June 2009). "Election results for South East Bedfordshire, 4 June 2009". www.centralbedfordshire.gov.uk.
  23. Central Bedfordshire Council (4 June 2009). "Election results for South West Bedfordshire, 4 June 2009". www.centralbedfordshire.gov.uk.
  24. Central Bedfordshire Council (4 June 2009). "Election results for Southcott, 4 June 2009". www.centralbedfordshire.gov.uk.
  25. Central Bedfordshire Council (4 June 2009). "Election results for Stotfold and Arlesey, 4 June 2009". www.centralbedfordshire.gov.uk.
  26. Central Bedfordshire Council (4 June 2009). "Election results for Toddington, 4 June 2009". www.centralbedfordshire.gov.uk.
  27. Central Bedfordshire Council (4 June 2009). "Election results for Watling, 4 June 2009". www.centralbedfordshire.gov.uk.
  28. Central Bedfordshire Council (4 June 2009). "Election results for Woburn & Harlington, 4 June 2009". www.centralbedfordshire.gov.uk.