Central Bedfordshire Council election, 2015

Last updated

Elections to Central Bedfordshire Council were held on 7 May 2015, along with the United Kingdom general election, 2015 and other local elections. The whole council was up for election, with each successful candidate serving a four-year term of office, expiring in 2019.

Central Bedfordshire Council

Central Bedfordshire Council is the unitary authority for Central Bedfordshire in the ceremonial county of Bedfordshire, England.

Contents

The Conservative Party retained overall control of the council, winning 53 of the 59 seats on the council. Of the remaining 6 seats, 3 were won by Independents, 2 were won by the Labour Party and 1 was won by the Liberal Democrats.

Result

Central Bedfordshire Council Election Result 2015
PartySeatsGainsLossesNet gain/lossSeats %Votes %Votes+/−
  Conservative 53 5 1 +4 89.83 53.78 138,953 +0.17%
  Independent 3 1 2 -1 5.08 10.38 26,814 +2.33%
  Labour 2 2 1 +1 3.39 16.84 43,512 -5.39%
  Liberal Democrat 1 0 4 -4 1.70 5.12 13,232 -9.24%
  UKIP 0 0 0 0 0.0 8.22 21,253 +7.50%
  Green 0 0 0 0 0.0 5.66 14,625 +4.63%

The overall turnout was 66.37% with a total of 258,389 valid votes cast. A total of 1,085 ballots were rejected in the 25 wards in which the number of rejected votes was reported.

Council Composition

Following the 2011 election, the composition of the council was:

49541
ConservativeLDIL

After the election, the composition of the council was:

53321
ConservativeILLD

I - Independent
L - Labour
LD - Liberal Democrats

Ward Results

Asterisks denote incumbent Councillors seeking re-election. Councillors seeking re-election were elected in 2011, and results are compared to that year's polls on that basis. All results are listed below:

Ampthill

Ampthill (3 seats) [1]
PartyCandidateVotes%±
Conservative Mike Blair*3,92124.27+1.42
Conservative Paul Alan Duckett*3,75323.23-2.19
Conservative Paul Raymond Downing2,89919.95-2.22
Independent Mark Andrew Smith* 2,378 14.72 -8.18
Green Susan Heather Clinch 1,739 10.76
Labour Peter Joyce 1,465 9.07 +0.41
Majority 521 3.23
Turnout 16,155 73.00 +24.90
Conservative hold Swing
Conservative gain from Independent Swing
Conservative hold Swing

A total of 123 ballots were rejected.

Arlesey

Arlesey [2]
PartyCandidateVotes%±
Conservative Ian Dalgarno*3,97722.08+0.18
Conservative David Shelvey3,67720.42-2.67
Conservative Richard David Wenham*3,32118.44-2.49
UKIP Thomas Heeney 1,939 10.77
Labour David Charles Devereux 1,914 10.63 -1.28
Labour Douglas Alexander Landman 1,649 9.15 -1.94
Independent Robert David McGregor 1,532 8.51
Majority 1,382 7.67
Turnout 18,009 69.00 +28.00
Conservative hold Swing

A total of 84 ballots were rejected.

Aspley and Woburn

Aspley and Woburn (1 seat) [3]
PartyCandidateVotes%±
Conservative Budge Wells2,01273.24-2.08
Green Robin Alexander Harewood-Lee 735 26.76
Majority 1,277 46.48
Turnout 2,747 74.00 +27.40
Conservative hold Swing

A total of 33 ballots were rejected.

Barton-Le-Clay

Barton-Le-Clay (1 seat) [4]
PartyCandidateVotes%±
Independent Ian Leslie Shingler*1,51851.13+19.22
Conservative Gareth Mackey 759 25.56 +4.49
Liberal Democrat Janet Ann Nunn 417 14.05 -9.61
Labour Lesley Ann Lodge 275 9.26 +2.15
Majority 759 25.57
Turnout 2,969 74.00 +25.20
Independent hold Swing

A total of 13 ballots were rejected.

Biggleswade North

Biggleswade North (2 seats) [5]
PartyCandidateVotes%±
Conservative Maurice Richard Jones*1,59425.27-1.57
Conservative Jane Gay Wimberley Lawrence*1,47223.33-3.75
Labour Pete Biernis 977 15.49 -6.60
UKIP Frank Foster 925 14.66
Labour Bernard Victor Briars 910 14.43 -9.56
Green Amy-Jane Peabody 430 6.82
Majority 495 7.84
Turnout 6,308 63.00 +24.80
Conservative hold Swing

A total of 36 ballots were rejected.

Biggleswade South

Biggleswade South (2 seats) [6]
PartyCandidateVotes%±
Conservative David John Lawrence*2,57528.27-2.19
Conservative Tim Woodward1,98221.76-7.85
Conservative David William Frank Albone 1,246 13.68
UKIP Duncan Anthony Strachan 1,209 13.27
Independent Bernard John Rix 779 8.55
Labour Satinderjit Singh Dhaliwal 672 7.38 -13.32
Green Andrew Richard Peabody 646 7.09
Majority 736 8.08
Turnout 9,109 67.00 +25.30
Conservative hold Swing

A total of 25 ballots were rejected.

Caddington

Caddington (2 seats) [7]
PartyCandidateVotes%±
Conservative Kevin Mark Collins2,88829.48-6.83
Conservative Richard Charles Stay*2,74027.97-7.01
Labour Ian Guy Lowery 733 7.48 -4.17
Labour Shirley Jean Smith 666 6.80 -0.15
Independent Patrick Brian Smith 615 6.28
Independent Chrystna Yvonne Smith 495 5.05
Green Matt Ogier-Russell 478 4.88
Majority 1,559 15.91
Turnout 9,796 72.00 +24.80
Conservative hold Swing

A total of 46 ballots were rejected.

Cranfield & Marston Moretaine

Cranfield & Marston Moretaine (3 seats) [8]
PartyCandidateVotes%±
Conservative Sue Clark*3,38122.00+4.12
Conservative Ken Matthews*2,97719.37+2.56
Conservative Robert William Morris2,76517.99+0.73
UKIP Roger Baker 1,958 12.74
Labour Elizabeth Margaret Rooney 1,208 7.86 +0.15
Labour Alan Joseph Morris 1,156 7.52 -0.12
Labour Andrew Shaw 1,093 7.11 -0.21
Green Alison Heather Parker 831 5.41
Majority 807 5.25
Turnout 15,369 67.00 +27.80
Conservative hold Swing

A total of 24 ballots were rejected.

Dunstable Central

Dunstable Central (1 seat) [9]
PartyCandidateVotes%±
Conservative Carole Hegley*1,16252.70-11.94
Labour Theresa Moira Miller 674 30.57 +7.53
Independent Ian Phillip Bunker 369 16.73
Majority 488 22.13
Turnout 2,205 63.00 +24.00
Conservative hold Swing

The number of ballots rejected was not reported by the council.

Dunstable Icknield

Dunstable Icknield (2 seats) [10]
PartyCandidateVotes%±
Conservative David John McVicar*2,06231.61+7.84
Conservative John Anthony Chatterley1,97530.28+9.64
Labour Catherine Theresa Howes 980 15.02 -0.41
Labour Michael Aneurin Stokes 874 13.40 -1.45
Independent Christine Ann Reynolds 632 9.69
Majority 995 15.26
Turnout 6,523 63.00 +28.60
Conservative hold Swing

The number of ballots rejected was not reported by the council.

Dunstable Manshead

Dunstable Manshead (1 seat) [11]
PartyCandidateVotes%±
Conservative Eugene Patrick Ghent87939.05-3.42
Independent Neal Reynolds 697 30.96
Labour Roger Barry Pepworth 675 29.99 -12.99
Majority 182 8.09
Turnout 2,251 59.00 +21.80
Conservative gain from Labour Swing

A total of 41 ballots were rejected.

Dunstable Northfields

Dunstable Northfields (2 seats) [12]
PartyCandidateVotes%±
Conservative Jeannette Freeman1,80623.21+4.96
Conservative Nigel Austin Warren1,43618.45+0.11
Independent Julian David Murray* 1,063 13.66 -7.59
Labour Michael Andrew Rogers 1,027 13.20 -1.78
Independent Bev Coleman 933 11.99
Labour Robert Leslie Shelley 773 9.93 -4.46
Green Peter John Burrows 409 5.26
Green Catherine Joyce Aganoglu 335 4.30
Majority 373 4.79
Turnout 7,782 59.00 +22.40
Conservative gain from Independent Swing
Conservative hold Swing

The number of ballots rejected was not reported by the council.

Dunstable Watling

Dunstable Watling (2 seats) [13]
PartyCandidateVotes%±
Conservative Peter Nugent Hollick*3,13532.88-1.47
Conservative Nigel Young3,09732.48-1.01
Labour Michael Rolfe Ingham 994 10.42 -1.55
Labour Sheila Morgan 966 10.13 -1.68
Independent Beryl Mary Meakins 750 7.86
Independent Alan Gerard Corkhill 594 6.23
Majority 38 0.40
Turnout 9,536 69.00 +27.20
Conservative hold Swing

The number of ballots rejected was not reported by the council.

Eaton Bray

Eaton Bray (1 seat) [14]
PartyCandidateVotes%±
Conservative Ken Janes1,22550.83-24.17
Independent Ruth Archer 943 39.13
Labour Isaac Chikwakwanyi Sibiya 242 10.04 -9.16
Majority 282 11.70
Turnout 2,410 72.00 +26.00
Conservative hold Swing

A total of 21 ballots were rejected.

Flitwick

Flitwick (3 seats) [15]
PartyCandidateVotes%±
Conservative Fiona Chapman3,51120.80+6.12
Conservative Andrew Michael Turner*3,27419.40+1.94
Conservative Charles Christopher Gomm*2,76216.36+1.86
Labour David William Austine Short 1,585 9.39 +1.90
UKIP Adam Glen Larkins 1,522 9.02
Labour Sheila Gardner 1,514 8.97 +2.18
UKIP Russell Edward Shaw 1,368 8.10
Green David Christian Parrock 1,344 7.96 +3.16
Majority 1,177 6.97
Turnout 16,880 70.00 34.40
Conservative hold Swing

A total of 57 ballots were rejected.

Heath & Reach

Heath & Reach (1 seat) [16]
PartyCandidateVotes%±
Conservative Mark Anthony Gaius Versallion*
Conservative hold Swing

Mark Versallion was re-elected unopposed.

Houghton Conquest & Haynes

Houghton Conquest & Haynes (1 seat) [17]
PartyCandidateVotes%±
Conservative Angela Barker*1,13767.56
Labour Paul Michael Forster 299 17.76
Independent Richard James 247 14.68
Majority 838 49.80
Turnout 1,683 77.00N/A
Conservative hold Swing

A total of 22 ballots were rejected.

Houghton Hall

Houghton Hall (2 seats) [18]
PartyCandidateVotes%±
Conservative John Robert Kane1,33624.44+7.69
Liberal Democrat Susan Anne Goodchild*1,25022.87-2.25
Liberal Democrat Laura Jane Mary Ellaway 874 15.99 -4.52
Labour Chris Slough 806 14.74 +2.15
Labour Syed Qaiser Abbas 700 12.81 +0.84
Green Steve Finan 500 9.15
Majority 376 6.88
Turnout 5,466 56.00 +23.90
Conservative gain from Liberal Democrat Swing
Liberal Democrat hold Swing

A total of 65 ballots were rejected.

Leighton Buzzard North

Leighton Buzzard North (3 seats) [19]
PartyCandidateVotes%±
Conservative Ken Ferguson3,66319.56+2.08
Conservative Brian John Spurr*3,64019.44+0.88
Conservative Roy William Johnstone*3,50918.74-0.56
Labour Michael John Bishop 1,614 8.62 -0.92
Labour Daniel Scott 1,438 7.68 -0.52
Labour Ian Michael Purvis 1,331 7.11 -2.42
Green Jonathan Adrian Hull 737 3.94
Liberal Democrat Rosalind Mennie 734 3.92 -1.24
Green Simon James Wilson 713 3.81
Liberal Democrat Alan Roger White 674 3.60 -2.80
Green Gary Woodwards 671 3.58
Majority 1,895 10.12
Turnout 18,724 63.00 +26.10
Conservative hold Swing

A total of 102 ballots were rejected.

Leighton Buzzard South

Leighton Buzzard South (3 seats) [20]
PartyCandidateVotes%±
Conservative Amanda Louise Dodwell*2,99918.29-1.20
Conservative Dave Bowater*2,86217.46-2.07
Conservative Ray Berry*2,82317.22-2.47
Labour John Stephen Bone 1,302 7.94 -3.26
UKIP Garry Lelliott 1,163 7.09
Labour Adrian Peter Heffernan 1,046 6.38
Labour Christopher Phillip Earnshaw Northedge 929 5.67 -3.92
Liberal Democrat Anne Elizabeth Gray 559 3.41 -3.66
Green Nichola Lynne Cheesewright 543 3.31
Liberal Democrat Anne Jennifer Guess 481 2.93 -3.89
Green Emily Anne Lawrence 474 2.89
Liberal Democrat Celia Mary Snelling 452 2.76 -3.91
Independent Paul Leslie Adams 401 2.45
Green Kenton Roger Charles Sumner 361 2.20
Majority 137 0.83
Turnout 16,395 64.00 +28.00
Conservative hold Swing

A total of 73 ballots were rejected.

Linslade

Linslade (3 seats) [21]
PartyCandidateVotes%±
Conservative Gordon Perham2,93516.14-1.16
Conservative Gary David Tubb2,81415.48+2.56
Conservative Benjamin Mark Ian Walker2,41813.30+1.18
Liberal Democrat Peter John Snelling 1,333 7.33 -4.65
Labour Peter William Palfrey 1,068 5.87 -1.00
Liberal Democrat Russ Goodchild 1,027 5.65 -4.02
Labour Rebekah Price 972 5.35 -0.48
Liberal Democrat Nigel Kenneth Carnell 958 5.27 -6.31
UKIP Ian Thomas Reynolds 930 5.11
Labour Gerald Alfred Sandison 914 5.03 -0.37
Green Ken Barry 834 4.59 -1.24
UKIP Mike Woodhouse 770 4.24
Green Parisa Francesca Rosina Darling 667 3.67
Green Tony Mabbott 541 2.97
Majority 121 0.66
Turnout 18,181 71.00 +25.00
Conservative hold Swing

A total of 71 ballots were rejected.

Northill

Northill (1 seat) [22]
PartyCandidateVotes%±
Conservative Frank Wray Firth93261.39-6.92
UKIP Paul Goodchild 331 21.81
Labour Peter Heyes 255 16.80 +0.23
Majority 601 39.58
Turnout 1,518 43.00 -7.90
Conservative hold Swing

A total of 14 ballots were rejected.

Parkside

Parkside (1 seat) [23]
PartyCandidateVotes%±
Labour Antonia Petra Ryan51026.87+5.92
Independent Alan David Winter 486 25.61
UKIP Stephen John North 387 20.39
Conservative Adam Fahn 384 20.23
Independent Jimmy Carroll 131 6.90
Majority 24 1.26
Turnout 1,898 53.00 +22.90
Labour gain from Liberal Democrat Swing

A total of 13 ballots were rejected.

Potton

Potton (2 seats) [24]
PartyCandidateVotes%±
Independent Adam Zerny*3,05947.35+10.93
Conservative Doreen Beatrice Gurney*1,38421.42-2.62
Conservative Allan Mathieson Drew 1,223 18.93 -3.35
Labour Adam John Dutton 795 12.30 +3.07
Majority 161 2.49
Turnout 6,461 73.00 +22.60
Independent hold Swing
Conservative hold Swing

A total of 33 ballots were rejected.

Sandy

Sandy (3 seats) [25]
PartyCandidateVotes%±
Conservative Caroline Mauldin*2,79816.43-0.41
Conservative Tracey Deborah Stock2,33213.69-2.62
Conservative Peter Lindsay Smith2,29413.47+1.40
Liberal Democrat Nigel Aldis 1,378 8.09 -4.73
UKIP Christopher Butterfield 1,286 7.55
UKIP George Konstantinidis 1,087 6.38 +0.17
UKIP Peter Edwin Day 1,081 6.35
Labour Cheryl Ann McDonald 1,055 6.20 -0.20
Independent Ken Lynch 1,018 5.98
Labour Tom Noakes 849 4.99 -1.48
Liberal Democrat Jafor Ali 723 4.25 -4.50
Independent Stephen Robert Laurie Allen 572 3.36 -3.10
Liberal Democrat Gee Leach 555 3.26 -4.41
Majority 916 5.38
Turnout 17,028 64.00 +26.50
Conservative hold Swing
Conservative gain from Liberal Democrat Swing

A total of 37 ballots were rejected.

Shefford

Shefford (2 seats) [26]
PartyCandidateVotes%±
Conservative Lewis Birt*2,73432.14+1.57
Conservative Tony Brown*2,63030.92+1.55
Labour Nigel Ian Rushby 1,176 13.83 +2.29
UKIP Jonathan Shilton 1,030 12.11 +3.39
UKIP Roger Martin Smith 936 11.00
Majority 1,454 17.09
Turnout 8,506 69.00 +27.50
Conservative hold Swing

A total of 31 ballots were rejected.

Silsoe & Shillington

Silsoe & Shillington (1 seat) [27]
PartyCandidateVotes%±
Independent Alison Mary Wainman Graham1,39445.98
Conservative Ian Jeremy Knighton 1,276 42.08 -4.14
Labour Keith Richard Whitwell 362 11.94 +5.57
Majority 118 3.90
Turnout 3,032 75.00 +23.50
Independent gain from Conservative Swing

A total of 23 ballots were rejected.

Stotfold & Langford

Stotfold & Langford (3 seats) [28]
PartyCandidateVotes%±
Conservative Brian Saunders3,75021.25+3.11
Conservative John Alfred George Saunders*3,26118.48+0.87
Conservative Steven Ian Graham Dixon3,20518.16+1.35
UKIP Roy Mitchell 1,667 9.44
Labour Lucy Kelly 1,570 8.90 +2.71
Independent Alan Reginald Cooper 1,539 8.72
Independent Larry Stoter 1,484 8.41
Green Craig Thomas 1,172 6.64
Majority 1,538 8.72
Turnout 17,648 69.00 +22.90
Conservative hold Swing

A total of 38 ballots were rejected.

Tithe Farm

Tithe Farm (1 seat) [29]
PartyCandidateVotes%±
Labour Tony Swain52230.58-14.80
Conservative Tony Morris 485 28.41
Independent David Abbott 288 16.87
Liberal Democrat Marion Frances Rolfe 230 13.48 -41.14
Independent Tracey Karen McMahon 182 10.66
Majority 37 2.17
Turnout 1,707 55.00 +22.90
Labour gain from Liberal Democrat Swing

A total of 34 ballots were rejected.

Toddington

Toddington (2 seats) [30]
PartyCandidateVotes%±
Conservative Norman Bryan Costin*2,39125.82+0.54
Conservative Thomas Nicols*1,61617.45-9.58
UKIP Richard Roe 1,154 12.46
Liberal Democrat Brian James Golby 982 10.61 -5.38
Labour Rachel Joy Elizabeth Garnham 977 10.55 -0.31
Independent Mary Elizabeth Walsh 822 8.88
Independent Michael Stonnell 712 7.69
Liberal Democrat Linda Anne Jack 605 6.54 -4.43
Majority 462 4.99
Turnout 9,259 71.00 +26.70
Conservative hold Swing

A total of 25 ballots were rejected.

Westoning, Flitton & Greenfield

Westoning, Flitton & Greenfield (1 seat) [31]
PartyCandidateVotes%±
Conservative James Gerard Jamieson*1,85965.605.76
UKIP Steven David Wildman 510 17.99
Green James Malcolm Chalmers 465 16.41 -3.56
Majority 1,349 47.61
Turnout 2,834 74.00 +25.90
Conservative hold Swing

The number of ballots rejected was not reported by the council.

Related Research Articles

Bedfordshire County of England

Bedfordshire is a county in the East of England. It is a ceremonial county and a historic county, covered by three unitary authorities: Bedford, Central Bedfordshire, and Luton.

Leighton Buzzard town in Bedfordshire, England

Leighton Buzzard is a town in Bedfordshire, England, near the Chiltern Hills and lying between Luton and Milton Keynes. It adjoins Linslade and the name Leighton Linslade is sometimes used to refer to the combination of the two towns; parts of this article also apply to Linslade as well as Leedon.

Mid Bedfordshire District former English non-metropolitan district in the county of Bedfordshire, abolished in 2009

Mid Bedfordshire was, from 1974 to 2009, a local government district in Bedfordshire, England.

South Bedfordshire

South Bedfordshire was, from 1974 to 2009, a non-metropolitan district of Bedfordshire, in the East of England. Its main towns were Dunstable, Houghton Regis and Leighton Buzzard.

South West Bedfordshire (UK Parliament constituency) Parliamentary constituency in the United Kingdom

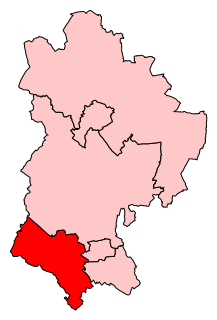
South West Bedfordshire is a constituency represented in the House of Commons of the UK Parliament. As with all constituencies of the UK Parliament, it elects one Member of Parliament by the first past the post system of election.

Mid Bedfordshire (UK Parliament constituency) Parliamentary constituency in the United Kingdom

Mid Bedfordshire is a constituency represented in the House of Commons of the UK Parliament since 2005 by Nadine Dorries, of the Conservative Party. Apart from four early years, the constituency has returned a Conservative since its creation in 1918.

Heath and Reach farm village in the United Kingdom

Heath and Reach is an English village and civil parish near the Chiltern Hills in Bedfordshire. It is two miles north of Leighton Buzzard and three miles south of Woburn and adjoins the county boundary with Buckinghamshire. Nearby places are Leighton-Linslade, Great Brickhill and the Duke of Bedford's Woburn Abbey, Woburn Safari Park and Woburn Golf Club.

Elections to Central Bedfordshire Council were held on 4 June 2009. This was the first elections to the newly formed council, with all 66 seats being up for election. All Councillors elected would serve a two year term, expiring in 2011, when ward boundaries would be reviewed. The Conservative Party won overall control of the council, managing to win 54 of 66 seats on the council.

Elections to Central Bedfordshire Council were held on 5 May 2011, along with other United Kingdom local elections. The whole council was up for election following boundary changes, with each successful candidate serving a four-year term of office, expiring in 2015.

2007 Mid Bedfordshire District Council election

Elections to Mid Bedfordshire District Council were held in May 2007. These were the last elections to council, with all 53 seats being up for election. Councillors elected would serve a two-year term, expiring in 2009, when Mid Bedfordshire District Council was replaced by Central Bedfordshire Council. The Conservative Party retained overall control of the council, winning 37 of 53 seats on the council. The Conservatives won 8 seats unopposed, as did an Independent candidate in one ward.

2003 Mid Bedfordshire District Council election

Elections to Mid Bedfordshire District Council were held on 1 May 2003. All 53 seats were up for election. Councillors elected would serve a four-year term, expiring in 2007. The Conservative Party retained overall control of the council, winning 37 of 53 seats on the council. The Conservatives won 7 seats unopposed.

1999 Mid Bedfordshire District Council election

Elections to Mid Bedfordshire District Council were held on 6 May 1999. All 53 seats were up for election. The Conservative Party gained overall control of the council, increasing their number of seats from 22 to 34, whilst the Labour Party declined from having 20 seats in 1995 to 7.

1995 Mid Bedfordshire District Council election

Elections to Mid Bedfordshire District Council were held on 4 May 1995. All 53 seats were up for election.

1991 Mid Bedfordshire District Council election

Elections to Mid Bedfordshire District Council were held on 2 May 1991. All 53 seats were up for election.

1987 Mid Bedfordshire District Council election

Elections to Mid Bedfordshire District Council were held on 7 May 1987. All 53 seats were up for election.

1979 Mid Bedfordshire District Council election


Elections to Mid Bedfordshire District Council were held on 3 May 1979, on the same day as the general election, so turnout was higher than usual in district council elections for Mid Bedfordshire. All 53 seats were up for election.

References

  1. Central Bedfordshire Council. "Ampthill election results - 2015". www.centralbedfordshire.gov.uk.
  2. Central Bedfordshire Council. "Arlesey election results - 2015". www.centralbedfordshire.gov.uk.
  3. Central Bedfordshire Council. "Aspley and Woburn election results - 2015". www.centralbedfordshire.gov.uk.
  4. Central Bedfordshire Council. "Barton-Le-Clay election results - 2015". www.centralbedfordshire.gov.uk.
  5. Central Bedfordshire Council. "Biggleswade North election results - 2015". www.centralbedfordshire.gov.uk.
  6. Central Bedfordshire Council. "Biggleswade South election results - 2015". www.centralbedfordshire.gov.uk.
  7. Central Bedfordshire Council. "Caddington election results - 2015". www.centralbedfordshire.gov.uk.
  8. Central Bedfordshire Council. "Cranfield & Marston Moretaine election results - 2015". www.centralbedfordshire.gov.uk.
  9. Central Bedfordshire Council. "Dunstable Central election results - 2015". www.centralbedfordshire.gov.uk.
  10. Central Bedfordshire Council. "Dunstable Icknield election results - 2015". www.centralbedfordshire.gov.uk.
  11. Central Bedfordshire Council. "Dunstable Manshead election results - 2015". www.centralbedfordshire.gov.uk.
  12. Central Bedfordshire Council. "Dunstable Northfields election results - 2015". www.centralbedfordshire.gov.uk.
  13. Central Bedfordshire Council. "Dunstable Watling election results - 2015". www.centralbedfordshire.gov.uk.
  14. Central Bedfordshire Council. "Eaton Bray election results - 2015". www.centralbedfordshire.gov.uk.
  15. Central Bedfordshire Council. "Flitwick election results - 2015". www.centralbedfordshire.gov.uk.
  16. Central Bedfordshire Council. "Heath and Reach election results - 2015". www.centralbedfordshire.gov.uk.
  17. Central Bedfordshire Council. "Houghton Conquest and Haynes election results - 2015". www.centralbedfordshire.gov.uk.
  18. Central Bedfordshire Council. "Houghton Hall election results - 2015". www.centralbedfordshire.gov.uk.
  19. Central Bedfordshire Council. "Leighton Buzzard North election results - 2015". www.centralbedfordshire.gov.uk.
  20. Central Bedfordshire Council. "Leighton Buzzard South election results - 2015". www.centralbedfordshire.gov.uk.
  21. Central Bedfordshire Council. "Linslade election results - 2015". www.centralbedfordshire.gov.uk.
  22. Central Bedfordshire Council. "Northill election results - 2015". www.centralbedfordshire.gov.uk.
  23. Central Bedfordshire Council. "Parkside election results - 2015". www.centralbedfordshire.gov.uk.
  24. Central Bedfordshire Council. "Potton election results - 2015". www.centralbedfordshire.gov.uk.
  25. Central Bedfordshire Council. "Sandy election results - 2015". www.centralbedfordshire.gov.uk.
  26. Central Bedfordshire Council. "Shefford election results - 2015". www.centralbedfordshire.gov.uk.
  27. Central Bedfordshire Council. "Silsoe and Shillington election results - 2015". www.centralbedfordshire.gov.uk.
  28. Central Bedfordshire Council. "Stotfold and Langford election results - 2015". www.centralbedfordshire.gov.uk.
  29. Central Bedfordshire Council. "Tithe Farm election results - 2015". www.centralbedfordshire.gov.uk.
  30. Central Bedfordshire Council. "Toddington election results - 2015". www.centralbedfordshire.gov.uk.
  31. Central Bedfordshire Council. "Westoning, Flitton and Greenfield election results - 2015". www.centralbedfordshire.gov.uk.