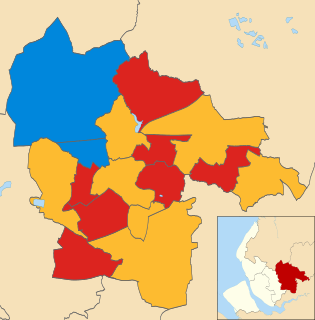
The 2015 Bolton Metropolitan Borough Council election were held on 7 May 2015 to elect members of Bolton Metropolitan Borough Council in Greater Manchester, England. [1] This took place on the same day as other local elections
Greater Manchester is a metropolitan county in North West England, with a population of 2.8 million. It encompasses one of the largest metropolitan areas in the United Kingdom and comprises ten metropolitan boroughs: Bolton, Bury, Oldham, Rochdale, Stockport, Tameside, Trafford, Wigan, and the cities of Manchester and Salford. Greater Manchester was created on 1 April 1974 as a result of the Local Government Act 1972; and designated a functional city region on 1 April 2011.
22 seats were contested, including 2 seats in the Heaton and Lostock ward following the retirement of Conservative Councillor Alan Rushton, and 2 seats in Westhoughton North following the resignation of Labour Councillor Sean Harkin. The Labour Party won 14 seats, the Conservatives won 6 seats, UKIP won 1 seats and the Liberal Democrats won 1 seat.
The Conservative Party, officially the Conservative and Unionist Party, is a centre-right political party in the United Kingdom. Presently led by Theresa May, it has been the governing party since 2010. It presently has 314 Members of Parliament in the House of Commons, 249 members of the House of Lords, and 18 members of the European Parliament. It also has 31 Members of the Scottish Parliament, 12 members of the Welsh Assembly, eight members of the London Assembly and 9,008 local councillors. One of the major parties of UK politics, it has formed the government on 45 occasions, more than any other party.
The Labour Party is a centre-left political party in the United Kingdom which has been described as an alliance of social democrats, democratic socialists and trade unionists. The party's platform emphasises greater state intervention, social justice and strengthening workers' rights.
After the election, the total composition of the council was as follows:
The UK Independence Party is a hard Eurosceptic, right-wing political party in the United Kingdom. It currently has one representative in the House of Lords and seven Members of the European Parliament (MEPs). It has four Assembly Members (AMs) in the National Assembly for Wales and one member in the London Assembly. The party reached its greatest level of success in the mid-2010s, when it gained two Members of Parliament and was the largest UK party in the European Parliament.
The Liberal Democrats are a liberal political party in the United Kingdom. They presently have 11 Members of Parliament in the House of Commons, 96 members of the House of Lords, and one member of the European Parliament. They also have five Members of the Scottish Parliament and a member each in the Welsh Assembly and London Assembly. The party reached the height of its influence in the early 2010s, forming a junior partner in a coalition government from 2010 to 2015. It is presently led by Vince Cable.
Party | Seats | Gains | Losses | Net gain/loss | Seats % | Votes % | Votes | +/− | |
---|---|---|---|---|---|---|---|---|---|
Labour | 14 | 1 | 2 | -1 | 63.7 | 38.9 | 53,604 | -1.4 | |
Conservative | 6 | 1 | 1 | 0 | 27.3 | 29.9 | 41,227 | +7.3 | |
UKIP | 1 | 1 | 0 | +1 | 4.5 | 18.5 | 25,505 | -6.8 | |
Liberal Democrat | 1 | 0 | 0 | 0 | 4.5 | 7.3 | 10,127 | +0.2 | |
Green | 0 | 0 | 0 | 0 | 0 | 3.9 | 5,336 | +0.4 | |
Independent | 0 | 0 | 0 | 0 | 0 | 1.5 | 2,021 | +0.5 | |
Prior to the election the composition of the council was:
40 | 15 | 3 | 2 |
Labour | Conservative | LD | U |
After the election the composition of the council was:
39 | 15 | 3 | 3 |
Labour | Conservative | LD | U |
LD - Liberal Democrats
U - UKIP
Party | Candidate | Votes | % | ± | |
---|---|---|---|---|---|
Conservative | Paul Wild | 2963 | 41.4 | +5.1 | |
Labour | Debbie Newall | 2129 | 29.7 | -1.7 | |
UKIP | Harry Lamb | 1500 | 21.0 | -4.6 | |
Liberal Democrat | Clive Atty | 302 | 4.2 | +2.1 | |
Green | Ben Deed | 261 | 3.6 | -0.9 | |
Majority | 834 | 11.6 | +6.6 | ||
Turnout | 7,155 | 68.1 | +27.7 | ||
Conservative hold | Swing | UKIP to Conservative 4.8 | |||
Party | Candidate | Votes | % | ± | |
---|---|---|---|---|---|
Conservative | Stuart Haslam | 3245 | 50.7 | +7.0 | |
Labour | Tony Shepherd | 1519 | 23.7 | +2.0 | |
UKIP | Helen Turner | 1065 | 16.6 | -9.1 | |
Green | Joshua Handley | 212 | 3.3 | +2.5 | |
Liberal Democrat | Gaby McDowall | 199 | 3.1 | -1.6 | |
Independent | Eric Hyland | 159 | 2.5 | +2.5 | |
Majority | 1,726 | 27.0 | +9.0 | ||
Turnout | 6,399 | 71.3 | +30.4 | ||
Conservative hold | Swing | UKIP to Conservative 8.0 | |||
Party | Candidate | Votes | % | ± | |
---|---|---|---|---|---|
Labour | John Byrne | 2323 | 40.9 | -2.1 | |
UKIP | Steven Flatman | 1557 | 27.4 | -7.7 | |
Conservative | Ryan Haslam | 1402 | 24.7 | +8.0 | |
Green | Laura Diggle | 244 | 4.3 | +1.0 | |
Liberal Democrat | Stephen Howarth | 153 | 2.7 | +1.2 | |
Majority | 766 | 13.5 | +5.6 | ||
Turnout | 5,679 | 59.3 | +22.3 | ||
Labour hold | Swing | UKIP to Conservative 7.8 | |||
Party | Candidate | Votes | % | ± | |
---|---|---|---|---|---|
Conservative | Norman Critchley | 4340 | 56.0 | +2.4 | |
Labour Co-op | Neil Garrity | 1589 | 20.4 | -1.8 | |
UKIP | Brett Varnam | 1057 | 13.6 | -6.7 | |
Green | Liz Spencer | 424 | 5.4 | +5.4 | |
Liberal Democrat | Chris Atty | 368 | 4.7 | +0.6 | |
Majority | 2,751 | 35.4 | +4.0 | ||
Turnout | 7,778 | 73.3 | +32.6 | ||
Conservative hold | Swing | UKIP to Conservative 4.5 | |||
Party | Candidate | Votes | % | ± | |
---|---|---|---|---|---|
Labour | Guy Harkin | 3895 | 63.0 | +3.0 | |
Conservative | Nadim Muslim | 1343 | 21.7 | +10.1 | |
Liberal Democrat | Anne Warren | 641 | 10.4 | +6.6 | |
Green | Farhan Patel | 306 | 4.9 | +4.9 | |
Majority | 2,552 | 41.3 | +2.0 | ||
Turnout | 6,185 | 60.3 | +21.0 | ||
Labour hold | Swing | UKIP to Conservative 15.5 | |||
Party | Candidate | Votes | % | ± | |
---|---|---|---|---|---|
Labour | Jean Gillies | 2703 | 50.3 | +1.4 | |
UKIP | Jeff Armstrong | 1626 | 30.2 | -7.1 | |
Conservative | Aidan Meagan | 723 | 13.4 | +6.3 | |
Green | Trevor Bonfield | 178 | 3.3 | -0.6 | |
Liberal Democrat | David Connor | 144 | 2.7 | +0.2 | |
Majority | 1,077 | 20.0 | +8.3 | ||
Turnout | 5,374 | 49.5 | +21.4 | ||
Labour hold | Swing | UKIP to Conservative 6.7 | |||
Party | Candidate | Votes | % | ± | |
---|---|---|---|---|---|
Labour | Madeline Murray | 3542 | 66.9 | -1.7 | |
UKIP | Paul Eccles | 779 | 14.7 | +0.4 | |
Conservative | Mohammed Waqas | 658 | 12.4 | +2.8 | |
Green | Helen Dickson | 189 | 3.6 | +0.0 | |
Liberal Democrat | Duncan Macpherson | 126 | 2.4 | +0.6 | |
Majority | 2,763 | 52.2 | -2.4 | ||
Turnout | 5,294 | 55.5 | +18.9 | ||
Labour hold | Swing | Labour to Conservative 2.2 | |||
Party | Candidate | Votes | % | ± | |
---|---|---|---|---|---|
Labour | Linda Thomas | 3121 | 63.1 | -3.0 | |
UKIP | Sandra Harvey | 886 | 17.9 | +0.1 | |
Conservative | Iqraa Shahid | 489 | 9.9 | +3.4 | |
Green | Ian McHugh | 207 | 4.2 | -0.9 | |
Liberal Democrat | Christine Macpherson | 123 | 2.5 | -0.3 | |
Independent | Roheel Iqbal | 117 | 117 | +1.2 | |
Majority | 2,235 | 45.2 | -3.4 | ||
Turnout | 4,943 | 55.1 | +16.8 | ||
Labour hold | Swing | Labour to Conservative 3.2 | |||
Party | Candidate | Votes | % | ± | |
---|---|---|---|---|---|
Labour | Susan Haworth | 2875 | 51.5 | -5.1 | |
UKIP | Dave Harvey | 1549 | 27.7 | +3.7 | |
Conservative | Robert Tyler | 845 | 15.1 | +3.0 | |
Green | Elizabeth McManus | 165 | 2.9 | -0.9 | |
Liberal Democrat | Wendy Connor | 152 | 2.7 | -0.1 | |
Majority | 1,330 | 23.8 | -9.0 | ||
Turnout | 5,590 | 56.3 | +24.9 | ||
Labour hold | Swing | Labour to UKIP 4.4 | |||
Two seats were up for election in this ward.
Party | Candidate | Votes | % | ± | |
---|---|---|---|---|---|
Conservative | Bob Allen | 4299 | 30.5 | ||
Conservative | Andy Morgan | 3352 | 23.7 | ||
Labour | Julia Silvester | 1649 | 11.7 | ||
Labour | Ibrahim Ismail | 1629 | 11.5 | ||
UKIP | David Butler | 1088 | 7.7 | ||
UKIP | Paula Hendrie | 748 | 5.3 | ||
Liberal Democrat | Rebekah Fairhurst | 485 | 3.4 | ||
Green | Hannah Middleshaw | 468 | 3.3 | ||
Liberal Democrat | Francine Godfrey | 394 | 2.8 | ||
Conservative hold | |||||
Party | Candidate | Votes | % | ± | |
---|---|---|---|---|---|
Labour | Stephen Pickup | 2559 | 37.5 | ||
Conservative | Carol Forshaw | 2125 | 31.1 | ||
UKIP | Derek Snowden | 1476 | 21.6 | ||
Liberal Democrat | Doug Bagnall | 339 | 5.0 | ||
Green | Keith Cocker | 331 | 4.8 | ||
Majority | 434 | 6.3 | |||
Turnout | 6,830 | 66.3 | |||
Labour hold | |||||
Party | Candidate | Votes | % | ± | |
---|---|---|---|---|---|
Labour | Joyce Kellett | 2040 | 29.6 | -5.8 | |
Conservative | Anne Galloway | 1696 | 24.6 | +4.8 | |
UKIP | Bob Horsfield | 1033 | 15.0 | -8.7 | |
Liberal Democrat | Stephen Rock | 936 | 13.3 | -1.9 | |
Independent | Marie Brady | 922 | 13.4 | +13.4 | |
Green | Roderick Riesco | 260 | 3.8 | -1.6 | |
Majority | 344 | 5.2 | -6.5 | ||
Turnout | 6,887 | 67.8 | +29.9 | ||
Labour hold | Swing | UKIP to Conservative 7.0 | |||
Party | Candidate | Votes | % | ± | |
---|---|---|---|---|---|
Labour | Shafaqat Shaikh | 2126 | 33.7 | +3.9 | |
Conservative | Phil Ashcroft | 1961 | 31.1 | +1.1 | |
UKIP | Joan Johnson | 1818 | 28.8 | -4.9 | |
Liberal Democrat | David Cooper | 202 | 3.2 | +1.4 | |
Green | James Tomkinson | 201 | 3.2 | -1.0 | |
Majority | 165 | 2.6 | |||
Turnout | 6,308 | 63.5 | +24.3 | ||
Labour gain from Conservative | Swing | UKIP to Labour 4.4 | |||
Party | Candidate | Votes | % | ± | |
---|---|---|---|---|---|
Labour | Liam Irving | 2331 | 37.6 | +1.9 | |
UKIP | Mark Cunningham | 1953 | 31.5 | -2.9 | |
Conservative | Sandra Macneill | 1053 | 17.0 | +8.3 | |
Liberal Democrat | Margaret Rothwell | 590 | 9.5 | -1.4 | |
Green | Graham Robert Marsden | 271 | 4.4 | +4.4 | |
Majority | 378 | 6.1 | +4.8 | ||
Turnout | 6,198 | 58.9 | +28.2 | ||
Labour hold | Swing | UKIP to Conservative 5.5 | |||
Party | Candidate | Votes | % | ± | |
---|---|---|---|---|---|
UKIP | Sean Hornby | 2050 | 31.7 | -1.5 | |
Labour | Anthony Connell | 2011 | 31.1 | +3.3 | |
Conservative | Rees Gibbon | 1414 | 21.9 | +4.5 | |
Liberal Democrat | Eric Hyde | 782 | 12.1 | -5.4 | |
Green | Ed Dunsdon | 198 | 3.1 | -0.8 | |
Majority | 39 | 0.6 | -4.8 | ||
Turnout | 6,455 | 65.9 | +26.4 | ||
UKIP gain from Labour | Swing | Lib Dem to Conservative 4.9 | |||
Party | Candidate | Votes | % | ± | |
---|---|---|---|---|---|
Labour | Ebrahim Adia | 4555 | 77.3 | +4.8 | |
Conservative | Jack Heyes | 747 | 12.7 | +4.7 | |
Green | Alan Johnson | 457 | 7.7 | +2.7 | |
Liberal Democrat | Jaleh Hayes | 136 | 2.3 | +0.6 | |
Majority | 3,808 | 64.6 | +4.3 | ||
Turnout | 5,895 | 59.0 | +19.2 | ||
Labour hold | Swing | UKIP to Labour 8.6 | |||
Party | Candidate | Votes | % | ± | |
---|---|---|---|---|---|
Liberal Democrat | Carole Swarbrick | 2563 | 36.8 | -0.7 | |
Labour Co-op | John Gillatt | 1915 | 27.5 | -2.3 | |
Conservative | Danny Haslam | 1161 | 16.7 | +7.1 | |
UKIP | Dot Sexton | 1094 | 15.7 | -3.9 | |
Green | Richard Middleshaw | 233 | 3.3 | +0.2 | |
Majority | 648 | 9.3 | +1.6 | ||
Turnout | 6,964 | 68.1 | +22.7 | ||
Liberal Democrat hold | Swing | UKIP to Conservative 5.5 | |||
Party | Candidate | Votes | % | ± | |
---|---|---|---|---|---|
Labour | Elaine Sherrington | 2263 | 42.8 | -0.5 | |
UKIP | Derek Fisher | 1675 | 31.7 | -0.9 | |
Conservative | Naima Dean | 968 | 18.3 | +3.2 | |
Green | Imran Atcha | 199 | 3.8 | +1.0 | |
Liberal Democrat | Paul Harasiwka | 176 | 3.3 | +1.3 | |
Majority | 588 | 11.1 | +0.4 | ||
Turnout | 5,281 | 56.9 | +20.6 | ||
Labour hold | Swing | UKIP to Conservative 2.0 | |||
Two seats were up for election in this ward.
Party | Candidate | Votes | % | ± | |
---|---|---|---|---|---|
Conservative | Zoe Kirk-Robinson | 2517 | 20.6 | ||
Labour | Anne Graham | 2352 | 19.3 | ||
Conservative | Christine Wild | 2131 | 17.5 | ||
Labour | Chris Peacock | 1977 | 16.2 | ||
UKIP | George Bown | 948 | 7.8 | ||
Independent | Jack Speight | 823 | 6.7 | ||
Liberal Democrat | Derek Gradwell | 433 | 3.5 | ||
Liberal Democrat | John Ainscough | 402 | 3.3 | ||
Green | Heather Rylance | 308 | 2.5 | ||
UKIP | Stephen Thomas | 306 | 2.5 | ||
Conservative gain from Labour | |||||
Labour hold | |||||
Party | Candidate | Votes | % | ± | |
---|---|---|---|---|---|
Labour | David Chadwick | 2501 | 39.7 | +0.4 | |
Conservative | Stephen Wallen | 1795 | 28.5 | +11.1 | |
UKIP | Michael Harvey | 1297 | 20.6 | -7.8 | |
Liberal Democrat | David Wilkinson | 481 | 7.6 | -3.6 | |
Green | Alex Conn | 224 | 3.5 | +3.5 | |
Majority | 706 | 11.2 | +0.3 | ||
Turnout | 6,298 | 64.4 | +30.8 | ||
Labour hold | Swing | UKIP to Conservative 9.4 | |||
The 1998 Bolton Metropolitan Borough Council election took place on 7 May 1998 to elect members of Bolton Metropolitan Borough Council in Greater Manchester, England. One third of the council was up for election and the Labour party kept overall control of the council.
Elections to Bolton Metropolitan Borough Council were held on 2 May 2002. One third of the council was up for election and the Labour party kept overall control of the council.
The 2007 St Helens Metropolitan Borough Council election took place on 3 May 2007 to elect members of St Helens Metropolitan Borough Council in Merseyside, England. One third of the council was up for election and the council stayed under no overall control.
Thanet District Council in Kent, England is elected every four years.
The 2008 Woking Council election took place on 1 May 2008 to elect members of Woking Borough Council in Surrey, England. One third of the council was up for election and the Conservative party stayed in overall control of the council.
Elections to Bolton Metropolitan Borough Council was held on 6 May 2010, on the same day as the General Election which led to a much higher turnout than in recent years. One third of the council was up for election and the council stayed under no overall control.
Elections to Bolton Metropolitan Borough Council were held on 5 May 2011, along with the United Kingdom Alternative Vote referendum, 2011. One third of the council was up for election, with each successful candidate to serve a four-year term of office, expiring in 2015.
Elections to Bolton Metropolitan Borough Council were held on 3 May 2012. One third of the council was up for election, with each successful candidate to serve a four-year term of office, expiring in 2016.
Elections to Watford Borough Council were held on 3 May 2012. Three years in every four, a third of the council retires and elections are held.
The 1990 Bolton Metropolitan Borough Council election took place on 4 May 1990 to elect members of Bolton Metropolitan Borough Council in Greater Manchester, England. One third of the council was up for election and the Labour party kept overall control of the council
Elections to Bolton Metropolitan Borough Council were held on 22 May 2014, along with the European Parliament elections, 2014. One third of the council was up for election, with each successful candidate to serve a four-year term of office, expiring in 2018.
The 2014 Calderdale Metropolitan Borough Council election took place on 22 May 2014 to elect members of Calderdale Metropolitan Borough Council in England. This was on the same day as local elections across the United Kingdom and a European election. One councillor was elected in each of the 17 wards for a four-year term. There are three councillors representing each ward elected on a staggered basis so one third of the councillor seats were up for re-election. The seats had previously been contested in 2010 which was held in conjunction with a general election. The turnout was significantly lower in 2014 than in 2010 which is not unusual when comparing local elections that coincide with general elections to ones that do not. Prior to the election Labour was the largest party in the council with 21 out of 51 seats, 5 seats short of an overall majority. After the election there was no overall control of the council. Labour had 25 seats, only one short of a majority and so Labour continued to operate a minority administration.
The 2014 Basingstoke and Deane Borough Council election took place on 22 May 2014 to elect members of Basingstoke and Deane Borough Council in England. This was on the same day as other local elections.
The 2014 Havant Borough Council election took place on 22 May 2014 to elect members of Havant Borough Council in Hampshire, England. One third of the council was up for election and the Conservative party stayed in overall control of the council.
The 2010 St Helens Metropolitan Borough Council election took place on 6 May 2010 to elect members of St Helens Metropolitan Borough Council in Merseyside, England. One third of the council was up for election and the Labour party gained overall control of the council from no overall control.
The 2014 St Helens Metropolitan Borough Council election took place on 22 May 2014 to elect members of St Helens Metropolitan Borough Council in Merseyside, England. One third of the council was up for election and the Labour party stayed in overall control of the council.
Elections for Boston Borough Council, which governs as a second-tier authority the Borough of Boston were held on Thursday 7 May 2015. Following Boundary Commission changes between this election and the previous in 2011 to the wards, 30 councillors were elected to serve 15 wards. The election was held on the same day as other local elections.
The 2015 Colchester Borough Council election took place on 7 May 2015 to elect one third of the members of Colchester Borough Council in England. This was the same day as other local elections and as the General Election. Colchester Borough Council is made up of 60 councillors: 20 councillors were up for election.
The 2016 Bolton Metropolitan Borough Council election took place on 5 May 2016 to elect members of Bolton Metropolitan Borough Council in Greater Manchester, England. This was on the same day as other local elections.
The 2018 Bolton Metropolitan Borough Council election took place on 3 May 2018 to elect members of Bolton Council in Greater Manchester, England. This was on the same day as other local elections. The Labour Party retained overall control of the Council with a majority of 1.