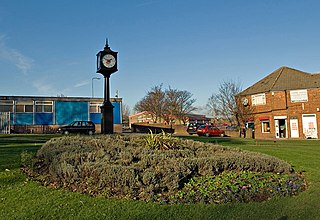
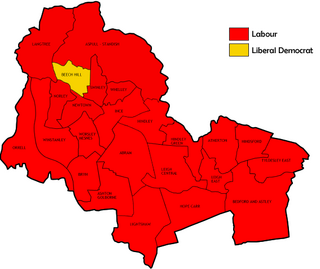
Elections to the Wigan council were held on Thursday, 5 May 1988, with one third of the seats up for election as well as an extra vacancy in Beech Hill. Following the previous election, two by-elections had taken place, with the Labour Party successfully defending their seats in Ince and Newtown. This year's election seen an improvement in participation, with all wards fought and five parties contesting in some form, by way of the Greens fielding their first ever slate of four candidates and the return of long-time Communist contender H. Kedward in Leigh Central. Despite this, the number of candidates contesting actually fell by five from the previous year's 64, as the turbulent new merger of the old SDP-Liberal Alliance, Social and Liberal Democrats, fielded just half the number of candidates they'd managed in 1987 and, at 11, the lowest since 1980.
The Metropolitan Borough of Wigan is a metropolitan borough of Greater Manchester, in North West England. It is named after its largest component town and former county borough, Wigan and includes the towns and villages of Leigh, part of Ashton-in-Makerfield, Ince-in-Makerfield, Hindley, Orrell, Standish, Atherton, Tyldesley, Golborne, Lowton, Billinge, Astley, Haigh and Aspull. The borough was formed in 1974 and is an amalgamation of several former local government districts and parishes. The borough has three civil parishes and lies directly to the west of the City of Salford and southwest of the Metropolitan Borough of Bolton. The local authority is Wigan Metropolitan Borough Council.
The Labour Party is a centre-left political party in the United Kingdom that has been described as an alliance of social democrats, democratic socialists and trade unionists. The party's platform emphasises greater state intervention, social justice and strengthening workers' rights.
Ince-in-Makerfield or Ince is a town in the Metropolitan Borough of Wigan, in Greater Manchester, England. The population of the Ince ward at the 2011 census was 13,486, but a southern part of Ince was also listed under the Abram ward. Adding on this area brings the total in 2011 to 15,664.
This was reflected by the results on the night as the SLD suffered a large drop in their vote, returning them to third place behind the Conservatives and reducing their vote total to four figure for the first time since the aforementioned 1980 election. The overwhelming beneficiary of SLD losses were the Labour, helping their vote share hit a record high of 68.6% and the highest vote figure gained - beyond the anomaly of 1979 - since the council's creation. Seat wise, Labour made two gains of the night, one in the SLD-Labour marginal of Aspull-Standish and the other in the more significant SLD bastion of Langtree, which until this point had only elected SLD candidates, where Labour managed to equal SLD votes and draw the larger straw. Labour achieved a record capture of seats, with opposition wins curtailed to an exceptional SLD performance - and gain - of one of the seats fought in Beech Hill and a Conservative hold in their bastion of Swinley. Overall turnout fell from 37.1% to 32.4%. [1]
The Conservative Party, officially the Conservative and Unionist Party, is a centre-right political party in the United Kingdom. The governing party since 2010, it is the largest in the House of Commons, with 313 Members of Parliament, and also has 249 members of the House of Lords, 18 members of the European Parliament, 31 Members of the Scottish Parliament, 12 members of the Welsh Assembly, eight members of the London Assembly and 8,916 local councillors.
Aspull is a village in the Metropolitan Borough of Wigan, in Greater Manchester, England. Historically in Lancashire, Aspull, along with Haigh, is surrounded by greenbelt and agricultural land, separated from Westhoughton, on its southeast side, by a brook running through Borsdane Wood. The ground rises from south to north, reaching 400 feet (122 m), and has views towards Winter Hill and the West Pennine Moors. It has a population of 4,977.
Standish is a large village in the Metropolitan Borough of Wigan, Greater Manchester, England. Historically in Lancashire, it is on the A49 road between Chorley and Wigan, near Junction 27 of the M6 motorway. The population of the village was 13,278 in the 2011 census.
Party | Seats | Gains | Losses | Net gain/loss | Seats % | Votes % | Votes | +/− | |
---|---|---|---|---|---|---|---|---|---|
Labour | 23 | 2 | 1 | +1 | 92.0 | 68.6 | 52,325 | +9.3% | |
Conservative | 1 | 0 | 0 | 0 | 4.0 | 17.1 | 13,083 | +1.8% | |
Social and Liberal Democrats | 1 | 1 | 2 | -1 | 4.0 | 12.6 | 9,640 | -10.5% | |
Green | 0 | 0 | 0 | 0 | 0.0 | 1.5 | 1,155 | +1.5% | |
Communist | 0 | 0 | 0 | 0 | 0.0 | 0.1 | 62 | +0.1% | |
This result had the following consequences for the total number of seats on the Council after the elections:
Party | Previous council | New council | |||
---|---|---|---|---|---|
Labour | 62 | 63 | |||
Social and Liberal Democrats | 6 | 5 | |||
Conservatives | 3 | 3 | |||
Independent Labour | 1 | 1 | |||
Green | 0 | 0 | |||
Communist | 0 | 0 | |||
Total | 72 | 72 | |||
Working majority | 52 | 54 |
Party | Candidate | Votes | % | ± | |
---|---|---|---|---|---|
Labour | A. Bennett | 2,094 | 86.8 | +6.8 | |
Green | P. Tarleton | 319 | 13.2 | +13.2 | |
Majority | 1,775 | 73.5 | +4.8 | ||
Turnout | 2,413 | 25.2 | -9.6 | ||
Labour hold | Swing | -3.2 | |||
Party | Candidate | Votes | % | ± | |
---|---|---|---|---|---|
Labour | T. Jones | 2,140 | 78.1 | +12.8 | |
Conservative | S. Edwards | 598 | 21.8 | +0.6 | |
Majority | 1,542 | 56.3 | +12.2 | ||
Turnout | 2,738 | 27.9 | -6.6 | ||
Labour hold | Swing | +6.1 | |||
Party | Candidate | Votes | % | ± | |
---|---|---|---|---|---|
Labour | A. Durkin | 2,201 | 47.9 | +6.6 | |
Social and Liberal Democrats | P. Wilson | 1,645 | 35.8 | -6.2 | |
Conservative | K. Hart | 751 | 16.3 | -0.4 | |
Majority | 556 | 12.1 | +11.4 | ||
Turnout | 4,597 | 43.5 | -5.9 | ||
Labour gain from Social and Liberal Democrats | Swing | +6.4 | |||
Party | Candidate | Votes | % | ± | |
---|---|---|---|---|---|
Labour | J. Clark | 2,755 | 81.8 | +5.6 | |
Conservative | M. Hatton | 613 | 18.2 | -5.6 | |
Majority | 2,142 | 63.6 | +11.3 | ||
Turnout | 3,368 | 35.9 | +0.9 | ||
Labour hold | Swing | +5.6 | |||
Party | Candidate | Votes | % | ± | |
---|---|---|---|---|---|
Labour | J. Jones | 1,954 | 62.5 | +4.0 | |
Conservative | D. Angell | 861 | 27.5 | +27.5 | |
Green | S. Philbrock | 310 | 9.9 | +9.9 | |
Majority | 1,093 | 35.0 | +18.0 | ||
Turnout | 3,125 | 31.5 | -2.7 | ||
Labour hold | Swing | -11.7 | |||
Party | Candidate | Votes | % | ± | |
---|---|---|---|---|---|
Social and Liberal Democrats | J. McGarty | 1,725 | 47.7 | +18.8 | |
Labour | T. Bishop | 1,621 | 44.9 | -12.3 | |
Social and Liberal Democrats | L. Marshall | 1,603 | |||
Labour | S. Turner | 1,437 | |||
Conservative | E. Bispham | 266 | 7.4 | -6.4 | |
Conservative | J. Whitehead | 194 | |||
Majority | 104 | 2.9 | -25.3 | ||
Turnout | 3,612 | 40.9 | +4.8 | ||
Social and Liberal Democrats gain from Labour | Swing | +15.5 | |||
Labour hold | Swing | ||||
Party | Candidate | Votes | % | ± | |
---|---|---|---|---|---|
Labour | C. Brown | 2,532 | 82.0 | +9.1 | |
Conservative | R. Clayton | 557 | 18.0 | +3.0 | |
Majority | 1,975 | 63.9 | +6.1 | ||
Turnout | 3,089 | 31.3 | -6.2 | ||
Labour hold | Swing | +3.0 | |||
Party | Candidate | Votes | % | ± | |
---|---|---|---|---|---|
Labour | A. Robinson | 2,394 | 87.2 | +54.5 | |
Green | A. Wood | 352 | 12.8 | +12.8 | |
Majority | 2,042 | 74.3 | +52.8 | ||
Turnout | 2,746 | 28.5 | -7.9 | ||
Labour hold | Swing | +20.8 | |||
Party | Candidate | Votes | % | ± | |
---|---|---|---|---|---|
Labour | S. Murphy | 2,198 | 80.6 | +8.4 | |
Social and Liberal Democrats | J. Cranfield | 530 | 19.4 | -8.4 | |
Majority | 1,668 | 61.1 | +16.9 | ||
Turnout | 2,728 | 24.1 | -4.1 | ||
Labour hold | Swing | +8.4 | |||
Party | Candidate | Votes | % | ± | |
---|---|---|---|---|---|
Labour | W. Smith | 2,543 | 78.6 | +14.6 | |
Conservative | M. Sharland | 691 | 21.4 | +21.4 | |
Majority | 1,852 | 57.3 | +29.3 | ||
Turnout | 3,234 | 30.2 | -1.7 | ||
Labour hold | Swing | -3.4 | |||
Party | Candidate | Votes | % | ± | |
---|---|---|---|---|---|
Labour | A. Roberts | 2,013 | 63.0 | +7.1 | |
Conservative | E. Manson | 1,183 | 37.0 | +5.8 | |
Majority | 830 | 26.0 | +1.3 | ||
Turnout | 3,196 | 32.1 | -4.0 | ||
Labour hold | Swing | +0.6 | |||
Party | Candidate | Votes | % | ± | |
---|---|---|---|---|---|
Labour | J. Horrocks | 2,074 | 89.0 | +1.2 | |
Conservative | D. Edwards | 165 | 7.1 | +1.1 | |
Social and Liberal Democrats | S. Cairns | 92 | 3.9 | -2.4 | |
Majority | 1,909 | 81.9 | +0.5 | ||
Turnout | 2,331 | 29.3 | -4.7 | ||
Labour hold | Swing | +0.0 | |||
Party | Candidate | Votes | % | ± | |
---|---|---|---|---|---|
Labour | J. Ball | 1,924 | 41.8 | +2.9 | |
Social and Liberal Democrats | K. White | 1,924 | 41.8 | -2.5 | |
Conservative | J. Wolstenholme | 753 | 16.4 | -0.4 | |
Majority | 0 | 0.0 | -5.5 | ||
Turnout | 4,601 | 42.0 | -4.3 | ||
Labour gain from Social and Liberal Democrats | Swing | +2.9 | |||
Party | Candidate | Votes | % | ± | |
---|---|---|---|---|---|
Labour | G. Macdonald | 2,032 | 82.1 | N/A | |
Conservative | M. Turner | 380 | 15.3 | N/A | |
Communist | H. Kedward | 62 | 2.5 | N/A | |
Majority | 1,652 | 66.8 | N/A | ||
Turnout | 2,474 | 27.6 | N/A | ||
Labour hold | Swing | N/A | |||
Party | Candidate | Votes | % | ± | |
---|---|---|---|---|---|
Labour | J. Riley | 1,973 | 70.9 | +9.2 | |
Conservative | M. Stewart | 810 | 29.1 | +5.1 | |
Majority | 1,163 | 41.8 | +4.1 | ||
Turnout | 2,783 | 27.0 | -2.3 | ||
Labour hold | Swing | +2.0 | |||
Party | Candidate | Votes | % | ± | |
---|---|---|---|---|---|
Labour | N. Holt | 2,857 | 73.3 | +14.7 | |
Conservative | J. Wright | 721 | 18.5 | -7.6 | |
Social and Liberal Democrats | J. Wilson | 318 | 8.2 | -7.1 | |
Majority | 2,136 | 54.8 | +22.3 | ||
Turnout | 3,896 | 36.8 | -2.1 | ||
Labour hold | Swing | +11.1 | |||
Party | Candidate | Votes | % | ± | |
---|---|---|---|---|---|
Labour | C. Hitchen | 2,352 | 86.5 | +9.5 | |
Conservative | I. Nicholson | 368 | 13.5 | +0.1 | |
Majority | 1,984 | 72.9 | +9.3 | ||
Turnout | 2,720 | 29.9 | -4.6 | ||
Labour hold | Swing | +4.7 | |||
Party | Candidate | Votes | % | ± | |
---|---|---|---|---|---|
Labour | E. Maddocks | 2,337 | 88.5 | +3.0 | |
Conservative | J. Carrington | 167 | 6.3 | -0.4 | |
Social and Liberal Democrats | R. Richardson | 136 | 5.1 | -2.6 | |
Majority | 2,170 | 82.2 | +4.4 | ||
Turnout | 2,640 | 33.5 | -4.0 | ||
Labour hold | Swing | +1.7 | |||
Party | Candidate | Votes | % | ± | |
---|---|---|---|---|---|
Labour | E. Swift | 2,262 | 59.9 | +13.5 | |
Conservative | W. Smith | 1,515 | 40.1 | +8.0 | |
Majority | 747 | 19.8 | +5.5 | ||
Turnout | 3,777 | 37.0 | -3.8 | ||
Labour hold | Swing | +2.7 | |||
Party | Candidate | Votes | % | ± | |
---|---|---|---|---|---|
Conservative | W. Chadwick | 2,019 | 48.3 | +8.3 | |
Labour | M. Gallagher | 1,627 | 38.9 | +1.9 | |
Social and Liberal Democrats | W. Claypole | 359 | 8.6 | -14.4 | |
Green | G. Wood | 174 | 4.1 | +4.1 | |
Majority | 392 | 3.4 | +6.4 | ||
Turnout | 4,179 | 46.7 | -6.3 | ||
Conservative hold | Swing | +3.2 | |||
Party | Candidate | Votes | % | ± | |
---|---|---|---|---|---|
Labour | A. Stephenson | 2,086 | 67.5 | +11.5 | |
Social and Liberal Democrats | A. Shaw | 1,003 | 32.5 | -11.5 | |
Majority | 1,083 | 35.0 | +23.0 | ||
Turnout | 3,089 | 28.7 | -6.9 | ||
Labour hold | Swing | +11.5 | |||
Party | Candidate | Votes | % | ± | |
---|---|---|---|---|---|
Labour | A. Coyle | 2,174 | 81.4 | +4.4 | |
Conservative | F. Sidebotham | 310 | 11.6 | -0.6 | |
Social and Liberal Democrats | L. Peet | 185 | 6.9 | -3.8 | |
Majority | 1,864 | 69.8 | +5.0 | ||
Turnout | 2,669 | 30.3 | -5.7 | ||
Labour hold | Swing | +2.5 | |||
Party | Candidate | Votes | % | ± | |
---|---|---|---|---|---|
Labour | R. Winkworth | 2,031 | 54.1 | +11.8 | |
Social and Liberal Democrats | C. Hilton | 1,723 | 45.9 | +1.1 | |
Majority | 308 | 8.2 | +5.7 | ||
Turnout | 3,754 | 32.1 | -10.1 | ||
Labour hold | Swing | +5.3 | |||
Party | Candidate | Votes | % | ± | |
---|---|---|---|---|---|
Labour | W. Brogan | 2,151 | 85.8 | +12.1 | |
Conservative | J. Grimshaw | 355 | 14.2 | +4.8 | |
Majority | 1,796 | 71.7 | +14.9 | ||
Turnout | 2,506 | 25.3 | -6.2 | ||
Labour hold | Swing | +3.6 | |||
The 2005 United Kingdom general election was held on Thursday 5 May 2005, to elect 646 members to the House of Commons. The Labour Party led by Tony Blair won its third consecutive victory, with Blair becoming the only Labour leader beside Harold Wilson to form three majority governments. However, its majority now stood at 66 seats compared to the 160-seat majority it had previously held. As of 2019, it remains the last general election victory for the Labour Party.
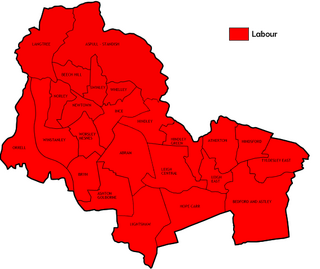
Elections to Wigan Council were held on 7 May 1998. One third of the council was up for election. Following the previous election there had been three by-elections held—in Aspull-Standish, Ince and Hope Carr—with all three successfully defended by Labour.
Elections to Wigan Council were held on 6 May 1999. One-third of the council was up for election. Prior to the election, the Liberal Democrats had gained the seat being fought in Beech Hill from Labour in a by-election, and long-time Labour councillor for Atherton, Jack Sumner, had defected to independent.
Elections to Wigan Council were held on 4 May 2000. One-third of the council was up for election, as well as an extra vacancy in Norley - both of which were uncontested. Since the election, there had been a by-election in which the Liberal Democrats gained the seat being fought in Hindsford from Labour.
Elections to Wigan Council were held on 2 May 2002, with one-third of the council to be re-elected. There had been a number of by-elections in the gap year, with a Labour gain from the Liberal Democrats in Hindsford, effectively cancelling out an earlier loss to them in Atherton. A Labour hold in Hope Carr in-between left both parties unchanged going into the election.
Elections to Wigan Council were held on 1 May 2003 with one-third of the council was up for election. Prior to the election, there had been two vacancies in Leigh Central, with Labour winning a by-election in June and the seat being fought in this election filled unopposed by Barbara Jarvis.
The 2010 Sunderland Council election took place on 6 May 2010 to elect members of Sunderland Metropolitan Borough Council in Tyne and Wear, England. One third of the council was up for election and the Labour party stayed in overall control of the council. The election took place on the same day as the 2010 General Election.
The 2008 Sandwell Metropolitan Borough Council election took place on 1 May 2008 to elect members of Sandwell Metropolitan Borough Council in the West Midlands, England. One third of the council was up for election and the Labour party stayed in overall control of the council.
The 2011 council elections in Guildford saw the Conservatives retain control over Guildford Borough Council with an increased majority of 20 seats. Full results for each ward can be found at Guildford Council election, full results, 2011.
'All-out' elections to the Wigan Council were held on 1 May 1980, following extensive boundary changes and entirely new wards, yet retaining the number of 24 wards with three seats each for a total of 72 seats. The results were comparable to the 1973 election, with Labour rewarded a crushing majority in seats for approaching 60% of the vote with their main competitors, the Conservatives, falling to under 30%. The Liberals seen their highest representation yet by way of winning all three seats in Langtree.
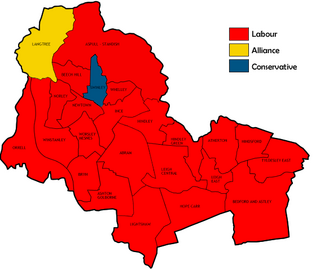
Elections to the Wigan council were held on Thursday, 8 May 1986, with one third of the seats scheduled for re-election. Since the previous election three by-elections had taken place, with Labour gaining the seat being fought in Orrell from the Conservatives as well as holding their seats in Bedford-Astley and Beech Hill. The election seen fewer contestants than any previous election since the council's creation in 1973, with a record of four seats unchallenged. Even amongst those contested there were no minor parties represented, the fewest Alliance candidates since the 1980 election and a record low of Conservative contenders at sixteen. The results were similarly record-breaking as Labour won twenty two seats, with the Conservative and Alliance majorities in their respective heartland wards - and only holds - of Swinley and Langtree reduced to slender majorities. Labour won a high of 65% share of the vote, conversely the Conservatives share fell to a low of 13.1%, with their actual vote dropping into four figures for the first time. Overall turnout rose from the preceding year's underwhelming figure of 29.2%, to a more commonplace 35.8%.
Elections to the Wigan council were held on Thursday, 3 May 1990, with one third of the seats up for election with an additional vacancy in Bryn. Previous to the election there had also been a by-election in Abram, which the Labour Party successfully defended. Despite a wider array of parties - mainly a product from the fractious SLD merger - contesting the election, in several ways it beat 1986's lows in participation. A record of six seats went uncontested as one quarter of the council's wards held no elections, with the Conservatives contesting one half of the wards and the SLD one quarter. The Greens repeated their last year's total of four candidates, but with only two in the same wards as previous. Elsewhere, Independent John Vickers fought his first of many elections in Hindley Green and the respective Social Democrat and Liberal sides opposed to Alliance merging into the SLD fielded a sole candidate each - the latter of which having previously came within a straw of winning Langtree for the SLD.
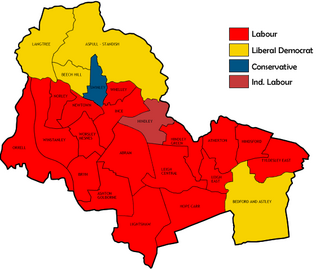
Elections to the Wigan council were held on Thursday, 2 May 1991, with one third scheduled for re-election. Like the last election, this seen a wider variety of party candidates than most previous, but only marginally improved upon the nadir of the year before in terms of candidates, with four wards uncontested, Conservatives fighting just above one half of the seats and the Liberal Democrats just under - although the Lib Dems near doubled last year's total, both were historically disappointing. Minor party participation consisted of three Independent Labour candidates - including a former Beech Hill Labour councillor - two Liberals, a return of an Independent in Hindley Green and one remaining Green - their lowest fielded when participating - in Atherton.
Elections to the Wigan council were held on Thursday, 5 May 1994, with one third of the seats up for election. Prior to the election, Labour had defended their seats in two by-elections for Abram and Hindley. The election suffered from a mixture of a poor contesting rate and low voter turnout. The number of candidates contesting was just 50, the lowest since 1975, with four wards going unopposed, and Lib Dems back to fighting a half of the seats, and the Conservatives less than two-thirds. The only other opposition standing were three Independent Labour candidates, one of which was the previous - but since deselected - Labour incumbent for the seat being fought in Worsley Mesnes. Voter turnout rose from the previous election's nadir, but at 30.4%, still well below average.
Elections were held on Thursday, 4 May 1995, with one third of the seats set for re-election, with an extra vacancy in Leigh East. Ahead of this election Labour had gained the seat being fought in Beech Hill from the Liberal Democrats, and defended a seat in Worsley Mesnes in by-elections. The major parties marginally increased their number of candidates upon last year's totals, whereas the number of Independent Labour candidates fighting returned to just the incumbent in Hindley. Having been the only party opposing Labour in Atherton, the Independent Labour absence there meant that went uncontested this time round, alongside two of last year's unopposed wards, Ince and Leigh Central. In total unopposed wards were reduced from the previous year's four to three. Turnout fell to 26.4%, the second lowest in the council's history, only surpassing the 1992 nadir.
Elections to Wigan council were held on Thursday, 2 May 1996, with an extra vacancy in Abram to be filled. Going into the election there were noticeably fewer candidates than usual, with the total candidate number and the five uncontested wards only narrowly lower than the all-time lows set at the 1990 election. This was mainly caused by the lack of any minor party candidates, and the Liberal Democrat slate dropping by half upon the previous election, to seven - their scarcest outing since their lowest ebb throughout their merger in 1990, but more reminiscent of their patchy participation of the seventies. Turnout had been consistently poor in recent elections, and this election continued the downward trend, dropping below a quarter of the electorate for the second time to 24.2%.
The Leeds municipal elections were held on Thursday 10 May 1962, with one third of the council to be elected.
The Leeds municipal elections were held on Thursday 1 November 1945. Although a third of the council would ordinarily be up for election, the suspension of elections during World War II meant the council had last held elections in 1938, and with the amount of vacancies and co-options throughout near to two-thirds of the council needed electing.
The Leeds City Council elections were held on Thursday, 4 May 1990, with one third of the council and vacancies in Beeston and North to be elected. There had been a number of by-elections in the interim, resulting in two Labour gains in Armley and Burmantofts from the Social and Liberal Democrats and holds elsewhere.
The 2011 South Oxfordshire District Council election was held on 5 May 2011 to elect members of South Oxfordshire District Council in England. This was on the same day as other local elections.