Wigan Metropolitan Borough Council election, 2008

Last updated

Map of the results of the 2008 Wigan council election. Labour in red, Conservatives in blue, independent in grey, Community Action Party in green and Liberal Democrats in yellow. Wigan UK local election 2008 map.svg
Map of the results of the 2008 Wigan council election. Labour in red, Conservatives in blue, independent in grey, Community Action Party in green and Liberal Democrats in yellow.

Elections to Wigan Council were held on 1 May 2008. One-third of the council was up for election. [1] [2] [3]

Metropolitan Borough of Wigan Metropolitan borough in England

The Metropolitan Borough of Wigan is a metropolitan borough of Greater Manchester, in North West England. It is named after its largest component town and former county borough, Wigan and includes the towns and villages of Leigh, part of Ashton-in-Makerfield, Ince-in-Makerfield, Hindley, Orrell, Standish, Atherton, Tyldesley, Golborne, Lowton, Billinge, Astley, Haigh and Aspull. The borough was formed in 1974 and is an amalgamation of several former local government districts and parishes. The borough has three civil parishes and lies directly to the west of the City of Salford and southwest of the Metropolitan Borough of Bolton. The local authority is Wigan Metropolitan Borough Council.

Contents

Election result

Wigan Local Election Result 2008
PartySeatsGainsLossesNet gain/lossSeats %Votes %Votes+/−
  Labour 12 1 5 -4 48.0 37.3 26,353 -5.9%
  Conservative 6 4 0 +4 24.0 26.0 18,360 +5.0%
  Independent 4 2 0 +2 16.0 8.9 6,260 +5.7%
  Community Action 2 0 2 -2 8.0 13.9 9,830 -1.9%
  Liberal Democrat 1 0 0 0 4.0 8.6 6,054 -1.5%
  BNP 0 0 0 0 0 3.3 2,352 -0.3%
  UKIP 0 0 0 0 0 1.3 912 +0.8%
  Respect 0 0 0 0 0.0 0.3 222 +0.3%

This result had the following consequences for the total number of seats on the Council after the elections:

PartyPrevious councilNew council
Labour 46 42
Conservative 10 14
Community Action 10 8
Independent 5 7
Liberal Democrat 4 4
BNP 0 0
UKIP 0 0
Respect 0 0
Total 75 75
Working majority 17  9 

Ward results

Abram

Abram [2] [3]
PartyCandidateVotes%±
Labour Eddie Russon 1,226 47.8 -7.3
Community Action John Shale 934 36.7 +14.5
Conservative Marion Green 386 15.0 +4.7
Rejected ballots 11 0.4 +0.2
Majority 283 11.0 -21.8
Turnout 2,566 25.2 +0.4
Labour hold Swing -10.9

Ashton

Ashton [2] [3]
PartyCandidateVotes%±
Community Action Paul Tushingham 1,766 53.4 +8.0
Labour Ann Rampling 1,111 33.6 -6.5
Conservative Marie Winstanley 248 7.5 -0.7
BNP Adrian Jones 178 5.4 -0.8
Rejected ballots 7 0.2 +0.1
Majority 655 19.8 +14.5
Turnout 3,310 36.9 +2.5
Community Action hold Swing +7.2

Aspull New Springs Whelley

Aspull, New Springs, Whelley [2] [3]
PartyCandidateVotes%±
Labour John Hilton 1,443 43.0 -10.1
Liberal Democrat Alan Robinson 1,254 37.4 +8.8
Conservative Anthony Hind 640 19.1 +6.1
Rejected ballots 17 0.5 +0.1
Majority 189 5.6 -18.9
Turnout 3,354 34.4 -1.2
Labour hold Swing -9.4

Astley Mosley Common

Astley Mosley Common [2] [3]
PartyCandidateVotes%±
Conservative Sean Ell 1,207 42.0 +12.3
Labour Brian Wilson 1,014 35.3 -2.6
Liberal Democrat Gavin Clements 684 22.1 -2.0
Rejected ballots 18 0.6 +0.1
Majority 193 6.7 -1.5
Turnout 2,873 30.9 +2.3
Conservative gain from Labour Swing +7.4

Atherleigh

Atherleigh [2] [3]
PartyCandidateVotes%±
Labour Susan Loudon 1,246 58.7 +6.6
Conservative Abigail Solomon 858 40.4 +23.1
Rejected ballots 20 0.9 +0.5
Majority 388 18.3 -3.6
Turnout 2,124 26.4 -0.4
Labour hold Swing -8.2

Atherton

Atherton [2] [3]
PartyCandidateVotes%±
Independent Bob Splaine 976 29.5 +29.5
Labour Elnur Yusifzade 858 25.8 -19.5
Liberal Democrat David Higginbottom 821 24.8 -12.9
Conservative Michael Nicholls 416 12.9 +1.9
Respect Stephen Hall 221 6.7 +6.7
Rejected ballots 13 0.4 +0.1
Majority 120 3.6 -4.0
Turnout 3,314 31.4 +1.9
Independent hold Swing +24.5

Bryn

Bryn [2] [3]
PartyCandidateVotes%±
Independent Don Hodgkinson 1,606 49.2 -3.1
Labour Helen Ash 765 23.4 -8.9
Community Action Clive Charles 384 12.1 +12.1
BNP Ken Haslam 284 8.7 -0.9
Conservative Malcolm Childs 204 6.2 +0.6
Rejected ballots 13 0.4 +0.2
Majority 841 25.8 +5.8
Turnout 3,266 36.2 +1.9
Independent hold Swing +2.9

Douglas

Douglas [2] [3]
PartyCandidateVotes%±
Labour Joy Birch 1,170 51.4 -6.6
Community Action Anthony Unsworth 745 32.7 +7.3
Conservative Stephen Holt 350 15.4 -0.8
Rejected ballots 12 0.5 +0.1
Majority 425 18.7 -13.9
Turnout 2,277 24.6 +0.2
Labour hold Swing -6.9

Golborne Lowton West

Golborne Lowton West [2] [3]
PartyCandidateVotes%±
Labour Yvonne Klieve 1,186 41.0 -15.4
Community Action Peter Franzen 1,110 38.4 +9.6
Conservative John Oxley 282 9.8 -4.6
BNP Steven McEllenborough 178 6.2 +6.2
Independent Frank Davies 129 4.5 +4.5
Rejected ballots 7 0.2 -0.2
Majority 76 2.6 -25.0
Turnout 2,892 32.9 +2.5
Labour gain from Community Action Swing -12.5

Hindley

Hindley [2] [3]
PartyCandidateVotes%±
Independent Jim Ellis 1,347 47.4 +47.4
Labour Marcia Dooley 694 24.5 -20.8
Independent David Culshaw 515 18.1 +18.1
Conservative Margaret Winstanley 277 9.7 -1.2
Rejected ballots 7 0.2 -0.1
Majority 1,166 41.0 +39.1
Turnout 2,842 29.1 +2.4
Independent gain from Labour Swing +34.1

Hindley Green

Hindley Green [2] [3]
PartyCandidateVotes%±
Independent Bob Brierley 1,105 44.7 +44.7
Labour Martin Long 981 26.5 -3.6
Conservative Stuart Foy 353 14.3 +3.9
Community Action Rachel Fagan 351 14.2 -17.2
Rejected ballots 10 0.4 +0.1
Majority 450 18.2 +16.9
Turnout 2,474 28.9 +2.4
Independent gain from Labour Swing +24.1

Ince

Ince [2] [3]
PartyCandidateVotes%±
Labour David Molyneux 1,180 60.5 -5.9
Community Action Syd Hall 479 24.6 +2.0
Conservative Raymond Whittingham 275 14.1 +3.8
Rejected ballots 15 0.8 +0.2
Majority 701 36 -7.9
Turnout 1,949 23.0 -0.6
Labour hold Swing -3.9

Leigh East

Leigh East [2] [3]
PartyCandidateVotes%±
Labour Keith Cunliffe 981 43.8 -4.3
Conservative Dorothy Angell 649 29.0 +9.0
Liberal Democrat Gordon Jackson 597 26.4 -4.7
Rejected ballots 17 0.8 +0.0
Majority 332 14.8 -2.2
Turnout 2,238 24.8 -2.2
Labour hold Swing -6.6

Leigh South

Leigh South [2] [3]
PartyCandidateVotes%±
Labour Kevin Anderson 1,372 41.2 -2.1
Conservative Andrew Oxley 1,000 30.1 +6.6
Community Action Ian Franzen 476 14.3 -9.5
BNP Gary Chadwick 470 14.1 +5.1
Rejected ballots 9 0.3 -0.2
Majority 372 11.2 -8.3
Turnout 3,327 32.6 +1.5
Labour hold Swing -4.3

Leigh West

Leigh West [2] [3]
PartyCandidateVotes%±
Labour Susan Greensmith 1,543 64.3 +10.3
Conservative Denise Young 817 34.0 +22.7
Rejected ballots 40 1.7 +1.3
Majority 726 30.3 -0.2
Turnout 2,400 22.9 -0.9
Labour hold Swing -6.2

Lowton East

Lowton East [2] [3]
PartyCandidateVotes%±
Conservative James Grundy 1,972 53.6 +29.9
Community Action Ian Franzen 943 25.6 -17.4
Labour James Cowley 758 20.6 -12.3
Rejected ballots 8 0.2 -0.2
Majority 1,029 28.0 +17.9
Turnout 3,681 37.9 +4.3
Conservative gain from Community Action Swing +23.6

Orrell

Orrell [2] [3]
PartyCandidateVotes%±
Conservative Richard Clayton 1,608 46.5 +1.3
Labour Mike Barnes 969 28.0 -7.6
BNP Charles Mather 548 15.8 +1.5
Independent Richard Clayton 321 9.3 +9.3
Rejected ballots 12 0.3 +0.0
Majority 639 18.5 +8.9
Turnout 3,458 37.9 -2.4
Conservative hold Swing +4.4

Pemberton

Pemberton [2] [3]
PartyCandidateVotes%±
Labour Jeanette Prescott 1,387 55.7 -1.9
Community Action Mike Leyland 406 16.3 -0.3
Conservative Benjamin Gray 350 14.1 +2.1
BNP Chris Hilton 334 13.4 -0.1
Rejected ballots 14 0.6 +0.2
Majority 981 39.4 -1.6
Turnout 2,491 25.9 +1.0
Labour hold Swing -0.8

Shevington with Lower Ground

Shevington with Lower Ground [2] [3]
PartyCandidateVotes%±
Conservative Paul Liptrot 1,531 48.4 +6.5
Labour Mike Crosby 971 30.7 -7.3
Liberal Democrat Martin Sutton 251 7.9 -1.5
UKIP John Atherton 251 7.9 -2.3
Independent Andy Sumner 157 5.0 +5.0
Rejected ballots 2 0.1 -0.3
Majority 560 17.7 +13.8
Turnout 3,163 34.2 -0.7
Conservative gain from Labour Swing +6.9

Standish with Langtree

Standish with Langtree [2] [3]
PartyCandidateVotes%±
Conservative Judith Atherton 1,710 50.8 -7.1
Labour George Davies 1,039 30.9 +2.3
UKIP Alan Freeman 283 8.4 +8.4
Liberal Democrat June Garner 214 6.4 -6.6
Community Action Ronnie Barnes 116 3.4 +3.4
Rejected ballots 5 0.1 -0.4
Majority 671 19.9 -9.4
Turnout 3,367 35.6 -0.9
Conservative gain from Labour Swing -4.7

Tyldesley

Tyldesley [2] [3]
PartyCandidateVotes%±
Liberal Democrat Robert Bleakley 1,827 65.7 +2.7
Labour Barry Taylor 621 22.0 +6.7
Conservative Hilary Hayden 313 11.3 -1.4
Rejected ballots 29 1.0 +0.9
Majority 1,215 43.7 -4.0
Turnout 2,781 27.8 -0.8
Liberal Democrat hold Swing -2.0

Wigan Central

Wigan Central [2] [3]
PartyCandidateVotes%±
Conservative Henry Cadman 1,562 50.3 +6.1
Labour Mathew Bullen 940 30.2 -2.8
UKIP Keith Jones 378 12.2 +12.2
Community Action Leanne Brotherton 213 6.9 +0.0
Rejected ballots 15 0.5 +0.2
Majority 622 20.0 +8.8
Turnout 3,108 34.3 -0.3
Conservative hold Swing +4.4

Wigan West

Wigan West [2] [3]
PartyCandidateVotes%±
Labour Terence Halliwell 1,089 43.7 -3.7
Conservative Steven Surples 471 18.9 -0.3
Liberal Democrat Darren Atherton 462 18.6 +18.6
BNP Susan Mather 360 14.5 +0.7
Independent Mick Dahl 104 4.2 +4.2
Rejected ballots 4 0.2 -0.2
Majority 618 24.8 -3.4
Turnout 2,490 25.0 -3.6
Labour hold Swing -1.7

Winstanley

Winstanley [2] [3]
PartyCandidateVotes%±
Community Action Stanley Barnes 1,226 46.9 +7.7
Labour Phil Kelly 869 33.4 -10.0
Conservative Paula Thompson 508 19.5 +2.4
Rejected ballots 9 0.3 +0.0
Majority 357 13.7 +9.6
Turnout 2,612 29.8 -2.2
Community Action hold Swing +8.8

Worsley Mesnes

Worsley Mesnes [2] [3]
PartyCandidateVotes%±
Labour Brian Baldwin 1,275 55.1 -0.2
Community Action Hannah Leyland 662 28.6 +3.0
Conservative Jonathan Cartwright 363 15.7 +4.2
Rejected ballots 16 0.7 +0.3
Majority 613 26.5 -3.2
Turnout 2,316 26.4 -1.3
Labour hold Swing -1.6

By-elections between 2008 and 2010

Wigan West By-Election 10 July 2008 [4] [5]
PartyCandidateVotes%±
Labour Steve Dawber 817 38.3 -5.4
Conservative Jonathan Cartwright 528 24.8 +5.9
Liberal Democrat Trevor Beswick 344 16.1 -2.5
BNP Christopher Hilton 200 9.4 -5.1
UKIP Keith Jones 124 5.8 +5.8
Independent Sandy Franzen 118 5.5 +1.3
Majority 289 13.5 -11.3
Turnout 2,131 21.0 -4.0
Labour hold Swing -5.6

Related Research Articles

England First Party

The England First Party (EFP) was an English nationalist political party. It had two councillors on Blackburn with Darwen council between 2006 and 2007.

1998 Wigan Metropolitan Borough Council election

Elections to Wigan Council were held on 7 May 1998. One third of the council was up for election. Following the previous election there had been three by-elections held—in Aspull-Standish, Ince and Hope Carr—with all three successfully defended by Labour.

1999 Wigan Metropolitan Borough Council election

Elections to Wigan Council were held on 6 May 1999. One-third of the council was up for election. Prior to the election, the Liberal Democrats had gained the seat being fought in Beech Hill from Labour in a by-election, and long-time Labour councillor for Atherton, Jack Sumner, had defected to independent.

2000 Wigan Metropolitan Borough Council election

Elections to Wigan Council were held on 4 May 2000. One-third of the council was up for election, as well as an extra vacancy in Norley - both of which were uncontested. Since the election, there had been a by-election in which the Liberal Democrats gained the seat being fought in Hindsford from Labour.

2002 Wigan Metropolitan Borough Council election

Elections to Wigan Council were held on 2 May 2002, with one-third of the council to be re-elected. There had been a number of by-elections in the gap year, with a Labour gain from the Liberal Democrats in Hindsford, effectively cancelling out an earlier loss to them in Atherton. A Labour hold in Hope Carr in-between left both parties unchanged going into the election.

2003 Wigan Metropolitan Borough Council election

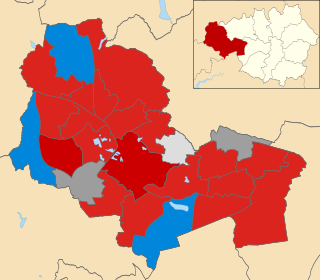
Elections to Wigan Council were held on 1 May 2003 with one-third of the council was up for election. Prior to the election, there had been two vacancies in Leigh Central, with Labour winning a by-election in June and the seat being fought in this election filled unopposed by Barbara Jarvis.

2004 Wigan Metropolitan Borough Council election

Elections to Wigan Council were held on 10 June 2004. The whole council was up for election with boundary changes since the last election in 2003 increasing the number of councillors by three. The Labour party kept overall control of the council.

2006 Wigan Metropolitan Borough Council election

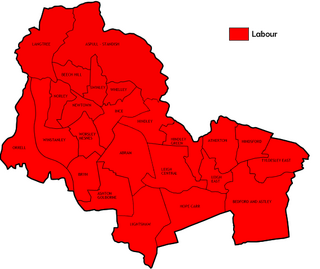
Elections to Wigan Council were held on 4 May 2006. One-third of the council was up for election and the Labour party kept overall control of the council. Overall turnout was 29.2%.

Wigan Town in Greater Manchester, England

Wigan is a town in Greater Manchester, England, on the River Douglas, 10 miles (16 km) south-west of Bolton, 12 miles (19 km) north of Warrington and 17 miles (27.4 km) west-northwest of Manchester. Wigan is the largest settlement in the Metropolitan Borough of Wigan and is its administrative centre. The town has a population of 103,608, whilst the wider borough has a population of 318,100.

2003 Barnsley Metropolitan Borough Council election

The 2003 Barnsley Metropolitan Borough Council election took place on 1 May 2003 to elect members of Barnsley Metropolitan Borough Council in South Yorkshire, England. One third of the council was up for election and the Labour party stayed in overall control of the council.

1973 Wigan Metropolitan Borough Council election

The 1973 Wigan Council elections for the First Wigan Metropolitan Borough Council were held on 10 May 1973, with the entirety of the 72 seat council - three seats for each of the 24 wards - up for vote. It was the first council election as the newly formed metropolitan borough under a new constitution. The Local Government Act 1972 stipulated that the elected members were to shadow and eventually take over from the predecessor corporation on 1 April 1974. The order in which the councillors were elected dictated their term serving, with third-place candidates serving two years and up for re-election in 1975, second-placed three years expiring in 1976 and 1st-placed five years until 1978.

2007 Wigan Metropolitan Borough Council election

Elections to Wigan Council were held on 3 May 2007 with one third of the seats up for election.

2010 Wigan Metropolitan Borough Council election

Elections to Wigan Council were held on 6 May 2010. One-third of the council was up for election.

2011 Wigan Metropolitan Borough Council election

Elections to Wigan Council were held in May 2011. One-third of the council was up for election. These elections were held as part of the United Kingdom local elections, 2011.

2012 Wigan Metropolitan Borough Council election

The 2012 Wigan Council elections to the Thirtieth Wigan Council were held on 3 May 2012, the same day as other local elections. One-third of the council was up for election.

2015 Wigan Metropolitan Borough Council election

The 2015 Wigan Metropolitan Borough Council election took place on 7 May 2015 to elect members of Wigan Metropolitan Borough Council in England. This was on the same day as other local elections and the general election.

2016 Wigan Metropolitan Borough Council election

The 2016 Wigan Metropolitan Borough Council election took place on 5 May 2016 to elect members of Wigan Metropolitan Borough Council in England. This was on the same day as other local elections.

2018 Wigan Metropolitan Borough Council election

The 2018 Wigan Metropolitan Borough Council election took place on 3 May 2018 to elect members of Wigan Metropolitan Borough Council in England. This was on the same day as other local elections.

2019 Wigan Metropolitan Borough Council election

The 2019 Wigan Metropolitan Borough Council election is scheduled to be held on Thursday 2 May 2019 to elect members of Wigan Metropolitan Borough Council in England. This will be on the same day as other local elections.

References