Birmingham City Council election, 2008

Last updated

Birmingham City Council election, 2008
Birmingham City Flag.svg
  2007 1 May 2008 2010  

One third (40) seats to Birmingham City Council
61 seats needed for a majority

  First party Second party Third party
 
Party Conservative Labour Liberal Democrat
Seats won 49 36 32
Seat changeIncrease2.svg 6Decrease2.svg 6Steady2.svg
Popular vote 68,190 67,922 52,454
Percentage 30.1% 30.0% 23.2%

Birmingham wards 2008.png

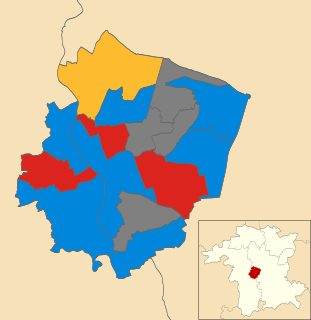
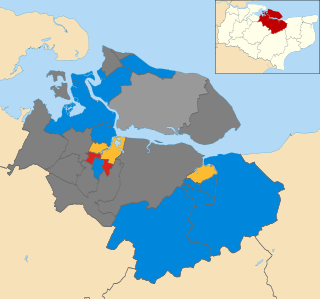
2008 local election results in Birmingham.

Council control before election

No Overall Control

Council control after election

No Overall Control

Elections to Birmingham City Council in England were held on 1 May 2008. One third of the council was up for election and the council stayed under no overall control as it had been since 2003. [1]

Birmingham City Council Local government body for the English city

Birmingham City Council is the local government body responsible for the governance of the City of Birmingham in England, which has been a metropolitan district since 1974. It is the most populated local council in the United Kingdom with, following a reorganisation of boundaries in June 2004, 120 Birmingham City councillors representing over one million people, in 40 wards. This means that Birmingham is technically the largest city in the United Kingdom. The council headquarters are at the Council House in the city centre. The council is responsible for running nearly all local services, with the exception of those run by joint boards. The provision of certain services has in recent years been devolved to several council constituencies, which each have a constituency committee made up of councillors from that district.

In the context of local authorities in the United Kingdom, the term no overall control refers to a situation in which no single political group achieves a majority of seats; and is analogous to a hung parliament. Of the 310 councils who had members up for election in the 2007 local elections, 85 resulted in a NOC administration.

Contents

230 candidates stood in the election for the 40 seats that were contested. Five parties contested every ward in Birmingham, the Conservatives, Labour, Liberal Democrats, British National Party and the Greens. [2] Overall turnout across the city was 31.2%

Conservative Party (UK) Political party in the United Kingdom

The Conservative Party, officially the Conservative and Unionist Party, is a centre-right political party in the United Kingdom. Presently led by Theresa May, it has been the governing party since 2010. It presently has 314 Members of Parliament in the House of Commons, 249 members of the House of Lords, and 18 members of the European Parliament. It also has 31 Members of the Scottish Parliament, 12 members of the Welsh Assembly, eight members of the London Assembly and 9,008 local councillors. One of the major parties of UK politics, it has formed the government on 45 occasions, more than any other party.

The Labour Party is a centre-left political party in the United Kingdom which has been described as an alliance of social democrats, democratic socialists and trade unionists. The party's platform emphasises greater state intervention, social justice and strengthening workers' rights.

Liberal Democrats (UK) Political party in the United Kingdom

The Liberal Democrats are a liberal political party in the United Kingdom. They presently have 11 Members of Parliament in the House of Commons, 96 members of the House of Lords, and one member of the European Parliament. They also have five Members of the Scottish Parliament and a member each in the Welsh Assembly and London Assembly. The party reached the height of its influence in the early 2010s, forming a junior partner in a coalition government from 2010 to 2015. It is presently led by Vince Cable.

The results saw the Conservative party gain significantly, winning 6 seats from the Labour party and Respect gain an independent seat. [1] The Liberal Democrats were pleased to hold all their seats. [3] As a result, the Conservative and Liberal Democrat ruling coalition increased their majority to hold 75% of the seats on the council. [3] Both Conservatives and Liberal Democrats attributed their success to below inflation council tax rises and the national unpopularity of the Labour government. [3] [4]

Election result

Birmingham Local Election Result 2008
PartySeatsGainsLossesNet gain/lossSeats %Votes %Votes+/−
  Conservative 49Increase2.svg 6Steady2.svgIncrease2.svg 6 45.0 30.1 68,190
  Labour 36Steady2.svgDecrease2.svg 6Decrease2.svg 6 20.0 30.0 67,922
  Liberal Democrat 32Steady2.svgSteady2.svgSteady2.svg 32.5 23.2 52,454
  Respect 1Increase2.svg 1Steady2.svgIncrease2.svg 1 2.5 3.3 7,466
  BNP 0Steady2.svgSteady2.svgSteady2.svg 0 7.4 16,806
  Green 0Steady2.svgSteady2.svgSteady2.svg 0 4.1 9,251
  UKIP 0Steady2.svgSteady2.svgSteady2.svg 0 0.7 1,688
  Community Independent 0Steady2.svgSteady2.svgSteady2.svg 0 0.4 905
  Independent 0Steady2.svgDecrease2.svg 1Decrease2.svg 1 0 0.4 852
  Socialist Labour 0Steady2.svgSteady2.svgSteady2.svg 0 0.3 781
  National Front 0Steady2.svgSteady2.svgSteady2.svg 0 0.1 265

Council Composition

After the election the composition of the council was:

4936323
ConservativeLabourLib DemRespect

Ward results

Acocks Green ward
PartyCandidateVotes%±
Liberal Democrat Roger Harmer 2,743 51.5
Labour John O'Shea 1,125 21.1
BNP Tanya Whitehead 617 11.6
Conservative Emma Mahay 598 11.2
Green Amanda Baker 234 4.4
Majority 1,618 30.4
Turnout 5,317 27.4
Liberal Democrat hold Swing
Aston ward
PartyCandidateVotes%±
Liberal Democrat Ayoub Khan 2,769 38.6
Labour Amjad Hussain 2,417 33.7
Respect Abdul Aziz 1,406 19.6
Conservative Olam Nyeko 206 2.9
Green David Goley 118 1.7
UKIP Abdul Azad 113 1.6
BNP Alan Chamberlain 105 1.5
Majority 352 4.9
Turnout 7,134 38.0
Liberal Democrat hold Swing
Bartley Green ward
PartyCandidateVotes%±
Conservative Vivienne Barton 3,422 64.4
Labour Tom Guise 1,004 18.9
BNP Terrence Larkin 436 8.2
Liberal Democrat Julia Garrett 262 4.9
Green James Robertson 180 3.4
Majority 2,418 45.5
Turnout 5,304 30.1
Conservative hold Swing
Billesley ward
PartyCandidateVotes%±
Conservative Leonard Gregory 2,832 49.0
Labour Martin Welds 1,633 28.2
BNP Michael Bell 663 11.5
Liberal Democrat Robert Wagg 414 7.2
Green Catherine Manhood 236 4.1
Majority 1,199 20.8
Turnout 5,778 30.9
Conservative hold Swing
Bordesley Green ward
PartyCandidateVotes%±
Liberal Democrat Shaukat Khan 3,558 44.8
Labour Zafar Dad 3,427 43.1
Conservative Mary Storer 415 5.2
BNP Graham Jones 264 3.3
Green Hazel Clawley 248 3.1
Majority 131 1.7
Turnout 7,912 40.3
Liberal Democrat hold Swing
Bournville ward
PartyCandidateVotes%±
Conservative Nigel Dawkins 3,701 51.2
Labour Nathan Matthew 1,395 19.3
Green Joe Rooney 1,155 16.0
Liberal Democrat Victoria Marsom 592 8.2
BNP Steven Thomas 365 5.1
Majority 2,306 31.9
Turnout 7,208 37.5
Conservative hold Swing
Brandwood ward
PartyCandidateVotes%±
Conservative Neville Summerfield 2,864 46.0
Labour Susan Burfoot 1,937 31.1
BNP Lynette Orton 531 8.5
Liberal Democrat Brian Peace 472 7.6
Green Anna Masters 307 4.9
Independent Frank Chance 110 1.8
Majority 927 14.9
Turnout 6,221 34.8
Conservative hold Swing
Edgbaston ward
PartyCandidateVotes%±
Conservative Deirdre Alden 2,429 58.8
Labour Rod Dungate 912 22.1
Liberal Democrat Stuart Ritchie 372 9.0
Green Becki Cox 234 5.7
BNP Stuart Bates 90 2.2
UKIP Frank Jones 55 1.3
Independent Abhay Patekar 31 0.8
Majority 1,517 36.7
Turnout 4,123 26.1
Conservative hold Swing
Erdington ward
PartyCandidateVotes%±
Conservative Bob Beauchamp 2,678 56.0
Labour Christopher Hillcox 1,187 24.8
Liberal Democrat Philip Mills 330 6.9
BNP Simon Briscoe 317 6.6
Green Mark Oley 185 3.9
UKIP Umar Malik 82 1.7
Majority 1,491 31.2
Turnout 4,779 29.2
Conservative gain from Labour Swing
Hall Green ward
PartyCandidateVotes%±
Liberal Democrat Francis Wilkes 3,027 43.0
Conservative Bob Harvey 2,290 32.5
Labour Samuel Burden 1,123 15.9
BNP Wendy Lawrie 345 4.9
Green Sarah Minchin 164 2.3
UKIP John Ison 75 1.1
Majority 737 10.5
Turnout 7,024 37.6
Liberal Democrat hold Swing
Handsworth Wood ward
PartyCandidateVotes%±
Labour Gurdial Atwal 2,591 47.8
Conservative Mahindarpal Singh 1,129 20.8
Socialist Labour John Tyrrell 671 12.4
Liberal Democrat Nick Jolliffe 570 10.5
Green Eric Fairclough 231 4.3
BNP Paul Billingham 217 4.0
Majority 1,462 27.0
Turnout 5,409 28.3
Labour hold Swing
Harborne ward
PartyCandidateVotes%±
Conservative John Alden 2,717 49.5
Labour John Priest 1,389 25.3
Green Phil Simpson 691 12.6
Liberal Democrat Mohammed Sagier 405 7.4
BNP Howard Hamilton 193 3.5
UKIP Edward Siddall-Jones 80 1.5
Majority 1,328 24.2
Turnout 5,475 33.4
Conservative hold Swing
Hodge Hill ward
PartyCandidateVotes%±
Labour Co-op Anita Ward 2,375 40.7
Liberal Democrat Maureen Barnsley 1,852 31.7
Conservative Wilf Holland 757 13.0
BNP Denis Adams 526 9.0
UKIP Peter Johnson 176 3.0
Green Lydia Bradshaw 149 2.6
Majority 523 9.0
Turnout 5,835 33.7
Labour hold Swing
Kings Norton ward
PartyCandidateVotes%±
Conservative Geoffrey Sutton 2,345 47.3
Labour Amy Watson 1,492 30.1
BNP Malcolm Doughty 534 10.8
Liberal Democrat Neil Taylor 341 6.9
Green Steven Heywood 235 4.7
Majority 853 17.2
Turnout 4,947 29.6
Conservative hold Swing
Kingstanding ward
PartyCandidateVotes%±
Labour Catharine Grundy 1,376 36.7
Conservative Gary Sambrook 1,296 34.6
BNP David Campion 648 17.3
Liberal Democrat Hubert Duffy 254 6.8
Green Geoff Tapalu 105 2.8
National Front Terry Williams 54 1.4
Majority 80 2.1
Turnout 3,733 21.9
Labour hold Swing
Ladywood ward
PartyCandidateVotes%±
Labour Kathleen Hartley 1,467 50.1
Conservative Ransford Clarkson 719 24.6
Liberal Democrat Kenneth Jeffers 368 12.6
Green Damien Duff 196 6.7
BNP Lee Saunders 122 4.2
UKIP Mark Nattrass 44 1.5
Majority 748 25.5
Turnout 2,916 16.7
Labour hold Swing
Longbridge ward
PartyCandidateVotes%±
Conservative Ken Wood 1,977 39.4
Labour Steve Bedser 1,720 33.9
BNP Elizabeth Wainwright 716 14.1
Liberal Democrat Kevin Hannon 464 9.1
Green Bill Van Marle 168 3.3
Majority 277 5.5
Turnout 5,065 27.8
Conservative gain from Labour Swing
Lozells And East Handsworth ward
PartyCandidateVotes%±
Labour Don Brown 2,689 42.7
Liberal Democrat Sabirul Islam 1,725 27.4
Independent Ahsan Raghib 711 11.3
Community Independent Raja Khan 637 10.1
Conservative Zaweed Khan 284 4.5
Green Ankaret Harmer 159 2.5
BNP Zane Patchell 61 1.0
Majority 964 15.3
Turnout 6,266 33.9
Labour hold Swing
Moseley And Kings Heath ward
PartyCandidateVotes%±
Liberal Democrat Martin Mullaney 2,476 37.2
Labour Jane Howell 2,181 32.8
Conservative Maura Judges 963 14.5
Green Alan Clawley 433 6.5
Respect Ray Gaston 327 4.9
BNP Peter Lawrie 156 2.3
UKIP Alan Blumenthal 88 1.3
Majority 295 4.4
Turnout 6,624 35.8
Liberal Democrat hold Swing
Nechells ward
PartyCandidateVotes%±
Labour Tahir Ali 1,713 41.8
Respect Mushtaq Hussain 781 19.1
Liberal Democrat Nazir Hussain 710 17.3
Conservative Fitzroy Stevenson 429 10.5
BNP Darren Potter 211 5.2
Green Janet Assheton 191 4.7
UKIP Afshar Nazemi 39 1.0
Majority 932 22.7
Turnout 4,074 22.6
Labour hold Swing
Northfield ward
PartyCandidateVotes%±
Conservative Les Lawrence 2,804 47.1
Labour Andrew Coulson 1,496 25.1
BNP Leslie Orton 1,003 16.9
Liberal Democrat Andrew Moles 406 6.8
Green Susan Pearce 231 3.9
Majority 1,308 22.0
Turnout 5,940 31.7
Conservative hold Swing
Oscott ward
PartyCandidateVotes%±
Conservative Graham Green 2,196 41.6
Labour John Cotton 1,939 36.7
BNP Wilfred Palmer 690 13.1
Liberal Democrat James Hamilton 304 5.8
Green Harry Eyles 151 2.9
Majority 257 4.9
Turnout 5,280 29.2
Conservative gain from Labour Swing
Perry Barr ward
PartyCandidateVotes%±
Liberal Democrat Raymond Hassall 2,268 46.2
Labour Samuel Allen 1,190 24.2
Conservative Mark Haddon 843 17.2
BNP Susan Morris 443 9.0
Green Lester Mundy 160 3.3
Majority 1,078 22.0
Turnout 4,904 28.9
Liberal Democrat hold Swing
Quinton ward
PartyCandidateVotes%±
Conservative Peter Smallbone 2,903 44.8
Labour Caroline Badley 2,527 39.0
BNP Josephine Larkin 409 6.3
Liberal Democrat Ian Garrett 355 5.5
Green Peter Beck 275 4.2
Majority 376 5.8
Turnout 6,469 37.5
Conservative gain from Labour Swing
Selly Oak ward
PartyCandidateVotes%±
Liberal Democrat Alistair Dow 1,948 42.2
Labour David Williams 1,274 27.6
Conservative Andrew Hardie 889 19.3
Green Peter Tinsley 319 6.9
BNP Trevor Shearer 176 3.8
Majority 674 24.6
Turnout 4,606 25.0
Liberal Democrat hold Swing
Shard End ward
PartyCandidateVotes%±
Labour Marjorie Bridle 1,752 41.4
Conservative Jessie Holland 1,011 23.9
BNP Richard Lumby 999 23.6
Liberal Democrat Chris Barber 323 7.6
Green John Read 93 2.2
National Front Mark Neary 43 1.0
Majority 741 17.5
Turnout 4,221 23.3
Labour hold Swing
Sheldon ward
PartyCandidateVotes%±
Liberal Democrat Sue Anderson 3,224 60.5
BNP Robert Devenport 789 14.8
Conservative Hannah Axford 586 11.0
Labour Karen McCarthy 555 10.4
Green Elinor Stanton 92 1.7
National Front Paul Morris 75 1.4
Majority 2,435 45.7
Turnout 5,321 33.5
Liberal Democrat hold Swing
Soho ward
PartyCandidateVotes%±
Labour Chaman Lal 2,599 52.2
Liberal Democrat Morriam Jan 1.647 33.1
Conservative David Williams-Masinda 351 7.1
Green Huw Davies 147 3.0
Socialist Labour Sheera Johal 110 2.2
BNP Darren Allen 108 2.2
Majority 952 19.1
Turnout 4,962 29.1
Labour hold Swing
South Yardley ward
PartyCandidateVotes%±
Liberal Democrat Daphne Gaved 3,179 54.3
Labour Brendan O'Brien 1,221 20.9
BNP John Pugh 649 11.1
Conservative Ken Axford 526 9.0
Green Rianne Ten Veen 177 3.0
National Front Adrian Davidson 93 1.6
Majority 1,958 33.4
Turnout 5,845 30.0
Liberal Democrat hold Swing
Sparkbrook ward
PartyCandidateVotes%±
Respect Nahim Khan 3,032 42.6
Labour Mohammed Azim 2,600 36.6
Liberal Democrat Farah Naz 466 6.6
Conservative Guy Hordern 370 5.2
Community Independent Talib Hussain 268 3.8
Green Charles Alldrick 237 3.3
BNP Arthur Botterill 106 1.5
Majority 432 6.0
Turnout 7,079 36.8
Respect gain from Independent Swing
Springfield ward
PartyCandidateVotes%±
Liberal Democrat Jerry Evans 2,559 33.1
Labour Akhlaq Ahmed 2,443 31.6
Respect Salma Iqbal 1,920 24.8
Conservative Sam Pearce 475 6.1
BNP Michael Jones 162 2.1
Green Sandra Taylor 149 1.9
Majority 116 1.5
Turnout 7,708 39.8
Liberal Democrat hold Swing
Stechford And Yardley North ward
PartyCandidateVotes%±
Liberal Democrat Neil Eustace 3,098 58.3
Labour John Bliss 848 16.0
Conservative Robert Clark 572 10.8
BNP Richard Morris 546 10.3
UKIP Graham Duffen 154 2.9
Green Edith Roberts 85 1.6
Majority 2,250 42.3
Turnout 5,303 29.3
Liberal Democrat hold Swing
Stockland Green ward
PartyCandidateVotes%±
Conservative Matt Bennett 1,946 41.1
Labour Penny Holbrook 1,874 39.6
Liberal Democrat Franklyn Aaron 379 8.0
BNP Carl Brisker 339 7.2
Green John Bentley 182 3.8
Majority 72 1.5
Turnout 4,720 27.8
Conservative gain from Labour Swing
Sutton Four Oaks ward
PartyCandidateVotes%±
Conservative Peter Howard 4,418 69.3
Liberal Democrat Richard Pearson 616 9.7
Labour Manish Puri 403 6.3
UKIP Brendan Padmore 380 6.0
BNP Maureen Davies 341 5.4
Green Karl Macnaughton 212 3.3
Majority 3,802 59.6
Turnout 6,370 33.7
Conservative hold Swing
Sutton New Hall ward
PartyCandidateVotes%±
Conservative Dennis Birbeck 3,722 67.1
Labour Elizabeth Dowd 691 12.5
Liberal Democrat Jean Woods 479 8.6
BNP Karl Benton 458 8.3
Green Jim Orford 193 3.5
Majority 3,031 54.6
Turnout 5,543 31.6
Conservative hold Swing
Sutton Trinity ward
PartyCandidateVotes%±
Conservative Philip Parkin 3,394 61.2
Labour Roger Barley 818 14.8
Liberal Democrat Maureen Parker 545 9.8
BNP Karen Lawrie 353 6.4
Green Ulla Grant 234 4.2
UKIP Ray Skett 191 3.5
Majority 2,576 46.4
Turnout 5,535 28.7
Conservative hold Swing
Sutton Vesey ward
PartyCandidateVotes%±
Conservative Malcolm Cornish 3,291 54.4
Labour Robert Pocock 1,443 23.9
Liberal Democrat Sidney Woods 507 8.4
BNP Gemma Orton 369 6.1
Green Annabel Smith 215 3.6
UKIP Stephen Shorrock 211 3.5
Majority 1,848 30.5
Turnout 6,036 32.9
Conservative hold Swing
Tyburn ward
PartyCandidateVotes%±
Liberal Democrat Ann Holtom 1,652 36.1
Labour Des Hughes 1,144 25.0
Conservative Derek Johnson 1,125 24.6
BNP Ben Lumby 395 8.6
Independent Sallyann Rose 129 2.8
Green Tamara Bolger 121 2.6
Majority 508 11.1
Turnout 4,566 26.9
Liberal Democrat hold Swing
Washwood Heath ward
PartyCandidateVotes%±
Liberal Democrat Tariq Khan 4,342 47.2
Labour Mohammed Rasib 4,161 45.2
Conservative Ron Storer 328 3.6
BNP James Gibson 170 1.9
Green Steven Austin 161 1.8
Majority 181 2.0
Turnout 9,162 47.3
Liberal Democrat hold Swing
Weoley ward
PartyCandidateVotes%±
Conservative Eddie Freeman 2,389 45.5
Labour Co-op Jan Drinkwater 1,791 34.1
Liberal Democrat Gary Davies 453 8.6
BNP Roy Orton 406 7.7
Green Mina Coalter 198 3.8
Majority 598 11.4
Turnout 5,237 30.0
Conservative gain from Labour Swing

Related Research Articles

2008 Solihull Metropolitan Borough Council election

The 2008 Solihull Metropolitan Borough Council election took place on 1 May 2008 to elect members of Solihull Metropolitan Borough Council in the West Midlands, England. One third of the council was up for election and the Conservative party gained overall control of the council from no overall control.

2007 St Albans City and District Council election

The 2007 St Albans City and District Council election took place on 3 May 2007 to elect members of St Albans District Council in Hertfordshire, England. One third of the council was up for election and the Liberal Democrats lost overall control of the council to no overall control.

2008 Wyre Forest District Council election

The 2008 Wyre Forest District Council election took place on 1 May 2008 to elect members of Wyre Forest District Council in Worcestershire, England. One third of the council was up for election and the Conservative party gained overall control of the council from no overall control.

2007 Worcester City Council election

The 2007 Worcester City Council election took place on 3 May 2007 to elect members of Worcester District Council in Worcestershire, England. One third of the council was up for election and the Conservative party stayed in overall control of the council.

1999 Solihull Metropolitan Borough Council election

The 1999 Solihull Metropolitan Borough Council election took place on 6 May 1999 to elect members of Solihull Metropolitan Borough Council in the West Midlands, England. One third of the council was up for election and the council stayed under no overall control.

2004 Solihull Metropolitan Borough Council election

The 2004 Solihull Metropolitan Borough Council election took place on 10 June 2004 to elect members of Solihull Metropolitan Borough Council in the West Midlands, England. The whole council was up for election with boundary changes since the last election in 2003. The Conservative party stayed in overall control of the council.

2006 Solihull Metropolitan Borough Council election

The 2006 Solihull Metropolitan Borough Council election took place on 4 May 2006 to elect members of Solihull Metropolitan Borough Council in the West Midlands, England. One third of the council was up for election and the Conservative party stayed in overall control of the council.

2007 Solihull Metropolitan Borough Council election

The 2007 Solihull Metropolitan Borough Council election took place on 4 May 2007 to elect members of Solihull Metropolitan Borough Council in the West Midlands, England. One third of the council was up for election and the Conservative party lost overall control of the council to no overall control.

2006 Sunderland City Council election

The 2006 Sunderland Council election took place on 4 May 2006 to elect members of Sunderland City Council in Tyne and Wear, England. One third of the Council was up for election and the Labour party stayed in overall control.

2010 Sunderland City Council election

The 2010 Sunderland Council election took place on 6 May 2010 to elect members of Sunderland Metropolitan Borough Council in Tyne and Wear, England. One third of the council was up for election and the Labour party stayed in overall control of the council. The election took place on the same day as the 2010 General Election.

The 1999 Sandwell Metropolitan Borough Council election took place on 6 May 1999 to elect members of Sandwell Metropolitan Borough Council in the West Midlands, England. One third of the council was up for election and the Labour party stayed in overall control of the council.

The 2003 Sandwell Metropolitan Borough Council election took place on 1 May 2003 to elect members of Sandwell Metropolitan Borough Council in the West Midlands, England. One third of the council was up for election and the Labour party stayed in overall control of the council.

2007 Sandwell Metropolitan Borough Council election

The 2007 Sandwell Metropolitan Borough Council election took place on 3 May 2007 to elect members of Sandwell Metropolitan Borough Council in the West Midlands, England. One third of the council was up for election and the Labour party stayed in overall control of the council.

2008 Sandwell Metropolitan Borough Council election

The 2008 Sandwell Metropolitan Borough Council election took place on 1 May 2008 to elect members of Sandwell Metropolitan Borough Council in the West Midlands, England. One third of the council was up for election and the Labour party stayed in overall control of the council.

2003 Hertsmere Borough Council election

The 2003 Hertsmere Borough Council election took place on 1 May 2003 to elect members of Hertsmere Borough Council in Hertfordshire, England. One third of the council was up for election and the Conservative party stayed in overall control of the council.

2007 Carlisle City Council election

The 2007 Carlisle City Council election took place on 3 May 2007 to elect members of Carlisle District Council in Cumbria, England. One third of the council was up for election and the council stayed under no overall control.

2011 Wealden District Council election

The 2011 Wealden District Council election took place on 5 May 2011 to elect members of Wealden District Council in East Sussex, England. The whole council was up for election and the Conservative party stayed in overall control of the council.

2008 Havant Borough Council election

The 2008 Havant Borough Council election took place on 1 May 2008 to elect members of Havant Borough Council in Hampshire, England. One third of the council was up for election and the Conservative party stayed in overall control of the council.

2012 Harlow District Council election

The 2012 Harlow District Council election took place on 3 May 2012 to elect members of Harlow District Council in Essex, England. One third of the council was up for election and the Labour party gained overall control of the council from the Conservative party.

2008 Swale Borough Council election

The 2008 Swale Borough Council election took place on 1 May 2008 to elect members of Swale Borough Council in Kent, England. One third of the council was up for election and the Conservative party stayed in overall control of the council.

References

  1. 1 2 "Labour suffers Wolverhampton loss". BBC Online . 2 May 2008. Retrieved 2008-10-25.
  2. "Birmingham City Council election candidates revealed". Birmingham Post . 7 April 2008. Retrieved 2008-10-25.
  3. 1 2 3 "Tory-Lib Dem alliance holds firm in Birmingham". politics.co.uk. 2 May 2008. Archived from the original on 21 August 2008. Retrieved 2008-10-25.
  4. "Conservatives come out on top in Birmingham". Birmingham Mail . 2 May 2008. Retrieved 2008-10-25.