The 1998 Wolverhampton Metropolitan Borough Council election took place on 7 May 1998 to elect members of Wolverhampton Metropolitan Borough Council in the West Midlands, England. One third of the council was up for election and the Labour party kept overall control of the council. [1]
Wolverhampton is a city and metropolitan borough in the West Midlands, England. At the 2011 census, it had a population of 249,470. The demonym for people from the city is 'Wulfrunian'.
A metropolitan borough is a type of local government district in England, and is a subdivision of a metropolitan county. Created in 1974 by the Local Government Act 1972, metropolitan boroughs are defined in English law as metropolitan districts. However, all of them have been granted or regranted royal charters to give them borough status. Metropolitan boroughs have been effectively unitary authority areas since the abolition of the metropolitan county councils by the Local Government Act 1985. However, metropolitan boroughs pool much of their authority in joint boards and other arrangements that cover whole metropolitan counties, such as combined authorities.
The West Midlands is a metropolitan county in western-central England with a 2014 estimated population of 2,808,356, making it the second most populous county in England after Greater London. It came into existence as a metropolitan county in 1974 after the passage of the Local Government Act 1972, formed from parts of Staffordshire, Worcestershire and Warwickshire. The county itself is a NUTS 2 region within the wider NUTS 1 region of the same name. The county consists of seven metropolitan boroughs: the City of Birmingham, the City of Coventry and the City of Wolverhampton, as well as the boroughs of Dudley, Sandwell, Solihull and Walsall.
After the election, the composition of the council was
20 of the 60 seats on the council were up for election with Labour defending 15, the Conservatives 4 and the Liberal Democrats 1. [3] All three parties leaders on the council were defending their seats in the election, Labour's Norman Davies, Conservative Jim Carpenter and the Liberal Democrats Malcolm Gwynnett. [3] However Labour were guaranteed to remain in control of the council as they had 46 councillors before the election, compared to 12 Conservatives and 2 Liberal Democrats. [3] [4] As well as the 3 main parties the only other candidates were 3 Liberals and 2 Labour Independents. [4]
The Conservative Party, officially the Conservative and Unionist Party, is a centre-right political party in the United Kingdom. The governing party since 2010, it is the largest in the House of Commons, with 313 Members of Parliament, and also has 249 members of the House of Lords, 18 members of the European Parliament, 31 Members of the Scottish Parliament, 12 members of the Welsh Assembly, eight members of the London Assembly and 8,916 local councillors.
The Liberal Democrats are a centrist, liberal political party in the United Kingdom. It is currently led by Vince Cable. It has 11 Members of Parliament in the House of Commons, 96 members of the House of Lords, one member of the European Parliament, five Members of the Scottish Parliament and one member in the Welsh Assembly and London Assembly. At the height of its influence, the party served as junior partners in a coalition government with the Conservative Party from 2010 to 2015.
A Councillor is a member of a local government council.
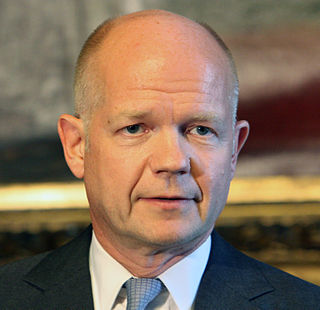
The Conservative national leader William Hague attacked the Labour council as he said they lowered the education budget while setting one of the highest metropolitan council taxes in the country. [5] However Labour's council leader joined with other local leaders to make a joint response and said that when the Conservatives were in control taxes in Wolverhampton had gone up by 57%. [6]
William Jefferson Hague, Baron Hague of Richmond, is a British Conservative politician and life peer. He represented Richmond, Yorkshire, as its Member of Parliament (MP) from 1989 to 2015 and was the Leader of the Opposition from 1997 to 2001. He was Secretary of State for Foreign and Commonwealth Affairs from 2010 to 2014 and was the Leader of the House of Commons from 2014 to 2015.
Labour retained control of the council after the election with a majority of 28, but lost 2 seats to the Conservatives in Bushbury and Park wards. [7] Overall turnout in the election was 29.95%, [8] but reached a low of only 18% in Low Hill. [9]
Voter turnout is the percentage of eligible voters who cast a ballot in an election. Eligibility varies by country, and the voting-eligible population should not be confused with the total adult population. Age and citizenship status are often among the criteria used to determine eligibility, but some countries further restrict eligibility based on sex, race, or religion.
Party | Seats | Gains | Losses | Net gain/loss | Seats % | Votes % | Votes | +/− | |
---|---|---|---|---|---|---|---|---|---|
Labour | 13 | 0 | 2 | -2 | 65.0 | 47.1 | 25,940 | ||
Conservative | 6 | 2 | 0 | +2 | 30.0 | 37.9 | 20,906 | ||
Liberal Democrat | 1 | 0 | 0 | 0 | 5.0 | 12.9 | 7,112 | ||
Liberal | 0 | 0 | 0 | 0 | 0 | 1.7 | 960 | ||
Independent Labour | 0 | 0 | 0 | 0 | 0 | 0.4 | 200 |
Party | Candidate | Votes | % | ± | |
---|---|---|---|---|---|
Labour | Norman Davies | 1,117 | 65.3 | ||
Conservative | Mark Blakeley | 334 | 19.5 | ||
Liberal Democrat | William Beard | 259 | 15.1 | ||
Majority | 783 | 45.8 | |||
Turnout | 1,710 | 20.7 |
Party | Candidate | Votes | % | ± | |
---|---|---|---|---|---|
Labour | Trudy Bowen | 1,381 | 54.2 | ||
Conservative | Wayne Lawley | 954 | 37.5 | ||
Liberal Democrat | Michael Rowan | 212 | 8.3 | ||
Majority | 427 | 16.7 | |||
Turnout | 2,547 | 24.1 |
Party | Candidate | Votes | % | ± | |
---|---|---|---|---|---|
Labour | John Rowley | 2,118 | 76.4 | ||
Conservative | Brenda Wilson | 477 | 17.2 | ||
Liberal Democrat | June Hemsley | 177 | 6.4 | ||
Majority | 1,641 | 59.2 | |||
Turnout | 2,772 | 31.3 |
Party | Candidate | Votes | % | ± | |
---|---|---|---|---|---|
Conservative | Charles Brueton | 1,337 | 51.0 | ||
Labour | Patricia Wesley | 1,051 | 40.1 | ||
Liberal Democrat | David Buckley | 233 | 8.9 | ||
Majority | 286 | 10.9 | |||
Turnout | 2,621 | 29.4 |
Party | Candidate | Votes | % | ± | |
---|---|---|---|---|---|
Labour | Keith Inston | 1,344 | 66.7 | ||
Conservative | Maxine Bradley | 462 | 22.9 | ||
Liberal Democrat | Ann Whitehouse | 209 | 10.4 | ||
Majority | 882 | 43.8 | |||
Turnout | 2,015 | 24.2 |
Party | Candidate | Votes | % | ± | |
---|---|---|---|---|---|
Labour | John Shelley | 1,248 | 70.3 | ||
Conservative | Christopher Haynes | 382 | 21.5 | ||
Liberal Democrat | Michael Heap | 146 | 8.2 | ||
Majority | 866 | 48.8 | |||
Turnout | 1,776 | 21.4 |
Party | Candidate | Votes | % | ± | |
---|---|---|---|---|---|
Labour | Joyce Hill | 1,218 | 48.9 | ||
Conservative | Kenneth Hodges | 952 | 38.2 | ||
Liberal Democrat | Anthony Bourke | 321 | 12.9 | ||
Majority | 266 | 10.7 | |||
Turnout | 2,491 | 30.0 |
Party | Candidate | Votes | % | ± | |
---|---|---|---|---|---|
Labour | John Reynolds | 1,812 | 51.7 | ||
Conservative | David Jack | 1,249 | 35.6 | ||
Liberal Democrat | Mary Millar | 320 | 9.1 | ||
Independent Labour | Amrik Sekhon | 127 | 3.6 | ||
Majority | 563 | 16.1 | |||
Turnout | 3,508 | 37.8 |
Party | Candidate | Votes | % | ± | |
---|---|---|---|---|---|
Labour | Greg Brackenridge | 1,244 | 60.7 | ||
Liberal | Colin Hallmark | 526 | 25.6 | ||
Conservative | Sham Sharma | 281 | 13.7 | ||
Majority | 781 | 35.1 | |||
Turnout | 2,051 | 25.3 |
Party | Candidate | Votes | % | ± | |
---|---|---|---|---|---|
Labour | Peter Bilson | 1,116 | 66.4 | ||
Conservative | Peter Topliss | 382 | 22.7 | ||
Liberal Democrat | Ian Jenkins | 182 | 10.8 | ||
Majority | 734 | 43.7 | |||
Turnout | 1,680 | 18.8 |
Party | Candidate | Votes | % | ± | |
---|---|---|---|---|---|
Conservative | Robert Hart | 1,752 | 55.3 | ||
Labour | Colin Matthews | 996 | 31.5 | ||
Liberal Democrat | Paul Hodson | 418 | 13.2 | ||
Majority | 756 | 23.8 | |||
Turnout | 3,166 | 32.9 |
Party | Candidate | Votes | % | ± | |
---|---|---|---|---|---|
Labour | Christine Irvine | 1,280 | 48.0 | ||
Conservative | David Meredith | 998 | 37.4 | ||
Liberal Democrat | David Isles | 318 | 11.9 | ||
Independent Labour | David Watson | 73 | 2.7 | ||
Majority | 282 | 10.6 | |||
Turnout | 2,669 | 27.7 |
Party | Candidate | Votes | % | ± | |
---|---|---|---|---|---|
Conservative | Neville Patten | 1,753 | 46.8 | ||
Labour | John Potts | 1,592 | 42.5 | ||
Liberal Democrat | Brian Lewis | 402 | 10.7 | ||
Majority | 161 | 4.3 | |||
Turnout | 3,747 | 35.8 |
Party | Candidate | Votes | % | ± | |
---|---|---|---|---|---|
Conservative | Benjamin Carpenter | 2,249 | 55.4 | ||
Labour | Barry Thomas | 1,459 | 35.9 | ||
Liberal Democrat | Paul Beeston | 355 | 8.7 | ||
Majority | 790 | 19.5 | |||
Turnout | 4,063 | 40.9 |
Party | Candidate | Votes | % | ± | |
---|---|---|---|---|---|
Labour | Tersaim Singh | 1,580 | 64.8 | ||
Conservative | Nicholas Allen | 518 | 21.2 | ||
Liberal Democrat | Roger Gray | 340 | 13.9 | ||
Majority | 1,062 | 43.6 | |||
Turnout | 2,438 | 25.0 |
Party | Candidate | Votes | % | ± | |
---|---|---|---|---|---|
Liberal Democrat | Malcolm Gwinnett | 2,055 | 59.3 | ||
Labour | Rachel Shanks | 1,178 | 34.0 | ||
Conservative | Giuseppe Corbelli | 234 | 6.7 | ||
Majority | 877 | 25.3 | |||
Turnout | 3,467 | 34.2 |
Party | Candidate | Votes | % | ± | |
---|---|---|---|---|---|
Conservative | Robert Ward | 1,832 | 55.9 | ||
Liberal Democrat | Laurence Mclean | 841 | 25.7 | ||
Labour | Carl Smith | 602 | 18.4 | ||
Majority | 991 | 30.2 | |||
Turnout | 3,275 | 35.2 |
Party | Candidate | Votes | % | ± | |
---|---|---|---|---|---|
Conservative | Wendy Thompson | 2,444 | 72.0 | ||
Labour | James O'Grady | 658 | 19.4 | ||
Liberal Democrat | Philip Bennett | 294 | 8.7 | ||
Majority | 1,786 | 52.6 | |||
Turnout | 3,396 | 36.7 |
Party | Candidate | Votes | % | ± | |
---|---|---|---|---|---|
Labour | Philip Bateman | 1,589 | 53.5 | ||
Conservative | John Jones | 1,147 | 38.6 | ||
Liberal Democrat | Carole Jenkins | 121 | 4.1 | ||
Liberal | Kate Hallmark | 113 | 3.8 | ||
Majority | 442 | 14.9 | |||
Turnout | 2,970 | 32.4 |
Party | Candidate | Votes | % | ± | |
---|---|---|---|---|---|
Labour | Helen King | 1,357 | 49.2 | ||
Conservative | Simon Jevon | 1,169 | 42.4 | ||
Liberal Democrat | John Steatham | 230 | 8.3 | ||
Majority | 188 | 6.8 | |||
Turnout | 2,756 | 30.9 |
The 1998 Sandwell Metropolitan Borough Council election took place on 7 May 1998 to elect members of Sandwell Metropolitan Borough Council in the West Midlands, England. One third of the council was up for election and the Labour party stayed in overall control of the council.
The 1998 Solihull Metropolitan Borough Council election took place on 7 May 1998 to elect members of Solihull Metropolitan Borough Council in the West Midlands, England. One third of the council was up for election and the council stayed under no overall control.
The 1998 Tamworth Borough Council election took place on 7 May 1998 to elect members of Tamworth District Council in Staffordshire, England. One third of the council was up for election and the Labour party stayed in overall control of the council.
The 2003 Redditch Borough Council election took place on 1 May 2003 to elect members of Redditch Borough Council in the West Midlands region, England. One third of the council was up for election and the council stayed under no overall control.
The 1999 Wolverhampton Metropolitan Borough Council election took place on 6 May 1999 to elect members of Wolverhampton Metropolitan Borough Council in the West Midlands, England. One third of the council was up for election and the Labour party kept overall control of the council. Overall turnout in the election was 30.63%.
The 1999 Lichfield District Council election took place on 6 May 1999 to elect members of Lichfield District Council in Staffordshire, England. The whole council was up for election and the Conservative party gained overall control of the council from the Labour party.
The 2008 Solihull Metropolitan Borough Council election took place on 1 May 2008 to elect members of Solihull Metropolitan Borough Council in the West Midlands, England. One third of the council was up for election and the Conservative party gained overall control of the council from no overall control.
The 1998 Stratford-on-Avon District Council election took place on 7 May 1998 to elect members of Stratford-on-Avon District Council in Warwickshire, England. One third of the council was up for election and the council stayed under no overall control.
The 1998 Cheltenham Council election took place on 7 May 1998 to elect members of Cheltenham Borough Council in Gloucestershire, England. One third of the council was up for election and the Liberal Democrats stayed in overall control of the council.
The 1999 Solihull Metropolitan Borough Council election took place on 6 May 1999 to elect members of Solihull Metropolitan Borough Council in the West Midlands, England. One third of the council was up for election and the council stayed under no overall control.
The 2003 Solihull Metropolitan Borough Council election took place on 1 May 2003 to elect members of Solihull Metropolitan Borough Council in the West Midlands, England. One third of the council was up for election and the Conservative party stayed in overall control of the council.
The 2004 Solihull Metropolitan Borough Council election took place on 10 June 2004 to elect members of Solihull Metropolitan Borough Council in the West Midlands, England. The whole council was up for election with boundary changes since the last election in 2003. The Conservative party stayed in overall control of the council.
The 1998 Stroud Council election took place on 7 May 1998 to elect members of Stroud District Council in Gloucestershire, England. One third of the council was up for election and the council stayed under no overall control.
The 1999 Sandwell Metropolitan Borough Council election took place on 6 May 1999 to elect members of Sandwell Metropolitan Borough Council in the West Midlands, England. One third of the council was up for election and the Labour party stayed in overall control of the council.
The 2000 Sandwell Metropolitan Borough Council election took place on 4 May 2000 to elect members of Sandwell Metropolitan Borough Council in the West Midlands, England. One third of the council was up for election and the Labour party stayed in overall control of the council.
The 2004 Sandwell Metropolitan Borough Council election took place on 10 June 2004 to elect members of Sandwell Metropolitan Borough Council in the West Midlands, England. The whole council was up for election with boundary changes since the last election in 2003. The Labour party stayed in overall control of the council.
The 2006 Sandwell Metropolitan Borough Council election took place on 4 May 2006 to elect members of Sandwell Metropolitan Borough Council in the West Midlands, England. One third of the council was up for election and the Labour party stayed in overall control of the council.
The 2007 Sandwell Metropolitan Borough Council election took place on 3 May 2007 to elect members of Sandwell Metropolitan Borough Council in the West Midlands, England. One third of the council was up for election and the Labour party stayed in overall control of the council.
The 2008 Sandwell Metropolitan Borough Council election took place on 1 May 2008 to elect members of Sandwell Metropolitan Borough Council in the West Midlands, England. One third of the council was up for election and the Labour party stayed in overall control of the council.
The 2011 Sandwell Metropolitan Borough Council election took place on 5 May 2011 to elect members of Sandwell Metropolitan Borough Council in the West Midlands, England. One third of the council was up for election and the Labour party stayed in overall control of the council.