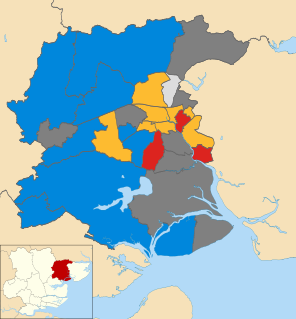
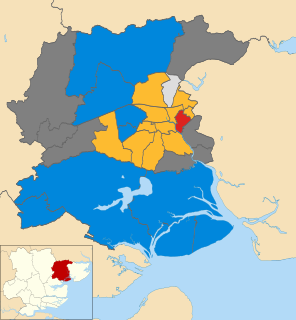
The 1998 Colchester Borough Council election took place on 7 May 1998 to elect members of Colchester Borough Council in Essex, England. One third of the council was up for election and the Liberal Democrats lost overall control of the council to no overall control. [1]
Borough status in the United Kingdom is granted by royal charter to local government districts in England, Wales and Northern Ireland. The status is purely honorary, and does not give any additional powers to the council or inhabitants of the district. In Scotland, similarly chartered communities were known as royal burghs, although the status is no longer granted.
Essex is a county in the south-east of England, north-east of London. One of the home counties, it borders Suffolk and Cambridgeshire to the north, Hertfordshire to the west, Kent across the estuary of the River Thames to the south, and London to the south-west. The county town is Chelmsford, the only city in the county. For government statistical purposes Essex is placed in the East of England region.
England is a country that is part of the United Kingdom. It shares land borders with Wales to the west and Scotland to the north-northwest. The Irish Sea lies west of England and the Celtic Sea lies to the southwest. England is separated from continental Europe by the North Sea to the east and the English Channel to the south. The country covers five-eighths of the island of Great Britain, which lies in the North Atlantic, and includes over 100 smaller islands, such as the Isles of Scilly and the Isle of Wight.
After the election, the composition of the council was
The Liberal Democrats are a liberal political party in the United Kingdom. They presently have 11 Members of Parliament in the House of Commons, 96 members of the House of Lords, and one member of the European Parliament. They also have five Members of the Scottish Parliament and a member each in the Welsh Assembly and London Assembly. The party reached the height of its influence in the early 2010s, forming a junior partner in a coalition government from 2010 to 2015. It is presently led by Vince Cable.
The Labour Party is a centre-left political party in the United Kingdom which has been described as an alliance of social democrats, democratic socialists and trade unionists. The party's platform emphasises greater state intervention, social justice and strengthening workers' rights.
The Conservative Party, officially the Conservative and Unionist Party, is a centre-right political party in the United Kingdom. Presently led by Theresa May, it has been the governing party since 2010. It presently has 314 Members of Parliament in the House of Commons, 249 members of the House of Lords, and 18 members of the European Parliament. It also has 31 Members of the Scottish Parliament, 12 members of the Welsh Assembly, eight members of the London Assembly and 9,008 local councillors. One of the major parties of UK politics, it has formed the government on 45 occasions, more than any other party.
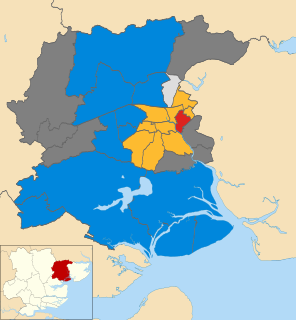
The Liberal Democrats lost the majority on the council that they had controlled since 1994, after the Conservative and Labour parties made 3 gains each. [2]
Party | Seats | Gains | Losses | Net gain/loss | Seats % | Votes % | Votes | +/− | |
---|---|---|---|---|---|---|---|---|---|
Liberal Democrat | 26 | 0 | 5 | 34.7 | 11,266 | +5.2 | |||
Labour | 18 | 2 | 0 | 31.8 | 10,327 | -2.4 | |||
Conservative | 14 | 3 | 0 | 33.5 | 10,860 | +11.0 | |||
Tiptree Residents | 1 | 0 | 0 | N/A | N/A | N/A |
Party | Candidate | Votes | % | ± | |
---|---|---|---|---|---|
Labour | John Cooke | 971 | 49.0 | +6.4 | |
Liberal Democrat | W. Sutton | 771 | 38.9 | -11.2 | |
Conservative | J. Dinglemans | 239 | 12.1 | +4.8 | |
Majority | |||||
Turnout | 34.1 | ||||
Labour gain from Liberal Democrat | Swing | ||||
Party | Candidate | Votes | % | ± | |
---|---|---|---|---|---|
Conservative | P. Crowe | 555 | 65.8 | +15.1 | |
Labour | T. Rogers | 197 | 23.4 | +1.6 | |
Liberal Democrat | D. Paton | 91 | 10.8 | -16.7 | |
Majority | |||||
Turnout | |||||
Conservative hold | Swing |
Party | Candidate | Votes | % | ± | |
---|---|---|---|---|---|
Liberal Democrat | Chris Hall | 907 | 44.5 | -1.1 | |
Labour | Chris Pearson | 585 | 28.7 | -9.2 | |
Conservative | N. Stock | 514 | 25.2 | +9.7 | |
Natural Law | L. Basker | 32 | 1.6 | +0.7 | |
Majority | |||||
Turnout | 34.0 | ||||
Liberal Democrat hold | Swing |
Party | Candidate | Votes | % | ± | |
---|---|---|---|---|---|
Liberal Democrat | P. Blandon | 800 | 43.8 | -9.2 | |
Labour | D. Canning | 761 | 41.7 | +2.3 | |
Conservative | S. Rae | 264 | 14.5 | +6.9 | |
Majority | |||||
Turnout | |||||
Liberal Democrat hold | Swing |
Party | Candidate | Votes | % | ± | |
---|---|---|---|---|---|
Conservative | P. Walford | 1,030 | 50.4 | +2.1 | |
Liberal Democrat | U. Jones | 802 | 39.3 | -1.9 | |
Labour | S. Creasy | 210 | 10.3 | +1.1 | |
Majority | |||||
Turnout | |||||
Conservative gain from Liberal Democrat | Swing | ||||
Party | Candidate | Votes | % | ± | |
---|---|---|---|---|---|
Liberal Democrat | D. Goatley | 913 | 36.2 | +6.1 | |
Conservative | N. Taylor | 844 | 33.5 | +2.9 | |
Labour | J. Thomas | 766 | 30.4 | -6.6 | |
Majority | |||||
Turnout | |||||
Liberal Democrat hold | Swing |
Party | Candidate | Votes | % | ± | |
---|---|---|---|---|---|
Liberal Democrat | Bob Russell | 997 | 62.6 | -0.1 | |
Labour | Jean Quinn | 429 | 26.9 | -3.7 | |
Conservative | A. Allen | 166 | 10.4 | +3.7 | |
Majority | |||||
Turnout | 36.8 | ||||
Liberal Democrat hold | Swing |
Party | Candidate | Votes | % | ± | |
---|---|---|---|---|---|
Conservative | J. Girdlestone | 838 | 40.7 | +15.2 | |
Liberal Democrat | D. Goss | 795 | 38.6 | -9.7 | |
Labour | P. Creasy | 426 | 20.7 | -5.4 | |
Majority | 2.1 | ||||
Turnout | 34.6 | ||||
Conservative gain from Liberal Democrat | Swing | ||||
Party | Candidate | Votes | % | ± | |
---|---|---|---|---|---|
Conservative | R. Davidson | 573 | 66.7 | +20.1 | |
Liberal Democrat | R. Watkins | 146 | 17.0 | -22.9 | |
Labour | J. Coombes | 140 | 16.3 | +4.4 | |
Majority | 49.7 | ||||
Turnout | 42.2 | ||||
Conservative hold | Swing |
Party | Candidate | Votes | % | ± | |
---|---|---|---|---|---|
Liberal Democrat | W. Sandford | 452 | 40.4 | -9.4 | |
Labour | R. Pryor | 436 | 38.9 | +0.5 | |
Conservative | A. Yalland | 232 | 20.7 | +8.9 | |
Majority | 1.4 | ||||
Turnout | 21.7 | ||||
Liberal Democrat hold | Swing |
Party | Candidate | Votes | % | ± | |
---|---|---|---|---|---|
Labour | Julie Young | 688 | 58.4 | -2.7 | |
Liberal Democrat | J. Gray | 375 | 31.8 | +1.3 | |
Conservative | R. Lambeth | 116 | 9.8 | +1.2 | |
Majority | 30.5 | ||||
Turnout | 23.6 | ||||
Labour hold | Swing |
Party | Candidate | Votes | % | ± | |
---|---|---|---|---|---|
Labour | D. Fairbrother | 967 | 50.1 | -0.6 | |
Liberal Democrat | K. Hindle | 745 | 38.6 | -3.6 | |
Conservative | M. Girdlestone | 220 | 11.4 | +4.3 | |
Majority | |||||
Turnout | |||||
Labour gain from Liberal Democrat | Swing | ||||
Party | Candidate | Votes | % | ± | |
---|---|---|---|---|---|
Liberal Democrat | Helen Chuah | 813 | 44.8 | -15.0 | |
Conservative | D. Smith | 661 | 36.4 | +12.1 | |
Labour | Dave Harris | 340 | 18.7 | +2.8 | |
Majority | 8.4 | ||||
Turnout | 32.1 | ||||
Liberal Democrat hold | Swing |
Party | Candidate | Votes | % | ± | |
---|---|---|---|---|---|
Liberal Democrat | Nick Cope | 754 | 41.9 | -3.9 | |
Conservative | S. Candy | 681 | 37.8 | +4.4 | |
Labour | P. McGilvray | 366 | 20.3 | -0.5 | |
Majority | 4.1 | ||||
Turnout | 33.0 | ||||
Liberal Democrat hold | Swing |
Party | Candidate | Votes | % | ± | |
---|---|---|---|---|---|
Liberal Democrat | G. Illot | 752 | 40.7 | -13.2 | |
Conservative | I. McCord | 651 | 35.3 | +15.4 | |
Labour | Ian Yates | 443 | 24.0 | -2.2 | |
Majority | 5.5 | ||||
Turnout | 30.5 | ||||
Liberal Democrat hold | Swing |
Party | Candidate | Votes | % | ± | |
---|---|---|---|---|---|
Labour | Mike Dale | 913 | 60.0 | +18.0 | |
Conservative | Elizabeth Blundell | 410 | 26.9 | +17.1 | |
Liberal Democrat | A. Seaman | 199 | 13.1 | N/A | |
Majority | 33.0 | ||||
Turnout | 24.3 | ||||
Labour hold | Swing |
Party | Candidate | Votes | % | ± | |
---|---|---|---|---|---|
Conservative | Nigel Chapman | 655 | 49.9 | +18.3 | |
Liberal Democrat | R. Tyrrell | 481 | 36.7 | -11.9 | |
Labour | D. Jones | 176 | 13.4 | -6.4 | |
Majority | 13.3 | ||||
Turnout | 33.5 | ||||
Conservative gain from Liberal Democrat | Swing | ||||
Party | Candidate | Votes | % | ± | |
---|---|---|---|---|---|
Conservative | M. Kimberley | 910 | 60.6 | +5.7 | |
Labour | Alan Mogridge | 361 | 24.0 | +2.0 | |
Liberal Democrat | B. Harrison | 231 | 15.4 | -7.7 | |
Majority | 36.6 | ||||
Turnout | 25.9 | ||||
Conservative hold | Swing |
Party | Candidate | Votes | % | ± | |
---|---|---|---|---|---|
Conservative | M. Fairhead | 674 | 80.0 | +16.7 | |
Labour | L. Dopson | 96 | 11.4 | +3.2 | |
Liberal Democrat | P. Gentry | 73 | 8.7 | -18.7 | |
Majority | |||||
Turnout | |||||
Conservative hold | Swing |
Party | Candidate | Votes | % | ± | |
---|---|---|---|---|---|
Labour | R. Richardson | 1,056 | 57.0 | -1.8 | |
Conservative | D. Adams | 627 | 33.9 | +6.1 | |
Liberal Democrat | L. Warren | 169 | 9.1 | -5.3 | |
Majority | |||||
Turnout | |||||
Labour hold | Swing |
Party | Candidate | Votes | % | ± | |
---|---|---|---|---|---|
Labour | 624 | 46.0 | -14.0 | ||
Tiptree Residents | 399 | 29.4 | +29.4 | ||
Conservative | 333 | 24.6 | -2.3 | ||
Majority | 291 | 16.6 | |||
Turnout | 1,356 | 21.7 | |||
Labour hold | Swing |
The 1998 Wolverhampton Metropolitan Borough Council election took place on 7 May 1998 to elect members of Wolverhampton Metropolitan Borough Council in the West Midlands, England. One third of the council was up for election and the Labour party kept overall control of the council.
The 2006 Colchester Borough Council election took place on 4 May 2006 to elect members of Colchester Borough Council in Essex, England. One third of the council was up for election and the council stayed under no overall control.
The 1998 Tunbridge Wells Borough Council election took place on 7 May 1998 to elect members of Tunbridge Wells Borough Council in Kent, England. One third of the council was up for election and the Conservative party gained overall control of the council from no overall control.
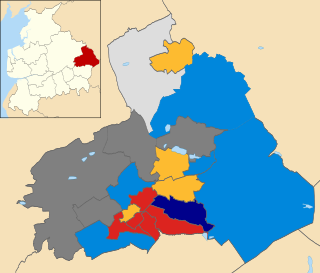
The 1998 Pendle Borough Council election took place on 7 May 1998 to elect members of Pendle Borough Council in Lancashire, England. One third of the council was up for election and the Liberal Democrats stayed in overall control of the council.
The 1999 Pendle Borough Council election took place on 6 May 1999 to elect members of Pendle Borough Council in Lancashire, England. One third of the council was up for election and the Liberal Democrats lost overall control of the council to no overall control.
The 2007 Pendle Borough Council election took place on 3 May 2007 to elect members of Pendle Borough Council in Lancashire, England. One third of the council was up for election and the Liberal Democrats stayed in overall control of the council.
The 2008 Pendle Borough Council election took place on 1 May 2008 to elect members of Pendle Borough Council in Lancashire, England. One third of the council was up for election and the Liberal Democrats lost overall control of the council to no overall control.
The 2006 Maidstone Borough Council election took place on 4 May 2006 to elect members of Maidstone Borough Council in Kent, England. One third of the council was up for election and the council stayed under no overall control.
The 2012 Colchester Borough Council election took place on 3 May 2012 to elect members of Colchester Borough Council in Essex, England. One third of the council was up for election and the council stayed under no overall control.
The 2002 Colchester Borough Council election took place on 2 May 2002 to elect members of Colchester Borough Council in Essex, England. This was the same day as the other 2002 local elections in the United Kingdom. Due to boundary changes, every seat was up for election and the council stayed under no overall control.
The 2003 Colchester Borough Council election took place on 1 May 2003 to elect members of Colchester Borough Council in Essex, England. This was the same day as the other 2003 United Kingdom local elections. One third of the seats were up for election and the council stayed under no overall control.
The 2004 Colchester Borough Council election took place on 10 June 2004 to elect members of Colchester Borough Council in Essex, England. This was the same day as the other 2004 United Kingdom local elections and as the 2004 European Parliament Elections. One third of the seats were up for election and the council stayed under no overall control.
The 1999 Colchester Borough Council election took place on 6 May 1999 to elect members of Colchester Borough Council in Essex, England. One third of the council was up for election and the council stayed under no overall control.
The 2000 Colchester Borough Council election took place on 4 May 2000 to elect members of Colchester Borough Council in Essex, England. One third of the council was up for election and the council stayed under no overall control.
The 2007 Colchester Borough Council election took place on 3 May 2007 to elect members of Colchester Borough Council in Essex, England. One third of the council was up for election and the council stayed under no overall control.
The 2008 Colchester Borough Council election took place on 1 May 2008 to elect members of Colchester Borough Council in Essex, England. One third of the council was up for election and the Conservative party lost overall control of the council to no overall control.
The 2010 Colchester Borough Council election took place on 6 May 2010 to elect members of Colchester Borough Council in Essex, England. One third of the council was up for election and the council stayed under no overall control.
The 2011 Colchester Borough Council election took place on 5 May 2011 to elect members of Colchester Borough Council in Essex, England. One third of the council was up for election and the council stayed under no overall control.
The 2014 Colchester Borough Council election took place on 22 May 2014 to elect members of Colchester Borough Council in Essex, England. One third of the council was up for election and the council stayed under no overall control.
The 2015 Colchester Borough Council election took place on 7 May 2015 to elect one third of the members of Colchester Borough Council in England. This was the same day as other local elections and as the General Election. Colchester Borough Council is made up of 60 councillors: 20 councillors were up for election.