| |||||||||||||||||||||||||||||||||||||||||||||||||||||||||||
20 seats (out of 60 seats) 31 seats seats needed for a majority | |||||||||||||||||||||||||||||||||||||||||||||||||||||||||||
---|---|---|---|---|---|---|---|---|---|---|---|---|---|---|---|---|---|---|---|---|---|---|---|---|---|---|---|---|---|---|---|---|---|---|---|---|---|---|---|---|---|---|---|---|---|---|---|---|---|---|---|---|---|---|---|---|---|---|---|
|
The 2003 Colchester Borough Council election took place on 1 May 2003 to elect members of Colchester Borough Council in Essex, England. This was the same day as the other 2003 United Kingdom local elections. One third of the seats were up for election and the council stayed under no overall control. [1]
Borough status in the United Kingdom is granted by royal charter to local government districts in England, Wales and Northern Ireland. The status is purely honorary, and does not give any additional powers to the council or inhabitants of the district. In Scotland, similarly chartered communities were known as royal burghs, although the status is no longer granted.
Essex is a county in the south-east of England, north-east of London. One of the home counties, it borders Suffolk and Cambridgeshire to the north, Hertfordshire to the west, Kent across the estuary of the River Thames to the south, and London to the south-west. The county town is Chelmsford, the only city in the county. For government statistical purposes Essex is placed in the East of England region.
England is a country that is part of the United Kingdom. It shares land borders with Wales to the west and Scotland to the north-northwest. The Irish Sea lies west of England and the Celtic Sea lies to the southwest. England is separated from continental Europe by the North Sea to the east and the English Channel to the south. The country covers five-eighths of the island of Great Britain, which lies in the North Atlantic, and includes over 100 smaller islands, such as the Isles of Scilly and the Isle of Wight.
Before the election the Conservatives were the largest party with 24 seats, the Liberal Democrats had 23 seats, Labour had 4 seats, there were 8 independents and 1 seat was vacant after the sitting Labour councillor moved to Scotland. [2] The council was run by a cabinet comprising 3 Conservatives, 3 Liberal Democrats and 1 Labour members. [3]
The Conservative Party, officially the Conservative and Unionist Party, is a centre-right political party in the United Kingdom. Presently led by Theresa May, it has been the governing party since 2010. It presently has 314 Members of Parliament in the House of Commons, 249 members of the House of Lords, and 18 members of the European Parliament. It also has 31 Members of the Scottish Parliament, 12 members of the Welsh Assembly, eight members of the London Assembly and 9,008 local councillors. One of the major parties of UK politics, it has formed the government on 45 occasions, more than any other party.
The Liberal Democrats are a liberal political party in the United Kingdom. They presently have 11 Members of Parliament in the House of Commons, 96 members of the House of Lords, and one member of the European Parliament. They also have five Members of the Scottish Parliament and a member each in the Welsh Assembly and London Assembly. The party reached the height of its influence in the early 2010s, forming a junior partner in a coalition government from 2010 to 2015. It is presently led by Vince Cable.
The Labour Party is a centre-left political party in the United Kingdom which has been described as an alliance of social democrats, democratic socialists and trade unionists. The party's platform emphasises greater state intervention, social justice and strengthening workers' rights.
21 seats were being contested, with 2 seats available in Wivenhoe Cross due to the vacancy. [2] The remaining 20 seats all had the sitting councillors defending their seats and included the Labour group leader Tim Young in St Andrew's and the Conservative mayor Nigel Chapman in Fordham and Stour. [2] Meanwhile, in High Woods, Ian Ringer, defended the seat as an independent after leaving the Liberal Democrats earlier in 2003. [2]
Wivenhoe is a town and civil parish in north eastern Essex, England, approximately 3 miles (4.8 km) south east of Colchester. Historically Wivenhoe village, on the banks of the River Colne, and Wivenhoe Cross, on the higher ground to the north, were two separate settlements but with considerable development in the 19th century the two have merged.
In England, the offices of mayor and lord mayor have long been ceremonial posts, with few or no duties attached to them. In recent years they have doubled as more influential political roles while retaining the ceremonial functions. A mayor's term of office denotes the municipal year. The most famous example is that of the Lord Mayor of the City of London.
Fordham is a village and civil parish in the Colchester district of the English county of Essex, six miles north-west of the town of Colchester. It has a population measured at 835 in the 2011 Census. The parish includes the nearby hamlets of Fordham Heath and Hemp's Green.
Prior to the election, 3 Liberal Democrat councillors from Highwoods ward defected and sat as Independents, reducing the Liberal Democrat group to 23 councillors.
Following the election Bob Newman left the Labour group to sit as an independent, reducing Labour to 4 councillors. [3] [4] Labour then went into opposition after refusing to work with the Conservatives and a new cabinet was formed with 4 Conservative and 4 Liberal Democrat members. [3]
Party | Seats | Gains | Losses | Net gain/loss | Seats % | Votes % | Votes | +/− | |
---|---|---|---|---|---|---|---|---|---|
Conservative | 10 | 3 | 3 | 0 | 47.6 | 40.6 | 11,108 | +1.1% | |
Liberal Democrat | 8 | 2 | 0 | +2 | 38.1 | 32.0 | 8,740 | -4.4% | |
Labour | 2 | 1 | 1 | 0 | 9.5 | 20.0 | 5,467 | +0.9% | |
Independent | 1 | 0 | 2 | -2 | 4.8 | 5.7 | 1,563 | +2.0% | |
Green | 0 | 0 | 0 | 0 | 0 | 1.4 | 370 | +0.2% | |
Socialist Alliance | 0 | 0 | 0 | 0 | 0 | 0.4 | 96 | +0.3% |
Shown below are ward results according to the council's election results archive. [6] [7] [8]
Three of the single-seat wards (Dedham & Langham, East Donyland, Marks Tey) were not up for election this year. Neither were three of the two-seat wards (Harbour, Lexden, St John's).
Party | Candidate | Votes | % | ± | |
---|---|---|---|---|---|
Liberal Democrat | Susan Brooks | 746 | 52.1 | +2.0 | |
Labour | Julia Thomas | 404 | 28.2 | -7.1 | |
Conservative | Sarah McLean | 274 | 19.2 | +5.1 | |
Majority | 342 | 23.88 | |||
Turnout | 1,432 | 24.5 | -6.5 | ||
Liberal Democrat hold | Swing |
Party | Candidate | Votes | % | ± | |
---|---|---|---|---|---|
Conservative | Peter Crowe | 966 | 71.8 | +9.5 | |
Liberal Democrat | Barry Woodward | 190 | 14.1 | -6.2 | |
Labour | Audrey Spencer | 183 | 13.6 | -3.8 | |
Majority | 776 | 57.7 | |||
Turnout | 1,345 | 31.0 | -8.0 | ||
Conservative hold | Swing |
Party | Candidate | Votes | % | ± | |
---|---|---|---|---|---|
Liberal Democrat | Kenneth Jones | 903 | 54.4 | -2.0 | |
Conservative | Pauline Lucas | 404 | 24.3 | +4.8 | |
Labour | Malcolm Cannon | 210 | 12.7 | -1.4 | |
Green | Walter Schwarz | 132 | 8.0 | -2.0 | |
Majority | 499 | 30.1 | |||
Turnout | 1,660 | 28.6 | -3.4 | ||
Liberal Democrat hold | Swing |
Party | Candidate | Votes | % | ± | |
---|---|---|---|---|---|
Liberal Democrat | Martin Hunt | 662 | 48.0 | +6.1 | |
Conservative | Roger Buston | 587 | 42.6 | +1.8 | |
Labour | David Canning | 124 | 9.0 | -8.3 | |
Majority | 75 | 5.4 | — | ||
Turnout | 1,379 | 43.4 | +3.4 | ||
Liberal Democrat gain from Conservative | Swing | ||||
Party | Candidate | Votes | % | ± | |
---|---|---|---|---|---|
Conservative | Elizabeth Jewell Blundell | 353 | 70.46 | -4.69 | |
Independent | Patrick James Mead | 70 | 13.97 | +13.97 | |
Labour | Anna Geraldine Trudgian | 40 | 7.98 | +7.98 | |
Liberal Democrat | Anthony Scott-Boutell | 37 | 7.39 | -17.07 | |
Majority | 283 | 56.49 | +5.81 | ||
Turnout | 501 | 34.0 | -1.0 | ||
Conservative hold | Swing |
Party | Candidate | Votes | % | ± | |
---|---|---|---|---|---|
Conservative | Nigel Chapman | 797 | 71.9 | +9.9 | |
Liberal Democrat | Wilma Sutton | 161 | 14.5 | -7.5 | |
Labour | Gary Griffiths | 144 | 13.0 | -3.0 | |
Majority | 636 | 57.4 | |||
Turnout | 1,108 | 27.6 | -5.4 | ||
Conservative hold | Swing |
Party | Candidate | Votes | % | ± | |
---|---|---|---|---|---|
Conservative | Peter Chillingworth | 645 | 68.6 | +2.9 | |
Liberal Democrat | Carolyn Catney | 196 | 20.9 | -13.4 | |
Labour | Alan Trudigan | 108 | 11.49 | New | |
Majority | 449 | 47.8 | +16.3 | ||
Turnout | 940 | 42.7 | +2.7 | ||
Conservative hold | Swing |
Party | Candidate | Votes | % | ± | |
---|---|---|---|---|---|
Conservative | Maris Fuller | 417 | 32.3 | ||
Liberal Democrat | Alan Hayman | 408 | 31.6 | ||
Independent | Ian Ringer [lower-alpha 1] | 339 | 26.3 | New | |
Labour | Edmund Chinnery | 121 | 9.4 | ||
Majority | 9 | 0.7 | |||
Turnout | 1,290 | 22.0 | |||
Conservative gain from Independent | Swing | ||||
Party | Candidate | Votes | % | ± | |
---|---|---|---|---|---|
Liberal Democrat | Anne Turrell | 589 | 44.3 | +13.6 | |
Conservative | Shahid Husain | 400 | 30.1 | -3.6 | |
Labour | Janet Smith | 171 | 12.9 | -11.8 | |
Independent | Jane Chinnery | 124 | 9.3 | New | |
Green | Mary Bryan | 40 | 3.0 | New | |
Majority | 189 | 14.2 | |||
Turnout | 1,331 | 26.3 | +0.3 | ||
Liberal Democrat hold | Swing |
Party | Candidate | Votes | % | ± | |
---|---|---|---|---|---|
Liberal Democrat | Margaret Fisher | 767 | 55.9 | -1.1 | |
Conservative | Glenn Bath | 325 | 23.7 | +8.0 | |
Labour | Jane Green | 281 | 20.5 | -6.8 | |
Majority | 442 | 31.7 | |||
Turnout | 1,395 | 22.9 | -3.1 | ||
Liberal Democrat hold | Swing |
Party | Candidate | Votes | % | ± | |
---|---|---|---|---|---|
Liberal Democrat | Sandra Gray | 1,044 | 48.3 | +4.9 | |
Conservative | Ronald Levy | 935 | 43.3 | +0.7 | |
Labour | Luke Dopson | 182 | 8.4 | -5.5 | |
Majority | 109 | 5.0 | |||
Turnout | 2,161 | 36.2 | -0.8 | ||
Liberal Democrat gain from Conservative | Swing | ||||
Party | Candidate | Votes | % | ± | |
---|---|---|---|---|---|
Labour | Tim Young | 813 | 62.2 | +6.1 | |
Liberal Democrat | Jennifer Berriman | 270 | 20.6 | -0.7 | |
Conservative | Anne Allan | 184 | 14.1 | -1.6 | |
Socialist Alliance | Jeremy Jepps | 41 | 3.1 | -3.9 | |
Majority | 543 | 41.4 | — | ||
Turnout | 1,313 | 19.7 | -0.3 | ||
Labour hold | Swing |
Party | Candidate | Votes | % | ± | |
---|---|---|---|---|---|
Liberal Democrat | Barrie Cook | 853 | 58.4 | +3.1 | |
Labour | Peter Brine | 295 | 20.2 | -6.1 | |
Conservative | Angus Allan | 283 | 19.4 | +0.9 | |
Socialist Alliance | David Isaacson | 31 | 2.1 | New | |
Majority | 558 | 38.2 | — | ||
Turnout | 1,461 | 22.7 | -2.3 | ||
Liberal Democrat hold | Swing |
Party | Candidate | Votes | % | ± | |
---|---|---|---|---|---|
Labour | Richard Bourne | 596 | 38.0 | +4.6 | |
Conservative | Alan Scattergood | 530 | 33.8 | -3.1 | |
Liberal Democrat | Barbara Williamson | 408 | 26.0 | -3.7 | |
Socialist Alliance | John Coombes | 24 | 1.5 | N/A | |
Majority | 66 | 4.2 | +4.0 | ||
Turnout | 1,568 | 24.5 | -0.5 | ||
Labour gain from Conservative | Swing | 3.9 | |||
Party | Candidate | Votes | % | ± | |
---|---|---|---|---|---|
Liberal Democrat | Lesley Scott-Boutell | 918 | 52.3 | +1.1 | |
Conservative | John Reeves | 610 | 34.8 | +0.4 | |
Labour | John Spademan | 222 | 12.7 | +0.4 | |
Majority | 308 | 17.6 | — | ||
Turnout | 1755 | 28.8 | -5.2 | ||
Liberal Democrat hold | Swing |
Party | Candidate | Votes | % | ± | |
---|---|---|---|---|---|
Conservative | Margaret Crowe | 546 | 35.0 | +17.2 | |
Independent | Anne Burgess | 542 | 34.7 | -0.9 | |
Labour | Alan Mogridge | 415 | 26.6 | +1.2 | |
Green | Stella Barnes | 56 | 3.6 | -4.6 | |
Majority | |||||
Turnout | 1,561 | 26.4 | -2.6 | ||
Conservative gain from Independent | Swing | ||||
Party | Candidate | Votes | % | ± | |
---|---|---|---|---|---|
Conservative | Jill Tod | 774 | 66.4 | +19.2 | |
Liberal Democrat | Una Jones | 238 | 20.4 | +0.3 | |
Labour | Ian Yates | 149 | 12.8 | -5.1 | |
Majority | 536 | 46.0 | |||
Turnout | 1,166 | 30.3 | -2.7 | ||
Conservative hold | Swing |
Party | Candidate | Votes | % | ± | |
---|---|---|---|---|---|
Conservative | Margaret Anne Kimberley | 1107 | 63.0 | ||
Labour | Bry Whittle Mogridge | 359 | 20.43 | ||
Liberal Democrat | Ronald Charles Laurance Baker | 249 | 14.17 | ||
Majority | 748 | 42.57 | |||
Turnout | 1757 | 30.1 | -0.9 | ||
Conservative hold | Swing |
Party | Candidate | Votes | % | ± | |
---|---|---|---|---|---|
Conservative | David Adams | 313 | 53.4 | +17.3 | |
Conservative | Eugene Kraft | 264 | |||
Labour | Aulay MacKenzie | 172 | 29.4 | -14.6 | |
Labour | Paul Bishop | 142 | |||
Liberal Democrat | Barry James | 101 | 17.2 | -2.7 | |
Turnout | 544 | 16.8 | -0.2 | ||
Conservative hold | Swing | ||||
Conservative gain from Labour | Swing | ||||
Party | Candidate | Votes | % | ± | |
---|---|---|---|---|---|
Independent | Richard Davies | 488 | 35.6 | +4.1 | |
Conservative | Kenneth Rogers | 394 | 28.7 | +5.8 | |
Labour | Stephen Ford | 336 | 24.5 | -8.4 | |
Green | Christopher Fox | 142 | 10.4 | -2.4 | |
Majority | 94 | 6.9 | — | ||
Turnout | 1,371 | 35.6 | -2.4 | ||
Independent hold | Swing |
A by-election took place on 22 April 2004 after the death of the independent councillor Richard Davies. [9]
Party | Candidate | Votes | % | ± | |
---|---|---|---|---|---|
Labour | Stephen Ford | 626 | 34.4 | +9.7 | |
Conservative | Anne Quarrie | 614 | 33.7 | +4.7 | |
Liberal Democrat | Jeremy Jacobs | 581 | 31.9 | +31.9 | |
Majority | 12 | 0.7 | |||
Turnout | 1,821 | 44.0 | |||
Labour gain from Independent | Swing | ||||
Colchester Politics: Colchester is a historic town located in Essex, England. It served as the first capital of Roman Britain and makes a claim to be the oldest town in Britain.
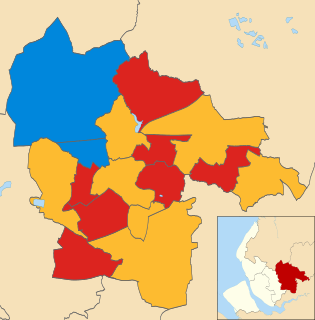
The 2006 St Helens Metropolitan Borough Council election took place on 4 May 2006 to elect members of St Helens Metropolitan Borough Council in Merseyside, England. One third of the council was up for election and the council stayed under no overall control.
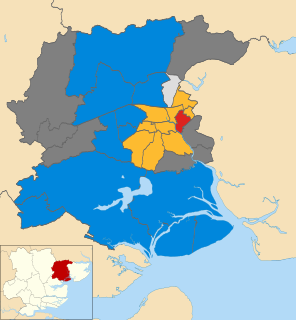
The 2006 Colchester Borough Council election took place on 4 May 2006 to elect members of Colchester Borough Council in Essex, England. One third of the council was up for election and the council stayed under no overall control.
The 2003 Harlow District Council election took place on 1 May 2003 to elect members of Harlow District Council in Essex, England. One third of the council was up for election and the council stayed under no overall control.
The 2007 St Helens Metropolitan Borough Council election took place on 3 May 2007 to elect members of St Helens Metropolitan Borough Council in Merseyside, England. One third of the council was up for election and the council stayed under no overall control.
The 2012 Colchester Borough Council election took place on 3 May 2012 to elect members of Colchester Borough Council in Essex, England. One third of the council was up for election and the council stayed under no overall control.
The 2002 Colchester Borough Council election took place on 2 May 2002 to elect members of Colchester Borough Council in Essex, England. This was the same day as the other 2002 local elections in the United Kingdom. Due to boundary changes, every seat was up for election and the council stayed under no overall control.
The 2004 Colchester Borough Council election took place on 10 June 2004 to elect members of Colchester Borough Council in Essex, England. This was the same day as the other 2004 United Kingdom local elections and as the 2004 European Parliament Elections. One third of the seats were up for election and the council stayed under no overall control.
The 2000 Colchester Borough Council election took place on 4 May 2000 to elect members of Colchester Borough Council in Essex, England. One third of the council was up for election and the council stayed under no overall control.
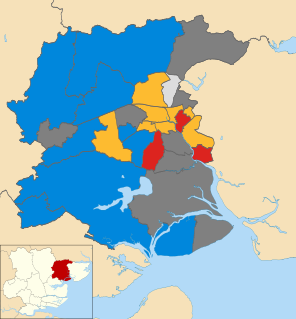
The 2007 Colchester Borough Council election took place on 3 May 2007 to elect members of Colchester Borough Council in Essex, England. One third of the council was up for election and the council stayed under no overall control.
The 2008 Colchester Borough Council election took place on 1 May 2008 to elect members of Colchester Borough Council in Essex, England. One third of the council was up for election and the Conservative party lost overall control of the council to no overall control.
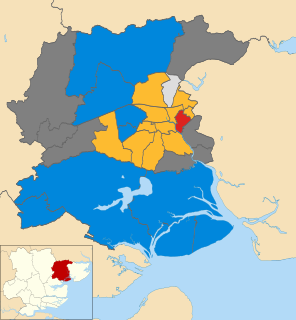
The 2010 Colchester Borough Council election took place on 6 May 2010 to elect members of Colchester Borough Council in Essex, England. One third of the council was up for election and the council stayed under no overall control.
The 2011 Colchester Borough Council election took place on 5 May 2011 to elect members of Colchester Borough Council in Essex, England. One third of the council was up for election and the council stayed under no overall control.
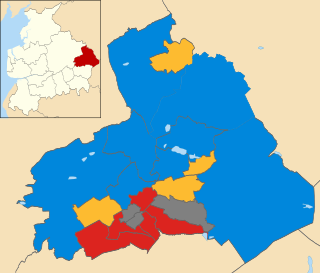
The 2014 Colchester Borough Council election took place on 22 May 2014 to elect members of Colchester Borough Council in Essex, England. One third of the council was up for election and the council stayed under no overall control.
The 2011 Pendle Borough Council election took place on 5 May 2011 to elect members of Pendle Borough Council in Lancashire, England. One third of the council was up for election and the council stayed under no overall control.
The 1999 Castle Point Borough Council election took place on 6 May 1999 to elect members of Castle Point Borough Council in Essex, England. The whole council was up for election and the Labour party stayed in overall control of the council.
The 2006 Brent London Borough Council election took place on 4 May 2006 to elect members of Brent London Borough Council in London, England. The whole council was up for election and the Labour party lost overall control of the council to no overall control.
The 2015 Colchester Borough Council election took place on 7 May 2015 to elect one third of the members of Colchester Borough Council in England. This was the same day as other local elections and as the General Election. Colchester Borough Council is made up of 60 councillors: 20 councillors were up for election.
The 2003 West Oxfordshire District Council election took place on 1 May 2003 to elect members of West Oxfordshire District Council in Oxfordshire, England. One third of the council was up for election and the Conservative party stayed in overall control of the council.
Elections to Colchester Borough Council took place on 5 May 2016. Colchester Borough Council normally elects one third of its councillors each year, however, due to boundary changes, the whole council is up for election.