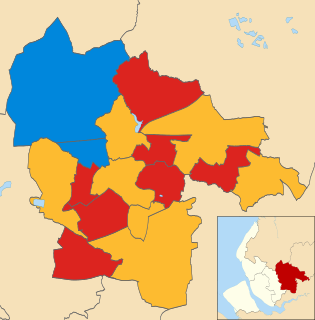
The 2008 Basildon District Council election took place on 1 May 2008 to elect members of Basildon District Council in Essex, England. One third of the council was up for election and the Conservative party stayed in overall control of the council. [1]
Essex is a county in the south-east of England, north-east of London. One of the home counties, it borders Suffolk and Cambridgeshire to the north, Hertfordshire to the west, Kent across the estuary of the River Thames to the south, and London to the south-west. The county town is Chelmsford, the only city in the county. For government statistical purposes Essex is placed in the East of England region.
England is a country that is part of the United Kingdom. It shares land borders with Wales to the west and Scotland to the north-northwest. The Irish Sea lies west of England and the Celtic Sea lies to the southwest. England is separated from continental Europe by the North Sea to the east and the English Channel to the south. The country covers five-eighths of the island of Great Britain, which lies in the North Atlantic, and includes over 100 smaller islands, such as the Isles of Scilly and the Isle of Wight.
The Conservative Party, officially the Conservative and Unionist Party, is a centre-right political party in the United Kingdom. Presently led by Theresa May, it has been the governing party since 2010. It presently has 314 Members of Parliament in the House of Commons, 249 members of the House of Lords, and 18 members of the European Parliament. It also has 31 Members of the Scottish Parliament, 12 members of the Welsh Assembly, eight members of the London Assembly and 9,008 local councillors. One of the major parties of UK politics, it has formed the government on 45 occasions, more than any other party.
After the election, the composition of the council was
The Conservative, Labour and British National parties stood in all 14 seats contested, which was an increase from 11 at the 2007 election for the British National party. [3] The Liberal Democrats stood in 13 wards, just not contesting Pitsea North West, while there were 4 United Kingdom Independence Party, 3 Green and 3 independent candidates. [3] The independent candidates included councillor Jane Dyer in Vange, after she left the Labour party just before the election, [4] and former councillor David Harrison in Wickford North. [3]
The Labour Party is a centre-left political party in the United Kingdom which has been described as an alliance of social democrats, democratic socialists and trade unionists. The party's platform emphasises greater state intervention, social justice and strengthening workers' rights.
The British National Party (BNP) is a far-right, fascist political party in the United Kingdom. It is headquartered in Wigton, Cumbria, and its current leader is Adam Walker. A minor party, it has no elected representatives at any level of UK government. Founded in 1982, the party reached its greatest level of success in the 2000s, when it had over fifty seats in local government, one seat on the London Assembly, and two Members of the European Parliament.
The Liberal Democrats are a liberal political party in the United Kingdom. They presently have 11 Members of Parliament in the House of Commons, 96 members of the House of Lords, and one member of the European Parliament. They also have five Members of the Scottish Parliament and a member each in the Welsh Assembly and London Assembly. The party reached the height of its influence in the early 2010s, forming a junior partner in a coalition government from 2010 to 2015. It is presently led by Vince Cable.
The results saw the Conservative increase their majority by 1 after taking Vange ward to hold 29 seats. [2] Conservative Luke Mackenzie became the youngest councillor in Basildon at the age of 22, after taking Vange from independent, formerly Labour, councillor Jane Dyer, who only received 72 votes in the election. [2] Labour remained on 10 seats, with the party 82 votes behind the Conservatives in the contest in Vange. [2] Meanwhile, the Liberal Democrats remained on 3 seats, but finished behind the British National Party in the share of the vote. [2] Overall turnout in the election was 29%. [5]
Voter turnout is the percentage of eligible voters who cast a ballot in an election. Eligibility varies by country, and the voting-eligible population should not be confused with the total adult population. Age and citizenship status are often among the criteria used to determine eligibility, but some countries further restrict eligibility based on sex, race, or religion.
Following the election Lynda Gordon became the first female group leader on Basildon council, after taking over from Nigel Smith as leader of the Labour group. [6] Smith had declared that he would step down as leader of the Labour group before the election. [6]
Party | Seats | Gains | Losses | Net gain/loss | Seats % | Votes % | Votes | +/− | |
---|---|---|---|---|---|---|---|---|---|
Conservative | 10 | 1 | 0 | +1 | 71.4 | 47.5 | 15,936 | +4.3% | |
Labour | 3 | 0 | 0 | 0 | 21.4 | 20.8 | 6,982 | -1.5% | |
Liberal Democrat | 1 | 0 | 0 | 0 | 7.1 | 11.5 | 3,851 | -1.4% | |
BNP | 0 | 0 | 0 | 0 | 0 | 14.1 | 4,743 | +2.1% | |
Independent | 0 | 0 | 1 | -1 | 0 | 3.3 | 1,093 | -4.5% | |
UKIP | 0 | 0 | 0 | 0 | 0 | 2.0 | 669 | +0.8% | |
Green | 0 | 0 | 0 | 0 | 0 | 0.8 | 266 | +0.2% | |
Party | Candidate | Votes | % | ± | |
---|---|---|---|---|---|
Conservative | Stuart Sullivan | 1,932 | 65.8 | +21.6 | |
Liberal Democrat | Roger Hatch | 428 | 14.6 | -20.7 | |
BNP | Geoffrey McCarthy | 220 | 7.5 | -4.6 | |
Labour | Patricia Reid | 206 | 7.0 | -1.3 | |
UKIP | Susan McCaffery | 152 | 5.2 | +5.2 | |
Majority | 1,504 | 51.2 | +42.2 | ||
Turnout | 2,938 | 32 | -2 | ||
Conservative hold | Swing | ||||
Party | Candidate | Votes | % | ± | |
---|---|---|---|---|---|
Conservative | Philip Turner | 2,145 | 71.1 | +5.4 | |
Liberal Democrat | Belinda Jackson | 332 | 11.0 | -4.4 | |
Labour | Wendy Aitken | 239 | 7.9 | +0.0 | |
BNP | Michael Bateman | 200 | 6.6 | -4.4 | |
UKIP | Cherry Young | 99 | 3.3 | +3.3 | |
Majority | 1,813 | 60.1 | +9.8 | ||
Turnout | 3,015 | 32 | -1 | ||
Conservative hold | Swing | ||||
Party | Candidate | Votes | % | ± | |
---|---|---|---|---|---|
Conservative | Richard Moore | 1,967 | 64.9 | +2.0 | |
BNP | Irene Bateman | 407 | 13.4 | +2.3 | |
Liberal Democrat | Geoffrey Taylor | 384 | 12.7 | -2.5 | |
Labour | Margaret Viney | 275 | 9.1 | -1.7 | |
Majority | 1,506 | 51.4 | +3.7 | ||
Turnout | 3,033 | 36 | -0 | ||
Conservative hold | Swing | ||||
Party | Candidate | Votes | % | ± | |
---|---|---|---|---|---|
Conservative | Stuart Allen | 1,311 | 68.5 | +7.7 | |
BNP | Carolyn Rossiter | 251 | 13.1 | -0.4 | |
Labour | Anthony Borlase | 218 | 11.4 | +0.9 | |
Liberal Democrat | Jennifer Cole | 135 | 7.0 | +0.4 | |
Majority | 1,060 | 55.4 | +8.1 | ||
Turnout | 1,915 | 30 | -6 | ||
Conservative hold | Swing | ||||
Party | Candidate | Votes | % | ± | |
---|---|---|---|---|---|
Labour | Paul Kirkman | 1,013 | 40.1 | -2.0 | |
Conservative | Jim Devlin | 636 | 25.2 | +2.0 | |
BNP | Leonard Heather | 628 | 24.9 | +2.0 | |
Liberal Democrat | John Lutton | 250 | 9.9 | -1.9 | |
Majority | 377 | 14.9 | -3.9 | ||
Turnout | 2,527 | 27 | -1 | ||
Labour hold | Swing | ||||
Party | Candidate | Votes | % | ± | |
---|---|---|---|---|---|
Conservative | Frank Tomlin | 1,020 | 45.1 | +11.8 | |
Labour | David Kirkman | 661 | 29.2 | +4.7 | |
BNP | David King | 387 | 17.1 | +5.5 | |
Liberal Democrat | Jonathan Myall | 193 | 8.5 | +4.9 | |
Majority | 359 | 15.9 | +7.0 | ||
Turnout | 2,261 | 27 | -4 | ||
Conservative hold | Swing | ||||
Party | Candidate | Votes | % | ± | |
---|---|---|---|---|---|
Conservative | Stephen Hillier | 1,176 | 57.6 | -5.0 | |
Labour | William Archibald | 283 | 13.9 | -2.5 | |
BNP | Kevin Swaby | 197 | 9.6 | +9.6 | |
UKIP | Imelda Clancy | 152 | 7.4 | +7.4 | |
Liberal Democrat | Emma Peall | 130 | 6.4 | -4.7 | |
Green | Annie Humphries | 104 | 5.1 | -4.8 | |
Majority | 893 | 43.7 | -2.5 | ||
Turnout | 2,042 | 30 | -5 | ||
Conservative hold | Swing | ||||
Party | Candidate | Votes | % | ± | |
---|---|---|---|---|---|
Labour | Lynda Gordon | 972 | 43.8 | +4.3 | |
Conservative | Mark Coxshall | 604 | 27.2 | -1.1 | |
BNP | Jay Slaven | 358 | 16.1 | -0.2 | |
Liberal Democrat | Stephen Nice | 160 | 7.2 | -2.6 | |
Green | Ernest Humphries | 126 | 5.7 | -0.3 | |
Majority | 368 | 16.6 | +5.4 | ||
Turnout | 2,220 | 25 | -0 | ||
Labour hold | Swing | ||||
Party | Candidate | Votes | % | ± | |
---|---|---|---|---|---|
Liberal Democrat | Geoff Williams | 1,247 | 43.0 | -8.0 | |
Conservative | Kerry Whitaker | 697 | 24.1 | -6.6 | |
Labour | Mark Witzer | 495 | 17.1 | -1.2 | |
BNP | Mark Henry | 459 | 15.8 | +15.8 | |
Majority | 550 | 19.0 | -1.3 | ||
Turnout | 2,898 | 33 | +0 | ||
Liberal Democrat hold | Swing | ||||
Party | Candidate | Votes | % | ± | |
---|---|---|---|---|---|
Conservative | Andrew Baggott | 945 | 40.7 | +7.3 | |
Labour | Emma Collins | 739 | 31.9 | -2.4 | |
BNP | Raymond Pearce | 370 | 15.9 | -1.0 | |
UKIP | Terry McBride | 266 | 11.5 | +3.7 | |
Majority | 205 | 8.9 | |||
Turnout | 2,320 | 25 | +2 | ||
Conservative hold | Swing | ||||
Party | Candidate | Votes | % | ± | |
---|---|---|---|---|---|
Conservative | Ann Blake | 1,255 | 52.0 | +5.3 | |
Labour | Richard Llewellyn | 604 | 25.0 | -6.1 | |
BNP | Sidney Chaney | 383 | 15.9 | +0.7 | |
Liberal Democrat | Vivien Howard | 171 | 7.1 | +7.1 | |
Majority | 651 | 27.0 | +11.4 | ||
Turnout | 2,413 | 27 | -1 | ||
Conservative hold | Swing | ||||
Party | Candidate | Votes | % | ± | |
---|---|---|---|---|---|
Labour | Philip Rackley | 539 | 38.1 | -3.2 | |
Conservative | Gwen Ball | 408 | 28.8 | +5.9 | |
BNP | Philip Howell | 305 | 21.6 | +0.1 | |
Liberal Democrat | Michael Dickinson | 163 | 11.5 | +0.9 | |
Majority | 131 | 9.3 | -9.1 | ||
Turnout | 1,415 | 24 | -3 | ||
Labour hold | Swing | ||||
Party | Candidate | Votes | % | ± | |
---|---|---|---|---|---|
Conservative | Luke MacKenzie | 590 | 35.8 | +0.9 | |
Labour | Santa Bennett | 508 | 30.9 | -7.8 | |
BNP | Rodney Leveridge | 289 | 17.6 | -8.8 | |
Liberal Democrat | Philip Jenkins | 104 | 6.3 | +6.3 | |
Independent | Jane Dyer | 72 | 4.4 | +4.4 | |
Independent | David Aitken | 47 | 2.9 | +2.9 | |
Green | Dean Hall | 36 | 2.2 | +2.2 | |
Majority | 82 | 5.0 | |||
Turnout | 1,646 | 24 | -4 | ||
Conservative gain from Independent | Swing | ||||
Party | Candidate | Votes | % | ± | |
---|---|---|---|---|---|
Conservative | Carole Morris | 1,250 | 43.1 | -9.6 | |
Independent | David Harrison | 974 | 33.6 | -0.2 | |
BNP | Anthony Gladwin | 289 | 10.0 | +10.0 | |
Labour | Christopher Wilson | 230 | 7.9 | -5.6 | |
Liberal Democrat | Michael Woods | 154 | 5.3 | +5.3 | |
Majority | 276 | 9.5 | -9.4 | ||
Turnout | 2,897 | 31 | -2 | ||
Conservative hold | Swing | ||||
The 2007 St Helens Metropolitan Borough Council election took place on 3 May 2007 to elect members of St Helens Metropolitan Borough Council in Merseyside, England. One third of the council was up for election and the council stayed under no overall control.
The 2008 Cheltenham Council election took place on 1 May 2008 to elect members of Cheltenham Borough Council in Gloucestershire, England. Half of the council was up for election and the council stayed under no overall control.
The 2006 Sunderland Council election took place on 4 May 2006 to elect members of Sunderland City Council in Tyne and Wear, England. One third of the Council was up for election and the Labour party stayed in overall control.
The 2008 Sunderland Council election took place on 1 May 2008 to elect members of Sunderland Metropolitan Borough Council in Tyne and Wear, England. One third of the council was up for election and the Labour party stayed in overall control of the council.
The 2010 Sunderland Council election took place on 6 May 2010 to elect members of Sunderland Metropolitan Borough Council in Tyne and Wear, England. One third of the council was up for election and the Labour party stayed in overall control of the council. The election took place on the same day as the 2010 General Election.
The 2008 Harrogate Council election took place on 1 May 2008 to elect members of Harrogate Borough Council in North Yorkshire, England. One third of the council was up for election and the council stayed under no overall control.
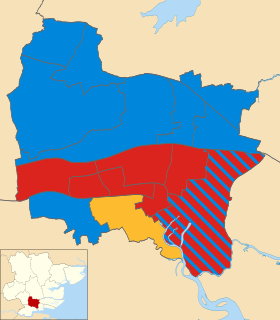
The 2002 Basildon District Council election took place on 2 May 2002 to elect members of Basildon District Council in Essex, England. The whole council was up for election with boundary changes since the last election in 2000. The council stayed under no overall control.
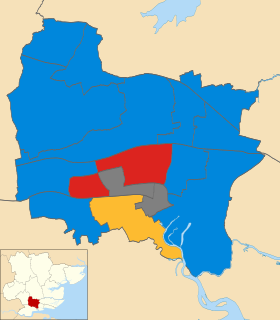
The 2006 Basildon District Council election took place on 4 May 2006 to elect members of Basildon District Council in Essex, England. One third of the council was up for election and the Conservative party stayed in overall control of the council.
The 2007 Basildon District Council election took place on 3 May 2007 to elect members of Basildon District Council in Essex, England. One third of the council was up for election and the Conservative party stayed in overall control of the council.
The 2011 Basildon Council election took place on 5 May 2011 to elect members of Basildon Borough Council in Essex, England. One third of the council was up for election and the Conservative party stayed in overall control of the council.
The 2006 Basingstoke and Deane Council election took place on 4 May 2006 to elect members of Basingstoke and Deane Borough Council in Hampshire, England. One third of the council was up for election and the council stayed under no overall control.
The 2008 Basingstoke and Deane Council election took place on 1 May 2008 to elect members of Basingstoke and Deane Borough Council in Hampshire, England. The whole council was up for election with boundary changes since the 2007 election. The Conservative party gained overall control of the council from no overall control.
The 2011 Sunderland Council election took place on 5 May 2011 to elect members of Sunderland Metropolitan Borough Council in Tyne and Wear, England. One third of the council was up for election and the Labour party stayed in overall control of the council.
The 2003 Hertsmere Borough Council election took place on 1 May 2003 to elect members of Hertsmere Borough Council in Hertfordshire, England. One third of the council was up for election and the Conservative party stayed in overall control of the council.
The 2007 Carlisle City Council election took place on 3 May 2007 to elect members of Carlisle District Council in Cumbria, England. One third of the council was up for election and the council stayed under no overall control.
The 2008 Colchester Borough Council election took place on 1 May 2008 to elect members of Colchester Borough Council in Essex, England. One third of the council was up for election and the Conservative party lost overall control of the council to no overall control.
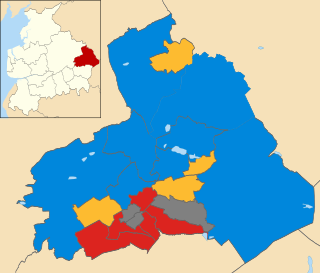
The 2011 Pendle Borough Council election took place on 5 May 2011 to elect members of Pendle Borough Council in Lancashire, England. One third of the council was up for election and the council stayed under no overall control.
The 2012 Pendle Borough Council election took place on 3 May 2012 to elect members of Pendle Borough Council in Lancashire, England. One third of the council was up for election and the council stayed under no overall control.
The 2011 Harlow District Council election took place on 5 May 2011 to elect members of Harlow District Council in Essex, England. One third of the council was up for election and the Conservative party stayed in overall control of the council.
The 2015 Christchurch Borough Council election took place on 7 May 2015 to elect members of Christchurch Borough Council in Dorset, England. The whole council was up for election and the Conservative party stayed in overall control of the council.