Colchester Borough Council election, 1990

Last updated
Colchester Borough Council election, 1990
Flag of the United Kingdom.svg
  1988 3 May 1990 (1990-05-03) 1991  

60 seats
31 seats needed for a majority

  First party Second party Third party
 
Party Liberal Democrat Conservative Labour
Last election 24 24 9
Seats before 24 24 9
Seats won 28 17 12
Seat changeIncrease2.svg 4Decrease2.svg 7Increase2.svg 3
Popular vote 46,517 39,816 37,530
Percentage 35.8 30.6 28.9
SwingIncrease2.svg3.4Decrease2.svg9.1Increase2.svg3.9

  Fourth party Fifth party
 
Party Tiptree Residents Independent
Last election 3 1
Seats before 3 1
Seats won 3 0
Seat changeSteady2.svgDecrease2.svg 1
Popular vote 3,170 763
Percentage 2.4 0.6
SwingDecrease2.svg0.3Increase2.svg0.5

Elections to the Borough of Colchester , a local government district and borough in Essex, England, took place in 1990. Due to boundary changes the entire council was up for election as opposed to the normal one-third.

Borough of Colchester Place in England

The Borough of Colchester is a local government district and borough in Essex, England, named after its main town, Colchester. The borough covers an area of 125 square miles (320 km2) and stretches from Dedham Vale on the Suffolk border in the north to Mersea Island on the Colne Estuary in the south.

Non-metropolitan district Type of local government district in England

Non-metropolitan districts, or colloquially "shire districts", are a type of local government district in England. As created, they are sub-divisions of non-metropolitan counties in a two-tier arrangement.

Borough status in the United Kingdom is granted by royal charter to local government districts in England, Wales and Northern Ireland. The status is purely honorary, and does not give any additional powers to the council or inhabitants of the district. In Scotland, similarly chartered communities were known as royal burghs, although the status is no longer granted.

Contents

Results Summary

Colchester Borough Council election, 1990
PartySeatsGainsLossesNet gain/lossSeats %Votes %Votes+/−
  Liberal Democrat 28 4 2Increase2.svg 4 35.4 46,791
  Conservative 17 3 6Decrease2.svg 7 30.8 40,625
  Labour 12 5 0Increase2.svg 3 29.1 38,486
  Tiptree Residents 3 0 0Steady2.svg 2.4 3,170
  Green 0 0 0Steady2.svg 1.1 1,438
  Independent 0 0 -1Steady2.svg 1 0.6 763
  SDP 0 0 0Steady2.svg 0.5 640
  Anti-Poll Tax 0 0 0Steady2.svg 0.1 160N/A

Ward Results

Berechurch

Berechurch
PartyCandidateVotes%±
Liberal Democrat H. Davis1,54517.3N/A
Liberal Democrat J. Stevens1,46516.4N/A
Liberal Democrat Terry Sutton1,34015.0N/A
Labour R. McQuilty 1,210 13.6N/A
Labour Dave Harris 1,069 12.0N/A
Labour Don Quinn 1,016 11.4N/A
Conservative J. Parsons 451 5.1N/A
Conservative S. Wilson 429 4.8N/A
Conservative N. Peckston 398 4.5N/A
Majority 130 1.4
Turnout 51.3
Liberal Democrat hold Swing
Party%+/-
Liberal Democrat 48.8 +11.4
Labour 36.9 -0.1
Conservative 14.3 -11.3

Birch Messing Copford

Birch Messing Copford
PartyCandidateVotes%±
Conservative P. Crowe61951.0N/A
Labour C. Shreeve 297 26.3N/A
Liberal Democrat K. Nelson 257 22.7N/A
Majority 354 24.7
Turnout 48.5
Conservative win (new seat)

Boxted & Langham

Boxted & Langham
PartyCandidateVotes%±
Conservative 'J. Garrett61959.9-3.1
Liberal Democrat W. Chivers 273 26.4-1.0
Labour F. Richards 142 13.7+4.1
Majority 346 33.5
Turnout 55.1
Conservative hold Swing

Castle

Castle
PartyCandidateVotes%±
Liberal Democrat Chris Hall1,23915.5N/A
Labour Ken Cooke1,15414.4N/A
Liberal Democrat J. Carter1,02012.7N/A
Liberal Democrat K. Merriweather 969 12.1N/A
Labour J. Cant 790 9.9N/A
Conservative E. Humphreys 698 8.7N/A
Labour R. Turp 663 8.3N/A
Conservative G. Haig-Thomas 581 7.2N/A
Conservative M. Snaith 568 7.1N/A
Green T. Manley 333 4.2N/A
Majority 230 2.5
Turnout 51.5
Liberal Democrat hold Swing
Labour hold Swing
Liberal Democrat hold Swing

Dedham

Dedham
PartyCandidateVotes%±
Liberal Democrat G. Williams56557.5+3.6
Conservative N. Everett 364 37.0-6.4
Labour G. Newman 54 5.5+2.8
Majority 201 20.4
Turnout 61.3
Liberal Democrat hold Swing

East Donyland

East Donyland
PartyCandidateVotes%±
Labour B. Wilding36440.3+9.1
Conservative J. Sanderson 317 35.1-21.8
Liberal Democrat Barry Woodward 222 24.6+12.7
Majority 47 5.2
Turnout 53.3
Labour gain from Conservative Swing

Fordham

Fordham
PartyCandidateVotes%±
Conservative D. Cannon44055.5-10.6
Labour R. Lee 220 27.7+9.0
Liberal Democrat M. Thomas 133 16.8+1.6
Majority 27.7
Turnout 55.6
Conservative hold Swing

Great & Little Horkesley

Great & Little Horkesley
PartyCandidateVotes%±
Conservative E. Paice50055.1-4.4
Labour L. Wood 257 28.3+14.9
Liberal Democrat H. Chamberlain 151 16.6-10.5
Majority
Turnout
Conservative hold Swing

Great Tey

Great Tey
PartyCandidateVotes%±
Liberal Democrat J. Brice53154.3+36.8
Conservative I. Stratford 352 36.0-24.4
Labour P. Doncaster 95 9.7+1.8
Majority
Turnout
Liberal Democrat gain from Conservative Swing

Harbour

Harbour
PartyCandidateVotes%±
Labour J. Bird1,29218.7N/A
Liberal Democrat E. Fowler1,19817.3N/A
Labour Rod Green1,18317.1N/A
Labour S. Manning-Press 936 13.5N/A
Liberal Democrat P. Blandon 881 12.7N/A
Liberal Democrat J. Gilfillan 787 11.4N/A
Conservative M. Coyne 490 7.1N/A
Anti Poll Tax D. Smith 160 2.3N/A
Majority 3.0
Turnout 42.5
Labour hold Swing
Liberal Democrat hold Swing
Labour gain from Liberal Democrat Swing

Lexden

Lexden
PartyCandidateVotes%±
Liberal Democrat Ian Trusler1,45219.6
Liberal Democrat W. Sandford1,29017.4
Liberal Democrat B. Williamson1,20816.3
Conservative S. Lewis 1,054 14.2
Conservative P. Crafford 1,015 13.7
Conservative C. Manning-Press 933 12.6
Labour J. Crawford 245 3.3
Labour D. Francis 225 3.0
Majority
Turnout
Liberal Democrat hold Swing

Marks Tey

Marks Tey
PartyCandidateVotes%±
Conservative R. Gower44342.0-7.2
Liberal Democrat G. Ambridge 313 29.7+4.8
Labour G. Taylor 299 28.3+7.7
Majority
Turnout
Conservative hold Swing

Mile End

Mile End
PartyCandidateVotes%±
Conservative J. Fulford1,36117.2
Conservative P. Borges1,35317.1
Conservative J. Fulford1,33616.9
Labour M. Snowling 1,026 12.9
Liberal Democrat B. Trusler 986 12.4
Labour Sandra Benedetti 951 12.0
Labour A. Harley 911 11.5
Majority
Turnout
Conservative hold Swing
Conservative win (new seat)

New Town

New Town
PartyCandidateVotes%±
Liberal Democrat Bob Russell 1,60521.5
Liberal Democrat J. Stevens1,47919.8
Liberal Democrat S. Haylock1,39618.7
Labour A. Clavane 842 11.3
Labour D. Speed 833 11.1
Labour S. McBride-Dick 817 10.9
Conservative J. Clarke 296 4.0
Social Democratic J. Parrick 209 2.8
Majority
Turnout
Liberal Democrat hold Swing

Prettygate

Prettygate
PartyCandidateVotes%±
Liberal Democrat D. Goss1,82319.8
Liberal Democrat Martin Hunt1,79119.5
Liberal Democrat R. Yates1,70718.6
Conservative H. Stutter 1,096 11.9
Conservative W. Kimberley 1,096 11.9
Conservative S. Rowley 1,050 11.4
Labour T. Pearson 632 6.9
Majority
Turnout
Liberal Democrat hold Swing

Pyefleet

Pyefleet
PartyCandidateVotes%±
Conservative J. Taber56253.4-20.3
Liberal Democrat P. Treacher 490 46.6+29.7
Majority
Turnout
Conservative hold Swing

Shrub End

Shrub End
PartyCandidateVotes%±
Liberal Democrat G. Daldry1,08521.1
Liberal Democrat S. Cawley1,04320.3
Liberal Democrat K. Starling96418.8
Labour D. Bober 607 11.8
Labour F. Wilkin 593 11.6
Labour R. Edwards 480 9.4
Conservative A. Edwards 360 7.0
Majority
Turnout
Liberal Democrat hold Swing

St. Andrew's

St. Andrew's
PartyCandidateVotes%±
Labour G. Bober1,41725.8
Labour J. Baylis1,28523.4
Labour P. Truscott1,21322.1
Liberal Democrat P. Brady 433 7.9
Conservative A. Pearson 391 7.1
Conservative N. Taylor 376 6.9
Green M. Shabbeer 374 6.8
Majority
Turnout
Labour hold Swing
Labour hold Swing
Labour hold Swing

St. Anne's

St. Anne's
PartyCandidateVotes%±
Labour M. Frank1,23415.9
Labour K. Hindle1,18215.3
Liberal Democrat Mike Hogg1,16415.0
Liberal Democrat E. Crudden 1,091 14.1
Labour Tim Young 1,069 13.8
Liberal Democrat J. Fellows 1,022 13.2
Conservative E. Hamilton 500 6.5
Conservative N. Elcombe 481 6.2
Majority
Turnout
Labour hold Swing
Labour gain from Liberal Democrat Swing
Liberal Democrat hold Swing

St. John's

St. John's
PartyCandidateVotes%±
Liberal Democrat John Baker1,71819.1
Liberal Democrat Ray Gamble1,56217.4
Liberal Democrat P. Hiller1,50216.7
Conservative J. Baldock 1,152 12.8
Conservative D. McBean 1,039 11.6
Conservative D. Mills 1,020 11.3
Labour M. Scott 548 6.1
Labour L. Shelley 451 5.0
Majority
Turnout
Liberal Democrat hold Swing
Liberal Democrat gain from Conservative Swing

St. Mary's

St. Mary's
PartyCandidateVotes%±
Conservative R. Spendlove1,05216.5
Conservative Nigel Chapman98315.4
Conservative H. Pawsey95314.9
Labour Pauline Cook 871 13.6
Labour M. Lee 763 11.9
Labour K. Taylor 757 11.9
Liberal Democrat R. Hunt 575 9.0
Social Democratic M. Patrick 431 6.8
Majority
Turnout
Conservative hold Swing

Stanway

Stanway
PartyCandidateVotes%±
Liberal Democrat J. Ellis1,547
Liberal Democrat Colin Sykes1,481
Liberal Democrat K. Davis1,355
Conservative J. Orpen-Smellie 858
Conservative A. McNeill 814
Conservative E. Gawthrop 806
Labour S. Broadhurst 463
Labour E. Plowright 444
Labour J. Young 438
Majority
Turnout
Liberal Democrat hold Swing
Liberal Democrat gain from Conservative Swing
Liberal Democrat hold Swing

Tiptree

Tiptree
PartyCandidateVotes%±
Tiptree Residents E. Bird1,19717.5
Tiptree Residents J. Webb1,02315.0
Tiptree Residents J. Elliott95013.9
Conservative B. Martin 895 13.1
Independent J. Olley 763 11.2
Labour M. Dale 724 10.6
Labour A. Axtell 653 9.5
Labour E. Garwood 634 9.3
Majority
Turnout
Tiptree Residents hold Swing

West Bergholt & Eight Ash Green

West Bergholt & Eight Ash Green
PartyCandidateVotes%±
Liberal Democrat S. Baldwin1,16042.0N/A
Conservative J. Lampon84030.4N/A
Conservative J. Nicholls 760 27.5N/A
Majority
Turnout
Liberal Democrat win (new seat)
Conservative win (new seat)

Winstree

Winstree
PartyCandidateVotes%±
Conservative M. Fairhead65265.3+6.5
Liberal Democrat D. Sykes 346 34.7+2.4
Majority 30.7
Turnout 55.8
Conservative hold Swing

West Mersea

West Mersea
PartyCandidateVotes%±
Conservative M. Kimberley1,59327.2
Conservative J. Stewart1,51625.9
Conservative J. Bouckley1,49925.6
Liberal Democrat N. License 627 10.7
Labour E. Newman 620 10.6
Majority
Turnout
Conservative hold Swing

Wivenhoe

Wivenhoe
PartyCandidateVotes%±
Labour R. Richardson1,62719.8N/A
Labour S. Sharp1,54518.8N/A
Labour R. Newman1,41517.2N/A
Conservative D. Adams 980 11.9N/A
Conservative C. Thompson 977 11.9N/A
Conservative M. Last 940 11.4N/A
Green P. Harris 731 8.9N/A
Majority 19.4
Turnout 45.4
Labour hold Swing
Labour gain from Conservative Swing

Related Research Articles

Kingston upon Thames London Borough Council elections

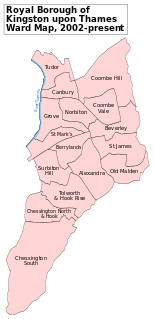
Kingston upon Thames Council is elected every four years.

Barnet London Borough Council elections

Barnet London Borough Council in London, England is elected every four years. Since the last boundary changes in 2002, 63 councillors have been elected from 21 wards.

Blackburn with Darwen is a unitary authority in Lancashire, England. Until 1 April 1998 it was a non-metropolitan district.

Bromley London Borough Council elections

Bromley Council is elected every four years.

2003 Wirral Metropolitan Borough Council election

The 2003 Wirral Metropolitan Borough Council election took place on 1 May 2003 to elect members of Wirral Metropolitan Borough Council in England. This election was held on the same day as other local elections.

Redbridge London Borough Council elections

Redbridge London Borough Council is elected every four years.

Hounslow London Borough Council elections

Hounslow Council in London, England is elected every four years. 60 councillors are elected from 20 wards, with by-elections held to fill any vacancies between elections.

Southend-on-Sea is a unitary authority in Essex, England. Until 1 April 1998 it was a non-metropolitan district.

Southwark London Borough Council elections

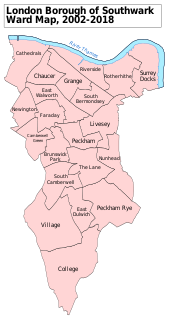
Southwark London Borough Council in London, England is elected every four years. Since the last boundary changes in 2002, 63 councillors have been elected from 21 wards.

Hackney London Borough Council elections

Hackney London Borough Council in London is elected every four years.

Havering London Borough Council elections

Havering London Borough Council in London, England is elected every four years. Since the last boundary changes in 2002, 54 councillors have been elected from 18 wards.

2008 Wirral Metropolitan Borough Council election

The 2008 Wirral Metropolitan Borough Council election took place on 1 May 2008 to elect members of Wirral Metropolitan Borough Council in England. This election was held on the same day as other local elections.

Hillingdon London Borough Council elections

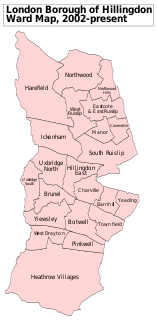
Hillingdon Council in London, England is elected every four years. Since the 2002 boundary changes the council is composed of 65 councillors.

2011 Wirral Metropolitan Borough Council election

The 2011 Wirral Metropolitan Borough Council election took place on 5 May 2011 to elect members of Wirral Metropolitan Borough Council in England. This election was held on the same day as other local elections.

Greenwich London Borough Council elections

Greenwich London Borough Council in London, England is elected every four years. Since the last boundary changes in 2002, 51 councillors have been elected from 17 wards.

Wandsworth London Borough Council elections

Wandsworth London Borough Council in London, England, is elected every four years. Since the last boundary changes in 2002, 60 councillors have been elected from 20 wards.

Newham London Borough Council elections

Newham London Borough Council is elected every four years.

2015 Wirral Metropolitan Borough Council election

The 2015 Wirral Metropolitan Borough Council election took place on 7 May 2015 to elect members of Wirral Metropolitan Borough Council in England. This election was held on the same day as other local elections.

2016 Wirral Metropolitan Borough Council election

The 2016 Wirral Metropolitan Borough Council election took place on 5 May 2016 to elect members of Wirral Metropolitan Borough Council in England. This election was held on the same day as other local elections.

2018 United Kingdom local elections

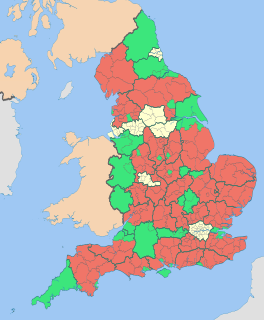
Council elections in England were held on Thursday 3 May 2018. Elections were held in all 32 London boroughs, 34 metropolitan boroughs, 67 district and borough councils and 17 unitary authorities. There were also direct elections for the mayoralties of Hackney, Lewisham, Newham, Tower Hamlets and Watford.