
Bristol East is a constituency recreated in 1983 covering the eastern part of the City of Bristol, represented in the House of Commons of the UK Parliament since 2005 by Kerry McCarthy of the Labour Party. An earlier guise of the seat existed between 1885 and 1950.

The city of Bristol, England, is a unitary authority, represented by four MPs representing seats wholly within the city boundaries. As well as these, Filton and Bradley Stoke covers the northern urban fringe in South Gloucestershire and the north eastern urban fringe is in the Kingswood constituency. The overall trend of both local and national representation became left of centre, favouring the Labour Party and Liberal Democrats during the latter 20th century, but there was a shift to the right in the 2010 general election. The city has a tradition of local activism, with environmental issues and sustainable transport being prominent issues in the city.

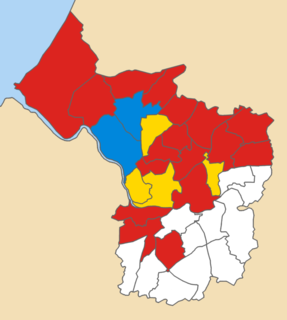
The 1983 Bristol City Council election took place on 5 May 1983 to elect members of Bristol City Council in England. This was on the same day as other local elections. All seats were up for election, two seats in every ward, due to the introduction of new ward boundaries. Therefore, direct comparisons with previous elections are not possible. Majority is the number of votes separating the 2nd and 3rd candidates. Alliance candidates who were Liberals are described as such. No party had an overall majority; as the largest party the Conservatives formed a minority administration.

The 1984 Bristol City Council election took place on 3 May 1984 to elect members of Bristol City Council in England. This was on the same day as other local elections. In this election, one-third of seats were up for election. There was a general but small swing from Conservative to Labour. Labour regained their position as the largest party and took minority control of the Council.

The 1986 Bristol City Council election took place on 8 May 1986 to elect members of Bristol City Council in England. This was on the same day as other local elections. One third of seats in the 1986 Council Elections in the English city of Bristol were up for election. The election in Brislington West was a by-election. There was a small swing away from the Conservatives and Labour regained a majority on the Council, which they kept until 2003.

The 1987 Bristol City Council election took place on 7 May 1987 to elect members of Bristol City Council in England. This was on the same day as other local elections. One third of seats were up for election. There was also a by-election in Clifton. There was a general but very small swing away from the Conservatives.

The 1988 Bristol City Council election took place on 5 May 1988 to elect members of Bristol City Council in England. This was on the same day as other local elections. One third of seats were up for election. This was the first election following the merger of the Liberal Party and SDP to form the Social & Liberal Democrats. There were also several candidates representing the continuing SDP. There was a general small swing to Labour.

The 1991 Bristol City Council election took place on 2 May 1991 to elect members of Bristol City Council in England. This was on the same day as other local elections. One third of seats were up for election. Two seats were contested in Windmill Hill due to an extra vacancy occurring. There was a general swing against the Conservatives. In Lockleaze, the Labour Party failed to field a candidate because of a nomination papers error.

The 1992 Bristol City Council election took place on 7 May 1992 to elect members of Bristol City Council in England. This was on the same day as other local elections. One third of seats were up for election. Two seats were contested in Hartcliffe due to an extra vacancy occurring. The elections were held just weeks after John Major's unexpected 1992 General election victory, and mirroring that result there was a strong swing from Labour to Conservative.
The 1994 Bristol City Council election took place on 5 May 1994 to elect members of Bristol City Council in England. This was on the same day as other local elections. One third of seats were up for election. The Bristol Party was formed by Bristol Rovers fans to campaign for a new stadium for the club. There was a general swing from the Conservatives and Greens to the Liberal Democrats, reflecting the beginning of the Conservative decline nationally and also the Liberal Democrat recovery after the merger troubles.
Bristol City Council is a unitary authority and ceremonial county in England. Originally formed on 1 April 1974 as a non-metropolitan district as a result of the Local Government Act 1972. It was envisaged that Bristol would share power with Avon County Council, an arrangement that lasted until 1996 when it was made into a unitary authority by the Local Government Commission for England, which abolished the county of Avon and gave Bristol City Council control of Avon Council's responsibilities.
The 2002 Stroud Council election took place on 2 May 2002 to elect members of Stroud District Council in Gloucestershire, England. The whole council was up for election with boundary changes since the last election in 2000 reducing the number of seats by 4. The Conservative party gained overall control of the council from no overall control.
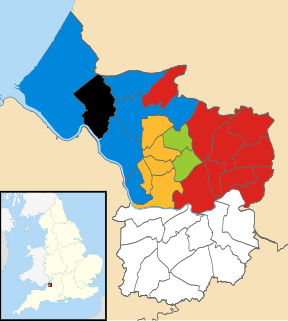
The 2011 Bristol City Council elections were held on Thursday 5 May 2011, for 24 seats, that being one third of the total number of councillors. The Liberal Democrats, who had won overall control of the council in 2009 and increased their majority in 2010, experienced a drop in support and lost 5 seats; 4 to the Labour Party and 1 to the Green Party, which gained its second ever council seat in Bristol. This meant that the Lib Dems no longer had a majority on the council. However, they continued to run the council, relying on opposition groups to vote through any proposal.
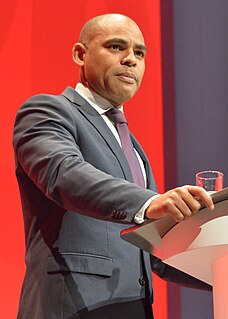
The Mayor of Bristol is the head of Bristol City Council. The Mayor is an elected politician who, along with the 70 members of Bristol City Council, is responsible for the strategic government of the city of Bristol, England. The role was created after a local referendum held on 3 May 2012, which followed the passage of the Localism Act 2011. 41,032 voted for an elected mayor and 35,880 voted against, with a turnout of 24%. An election for the new post was held on 15 November 2012.

The 2013 United Kingdom local elections took place on Thursday 2 May 2013. Elections were held in 35 English councils: all 27 non-metropolitan county councils and eight unitary authorities, and in one Welsh unitary authority. Direct mayoral elections took place in Doncaster and North Tyneside. These elections last took place on the 4 June 2009 at the same time as the 2009 European Parliament Elections, except for County Durham, Northumberland and the Anglesey where elections last took place in 2008.
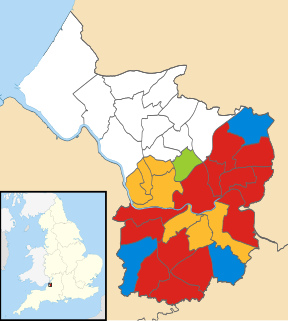
Elections for one third of Bristol City Council were held on 2 May 2013 as part of the United Kingdom local elections, 2013. No party gained overall control.
The 2015 Bristol City Council election took place on 7 May 2015 to elect members of Bristol City Council in England. This was on the same day as other local elections.

The City of Bradford Metropolitan District Council elections were held on Thursday, 4 May 1990, with one third of the council up for election as well as vacancies in Great Horton & Ilkley to be elected. Labour had suffered a defection prior to the election in the University ward, with the sitting councillor attempting, unsuccessfully, to defend it as a Conservative. Labour regained control of the council from no overall control following numerous gains from the Conservatives.
The 2016 Bristol City Council election took place on Thursday 5 May 2016, alongside nationwide local elections. Following a boundary review, the number of wards in the City was reduced to 34, with each electing one, two or three Councillors. The overall number of Councillors remained 70, with all seats are up for election at the same time. Elections would then be held every 4 years.

The 1999 Bristol City Council election took place on 6 May 1999, on the same day as other local elections. All seats were up for election due to boundary changes, with each ward electing 2 councillors. The total number of seats on the council increased by 2 due to the creation of a new ward: Clifton East.
