Bristol City Council election, 1994

Last updated
Bristol City Council election, 1994
Flag of England.svg
  1992 5 May 1994 1995  

23 of 68 seats (one third) to Bristol City Council
35 seats needed for a majority

  First party Second party Third party
 
Party Labour Conservative Liberal Democrat
Seats won 41 19 8
Seat changeIncrease2.svg1Decrease2.svg3Increase2.svg2

Council control before election

Labour Party (UK)

Council control after election

Labour Party (UK)

1994 local election results in Bristol Bristol ward results 1994.png
1994 local election results in Bristol

The 1994 Bristol City Council election took place on 5 May 1994 to elect members of Bristol City Council in England. This was on the same day as other local elections. One third of seats were up for election. The Bristol Party was formed by Bristol Rovers fans to campaign for a new stadium for the club. There was a general swing from the Conservatives and Greens to the Liberal Democrats, reflecting the beginning of the Conservative decline nationally and also the Liberal Democrat recovery after the merger troubles.

Bristol City Council local authority of Bristol, England

Bristol City Council is the local authority of Bristol, England. The council is a unitary authority, and is unusual in the United Kingdom in that its executive function is controlled by a directly elected mayor of Bristol. Bristol has 35 wards, electing a total of 70 councillors.

Ward results

The change is calculated using the results when these actual seats were last contested, i.e. the 1990 election.

Ashley
PartyCandidateVotes%±
Labour N.I. Barton 1,740 60.5 +4.4
Liberal Democrat G.K. Hughes 413 14.4 +7.6
Green D.M. Simpson 367 13.5 -12.4
Conservative J. Eastwood 337 11.7 +0.5
Majority 1,327 46.1
Labour hold Swing -1.6
Avonmouth
PartyCandidateVotes%±
Labour C.M. Lukins 2,288 64.3 -3.5
Conservative I.D. Millard 756 21.2 -2.2
Liberal Democrat P.W. Lloyd 517 14.5 +14.5
Majority 1,532 43.1
Labour hold Swing -0.7
Bedminster
PartyCandidateVotes%±
Labour C.M. Warren 1,674 52.6 -4.8
Conservative J. Lopresti 699 22.0 -1.0
Liberal Democrat M. Sykes 677 21.3 +8.1
Green A. Lewis 132 4.1 -2.3
Majority 1,175 30.6
Labour hold Swing -1.9
Bishopston
PartyCandidateVotes%±
Labour H. Bashforth 1,947 42.9 -2.1
Liberal Democrat D.J.G. Kitson 1,324 29.1 +7.4
Conservative A.S. Waycott 841 18.5 -4.2
Bristol Party E.A. Chappell 254 5.6 +5.6
Green J.M. Quinnell 177 3.9 -6.7
Majority 623 13.7
Labour hold Swing -4.2
Cabot
PartyCandidateVotes%±
Liberal Democrat C.R. Boney 1,648 47.2 +13.0
Labour P.A. Garland 1,089 31.2 -2.3
Conservative A.P. Fox 582 16.7 -4.3
Green P.J. North 173 5.0 -6.3
Majority 559 16.0
Liberal Democrat hold Swing +7.7
Clifton
PartyCandidateVotes%±
Liberal Democrat B.H. Price 2,001 47.2 +32.4
Conservative J. Bretten 1,515 35.7 -1.3
Labour N.J. Currie 571 13.5 -9.4
Green L.S. Hersey 153 3.6 -21.7
Majority 486 11.5
Liberal Democrat gain from Conservative Swing +16.9
Cotham
PartyCandidateVotes%±
Labour C.M. Taylor 1,491 39.3 +2.5
Conservative N.C. Tolchard 1,126 29.6 -4.3
Liberal Democrat P.M.W. Case 1,015 26.7 +13.5
Green G. Collard 166 4.4 -11.8
Majority 365 9.6
Labour hold Swing +3.4
Easton
PartyCandidateVotes%±
Liberal Democrat J.F. Kiely 1,736 49.0 +17.2
Labour R. Moss 1,387 39.2 -12.3
Bristol Party I.C.S. Vickery 181 5.1 +5.1
Conservative C.R. Bretherton 134 3.8 -4.6
Green S.M. Jeffery 104 2.9 -5.4
Majority 349 9.9
Liberal Democrat gain from Labour Swing +14.8
Eastville
PartyCandidateVotes%±
Labour S.J. Andrews 1,584 43.1 -4.3
Conservative T.C. Collins 894 24.3 -9.4
Bristol Party A.J. Locke 574 15.6 +15.6
Liberal Democrat P.R. Potts 541 14.7 +3.3
Green R. Nicholls 84 2.3 -5.2
Majority 690 18.8
Labour hold Swing +2.6
Filwood
PartyCandidateVotes%±
Labour D.J. Bryan 1,156 58.6 -5.6
Militant Labour I.P. Marshall 397 20.1 +20.1
Liberal Democrat J.M. Nichol 215 10.9 +10.9
Conservative S.M. Willis 166 8.5 +8.5
Green G.H. Davey 40 2.0 -8.7
Majority 759 38.4
Labour hold Swing -12.9
Frome Vale
PartyCandidateVotes%±
Labour M.P. Langley 1,870 42.8 -9.4
Conservative V.C. Eaglestone 1,113 25.5 -5.5
Liberal Democrat W.G. Barrett 843 19.3 +10.0
Bristol Party R.J. Sparks 541 12.4 +12.4
Majority 757 17.3
Labour hold Swing -2.0
Henbury
PartyCandidateVotes%±
Labour J.D. Fisk 1,957 51.6 -4.8
Conservative A.J. Smith 942 24.9 -1.2
Liberal Democrat J.R. Culliford 516 13.6 +2.9
Bristol Party S.J.F. Burns 374 9.9 +9.9
Majority 1,015 26.9
Labour hold Swing -1.8
Henleaze
PartyCandidateVotes%±
Liberal Democrat R.M. Brown 2,330 49.4 +30.5
Conservative G.J.P. Browne 1,777 37.7 -13.9
Labour K. Evans 484 10.3 -8.8
Green D.N. Wall 127 2.7 -7.8
Majority 553 11.7
Liberal Democrat gain from Conservative Swing +22.2
Hillfields
PartyCandidateVotes%±
Labour J.D. Naysmith 1,734 55.8 -4.0
Liberal Democrat J.P. Corrigan 483 15.6 +3.9
Conservative A.D. Seville 461 14.8 -3.8
Bristol Party D.J. Down 428 13.8 +13.8
Majority 1,251 40.3
Labour hold Swing -4.0
Horfield
PartyCandidateVotes%±
Labour D.R. Poole 1,694 43.1 -0.2
Conservative L.G. Collison 1,239 31.5 -8.5
Liberal Democrat S.E. Young 534 13.6 +2.0
Bristol Party A.F. Poole 392 10.0 +10.0
Green P.M. Scott 75 1.9 -3.2
Majority 455 11.6
Labour hold Swing +4.2
Kingsweston
PartyCandidateVotes%±
Labour R. Clarke 2,017 60.1 +0.8
Conservative J. Veale 802 23.9 -0.4
Liberal Democrat F.R. Young 538 16.0 +3.8
Majority 1,215 36.2
Labour hold Swing +0.6
Lawrence Hill
PartyCandidateVotes%±
Labour R.J. Channon 1,743 61.7 -9.8
Liberal Democrat G.L. Williams 368 13.0 +4.2
Bristol Party P.D. Burrows 363 12.8 +12.8
Conservative H. Richmond 249 8.8 -3.5
Green N.E. Whittingham 102 3.6 -3.8
Majority 1,375 48.7
Labour hold Swing -7.0
Lockleaze
PartyCandidateVotes%±
Labour J. Patterson 1,646 53.6 -12.7
Liberal Democrat J. Grace 756 24.6 +13.0
Conservative A. Low 370 12.0 -4.5
Bristol Party V.F. Kemp 300 9.8 +9.8
Majority 890 29.0
Labour hold Swing -12.9
Redland
PartyCandidateVotes%±
Labour J.B. McLaren 1,750 39.0 +2.4
Conservative I.E. Temple 1,323 29.5 -7.3
Liberal Democrat D.J. Richer 1,203 26.8 +12.5
Green G. Nicholas 208 4.6 -11.7
Majority 427 9.5
Labour gain from Conservative Swing +4.9
Southmead
PartyCandidateVotes%±
Labour P.W. Hammond 1,547 53.8 -7.7
Conservative J. Abdalla 503 17.5 -3.9
Liberal Democrat S.R. Young 418 14.5 +5.5
Bristol Party J.S. Steynings 405 14.1 +14.1
Majority 1,044 36.3
Labour hold Swing -1.9
Southville
PartyCandidateVotes%±
Labour T. Coombes 1,929 58.6 +0.8
Liberal Democrat R.F. Hughes 626 19.0 +8.6
Conservative C.A.P. Stephenson 557 16.9 -4.1
Green C.N. Bolton 180 5.5 -5.3
Majority 1,303 39.6
Labour hold Swing -3.9
Stoke Bishop
PartyCandidateVotes%±
Conservative P.J. Abraham 2,264 53.0 +0.3
Liberal Democrat E.A. Carpenter 1,282 30.0 +10.6
Labour G.E. Waddington 594 13.9 -4.9
Green P.A.E. Small 133 3.1 -6.0
Majority 982 23.0
Conservative hold Swing -5.2
Westbury-on-Trym
PartyCandidateVotes%±
Conservative D.H. Poole 2,412 54.9 -3.7
Liberal Democrat J.H.W. Masters 1,389 31.6 +17.0
Labour T.R. Sage 593 13.5 -3.7
Majority 1,023 23.3
Conservative hold Swing -10.4

Sources

Related Research Articles

Politics of Bristol

The city of Bristol, England, is a unitary authority, represented by four MPs representing seats wholly within the city boundaries. As well as these, Filton and Bradley Stoke covers the northern urban fringe in South Gloucestershire and the north eastern urban fringe is in the Kingswood constituency. The overall trend of both local and national representation became left of centre, favouring the Labour Party and Liberal Democrats during the latter 20th century, but there was a shift to the right in the 2010 general election. The city has a tradition of local activism, with environmental issues and sustainable transport being prominent issues in the city.

1988 Bristol City Council election

The 1988 Bristol City Council election took place on 5 May 1988 to elect members of Bristol City Council in England. This was on the same day as other local elections. One third of seats were up for election. This was the first election following the merger of the Liberal Party and SDP to form the Social & Liberal Democrats. There were also several candidates representing the continuing SDP. There was a general small swing to Labour.

1995 Bristol City Council election

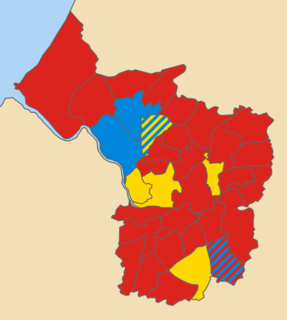
The 1995 Bristol City Council election took place on 4 May 1995 with all seats being up for election, in preparation for Bristol City Council becoming a Unitary Authority following the abolition of Avon County Council. The same ward boundaries were used, however these are elections to a new authority and cannot be considered gains or losses compared to previously held seats.

The 2002 Wokingham District Council election took place on 2 May 2002 to elect members of Wokingham Unitary Council in Berkshire, England. One third of the council was up for election and the Conservative party gained overall control of the council from no overall control.

2007 Woking Borough Council election

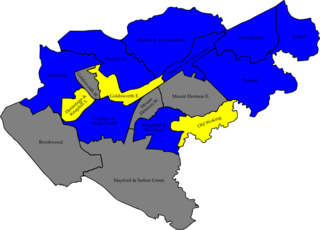
The 2007 Woking Council election took place on 3 May 2007 to elect members of Woking Borough Council in Surrey, England. One third of the council was up for election and the Conservative party gained overall control of the council from no overall control.

2007 Winchester City Council election

The 2007 Winchester Council election took place on 3 May 2007 to elect members of Winchester District Council in Hampshire, England. One third of the council was up for election and the Conservative party stayed in overall control of the council.

1994 United Kingdom local elections

Local elections were held in the United Kingdom in 1994. The results showed a continued decline for the governing Conservatives, with the third placed party, the Liberal Democrats, as the main beneficiaries.

2011 Norwich City Council election

The 2011 Norwich City Council election took place on 5 May 2011 to elect members of Norwich City Council in England. One third of seats were up for election. This was on the same day as other local elections and the nationwide referendum on the Alternative Vote.

The Broxbourne Council election, 1994 was held to elect council members of the Broxbourne Borough Council, the local government authority of the borough of Broxbourne, Hertfordshire, England.

2011 North Somerset Council election

The 2011 North Somerset Council election took place on 5 May 2011 to elect members of North Somerset Unitary Council in Somerset, England. The whole council was up for election and the Conservative Party stayed in overall control of the council.

2006 Carlisle City Council election

The 2006 Carlisle City Council election took place on 4 May 2006 to elect members of Carlisle District Council in Cumbria, England. One third of the council was up for election and the council stayed under no overall control.

2007 Carlisle City Council election

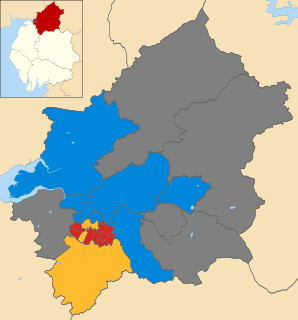
The 2007 Carlisle City Council election took place on 3 May 2007 to elect members of Carlisle District Council in Cumbria, England. One third of the council was up for election and the council stayed under no overall control.

2011 Carlisle City Council election

The 2011 Carlisle City Council election took place on 5 May 2011 to elect members of Carlisle District Council in Cumbria, England. One third of the council was up for election and the council stayed under no overall control.

2012 St Albans City and District Council election

The 2012 St Albans City and District Council election took place on 3 May 2012 to elect members of St Albans District Council in Hertfordshire, England. One third of the council was up for election and the council stayed under no overall control.

2013 United Kingdom local elections

The 2013 United Kingdom local elections took place on Thursday 2 May 2013. Elections were held in 35 English councils: all 27 non-metropolitan county councils and eight unitary authorities, and in one Welsh unitary authority. Direct mayoral elections took place in Doncaster and North Tyneside. These elections last took place on the 4 June 2009 at the same time as the 2009 European Parliament Elections, except for County Durham, Northumberland and the Anglesey where elections last took place in 2008.

2011 St Albans City and District Council election

The 2011 St Albans City and District Council election took place on 5 May 2011 to elect members of St Albans District Council in Hertfordshire, England. One third of the council was up for election and the Liberal Democrats lost overall control of the council to no overall control.

2014 St Albans City and District Council election

The 2014 St Albans City and District Council election took place on 22 May 2014 to elect members of St Albans District Council in Hertfordshire, England. One third of the council was up for election and the council stayed under no overall control.

2016 Bristol City Council election

The 2016 Bristol City Council election took place on Thursday 5 May 2016, alongside nationwide local elections. Following a boundary review, the number of wards in the City was reduced to 34, with each electing one, two or three Councillors. The overall number of Councillors remained 70, with all seats are up for election at the same time. Elections would then be held every 4 years.

1999 Bristol City Council election

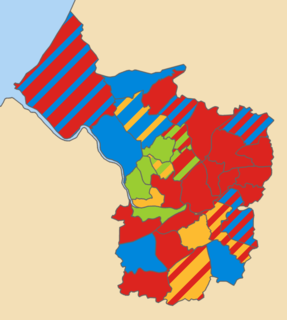
The 1999 Bristol City Council election took place on 6 May 1999, on the same day as other local elections. All seats were up for election due to boundary changes, with each ward electing 2 councillors. The total number of seats on the council increased by 2 due to the creation of a new ward: Clifton East.