Bristol City Council election, 1976

Last updated
Bristol City Council election, 1976
Flag of England.svg
  1973 6 May 1976 1979  

All 84 seats to Bristol City Council
43 seats needed for a majority

  First party Second party Third party
 
Party Labour Conservative Liberal
Seats won 47 34 3
Seat changeDecrease2.svg9Increase2.svg9Steady2.svg

Council control before election

Labour Party (UK)

Council control after election

Labour Party (UK)

1976 local election results in Bristol Bristol local election results 1976.png
1976 local election results in Bristol

The 1976 Bristol City Council election took place on 6 May 1976 to elect members of Bristol City Council in England. [1] This was on the same day as other local elections. Labour retained overall control of the council despite losing 9 seats to the Conservatives.

Bristol City Council local authority of Bristol, England

Bristol City Council is the local authority of Bristol, England. The council is a unitary authority, and is unusual in the United Kingdom in that its executive function is controlled by a directly elected mayor of Bristol. Bristol has 35 wards, electing a total of 70 councillors.

Contents

Ward results

Avon

Avon
PartyCandidateVotes%±
Labour V Pople 3,031
Labour A Crowley 2,911
Labour T Thomas 2,744
Conservative R Chubb 1,930
Conservative J Henley 1,632
Conservative V Bath 1,558
Communist D Pratt 315
Majority
Labour hold Swing {{{swing}}}

Bedminster

Bedminster
PartyCandidateVotes%±
Labour A Hillman 1,725
Labour J Wood 1,571
Labour W Jenkins 1,549
Conservative C Hagen 1,161
Conservative L Vann 1,113
Conservative V Goodland 1,107
Liberal R Turner 434
National Front R Bale 184
Majority
Labour hold Swing {{{swing}}}

Bishopston

Bishopston
PartyCandidateVotes%±
Conservative D Topham 2,214
Conservative T Clarke 2,100
Conservative M Withers 2,078
Labour E Boney 1,012
Labour M Shotter 982
Labour J Wood 961
Liberal K Tucker 684
Liberal J McMahon 656
Majority
Conservative hold Swing {{{swing}}}

Bishopsworth

Bishopsworth
PartyCandidateVotes%±
Labour L Smith 2,364
Labour A Munroe 2,180
Labour B B Richards 2,121
Conservative B D Richards 1,127
Conservative H Jones 976
Conservative P Paternoster 911
Liberal J Fletcher 475
Liberal P Ellis 429
Liberal P Bentley 394
National Front K Elliott 287
Majority
Labour hold Swing {{{swing}}}

Brislington

Brislington
PartyCandidateVotes%±
Labour K Legg 2,320
Labour R Flinn 2,238
Conservative O Patterson 2,234
Labour H Skeates 2,190
Conservative O Scantlebury 2,165
Conservative R Frankham 2,049
Majority
Labour hold Swing {{{swing}}}
Conservative gain from Labour Swing {{{swing}}}

Cabot

Cabot
PartyCandidateVotes%±
Liberal G Ferguson 1,353
Liberal W Watts-Miller 1,331
Liberal G Beedell 1,326
Conservative P Muir 1,134
Conservative B Weedall 1,092
Conservative J Yarwood 1,066
Labour P McLaren 750
Labour J King 737
Labour L Aldridge 705
Majority
Liberal hold Swing {{{swing}}}

Clifton

Clifton
PartyCandidateVotes%±
Conservative J Lloyd-Kirk 2,324
Conservative H Lawson 2,273
Conservative W Blackmore 2,242
Labour M Hodkinson 1,094
Labour G Micklewright 1,083
Labour M Thomas 1,033
Liberal S Mercer 990
Liberal E Dunning 973
Liberal M Perkins 972
Majority
Conservative hold Swing {{{swing}}}

District

District
PartyCandidateVotes%±
Conservative F Apperley 1,612
Conservative R Trench 1,601
Conservative J Bosdet 1,525
Labour K Bassett 1,223
Labour T Morgan 1,133
Labour M Wood 1,061
Liberal C Bolton 848
Liberal J Sansom 729
Liberal N Rigby 721
Majority
Conservative hold Swing {{{swing}}}

Durdham

Durdham
PartyCandidateVotes%±
Conservative G Palmer 4,061
Conservative M Veale 3,880
Conservative G Browne 3,869
Labour B Begley 962
Labour R Ritchie 884
Labour J Donovan 882
Majority
Conservative hold Swing {{{swing}}}

Easton

Easton
PartyCandidateVotes%±
Labour J Jones 1,358
Labour G Maggs 1,134
Labour R Morris 1,050
Conservative P Haines 495
Conservative J Gamlin 463
Conservative F Wookey 418
Communist N Carey 131
Majority
Labour hold Swing {{{swing}}}

Eastville

Eastville
PartyCandidateVotes%±
Labour W Williams 1,833
Labour E Fothergill 1,722
Labour B Ross 1,652
Conservative R Wookey 1,455
Conservative G Woodhouse 1,404
Conservative J Fletcher 1,280
Independent Liberal A Chalmers 512
Independent Liberal B Clarke 347
Independent Liberal J Hale 313
National Front J Bale 133
Majority
Labour hold Swing {{{swing}}}

Henbury

Henbury
PartyCandidateVotes%±
Labour J Fisk 3,350
Conservative W Stephens 3,339
Conservative D Barnwell 3,173
Conservative C Whitmore 3,167
Labour G Brass 2,764
Labour D Large 2,633
Liberal W Hurford 660
Liberal W Paver 634
Majority
Labour hold Swing {{{swing}}}
Conservative gain from Labour Swing {{{swing}}}

Hengrove

Hengrove
PartyCandidateVotes%±
Labour W Graves 2,396
Labour A Abrams 2,219
Labour M Houlihan 1,924
Conservative M Stamper 1,046
Conservative A Telling 1,046
Conservative G Bridcut 995
Liberal G Bentley 276
Liberal G Noel 206
Liberal V Noel 204
Majority
Labour hold Swing {{{swing}}}

Hillfields

Hillfields
PartyCandidateVotes%±
Labour C Draper 1,811
Labour G Robertson 1,806
Labour F Vyvyan-Jones 1,659
Conservative M Bessant 1,342
Conservative C Baker 1,289
Conservative A Thomas 1,172
National Front F Tanner 165
Majority
Labour hold Swing {{{swing}}}

Horfield

Horfield
PartyCandidateVotes%±
Labour C Merrett 2,245
Conservative B Topham 2,224
Labour R Edwards 2,175
Labour C Boney 2,056
Conservative P Cutcher 2,048
Conservative R Russell 2,030
Liberal P Hurford 596
Liberal R Moon 502
Liberal V Hales 483
National Front P Thomas 269
Majority
Labour hold Swing {{{swing}}}
Conservative gain from Labour Swing {{{swing}}}
Labour hold Swing {{{swing}}}

Knowle

Knowle
PartyCandidateVotes%±
Conservative G Sprackling 2,225
Conservative E Wright 2,051
Conservative F Lawrence 1,981
Labour C Gardner 1,102
National Front R Dowler 370
Majority
Conservative hold Swing {{{swing}}}

Redland

Redland
PartyCandidateVotes%±
Conservative G Hebblethwaite 1,929
Conservative C Hebblethwaite 1,904
Conservative G Keeley 1,879
Liberal R Kirkham 1,074
Liberal W Legg 973
Liberal W Tasker 972
Labour A May 683
Labour M Mason 671
Labour M Reiner 664
Majority
Conservative hold Swing {{{swing}}}

Somerset

Somerset
PartyCandidateVotes%±
Labour H Willcox 1,617
Labour D Jackson 1,485
Labour J Comerford 1,413
Conservative D Stevens 1,017
Conservative S Walker 962
Conservative H Little 921
National Front J Dowler 189
Liberal J Fletcher 178
Liberal I Adams 138
Liberal A Adams 129
Majority
Labour hold Swing {{{swing}}}

Southmead

Southmead
PartyCandidateVotes%±
Conservative F McGough 3,047
Conservative P Sidebottom 2,748
Conservative N Mearing-Smith 2,686
Labour J Hole 2,523
Labour R Bridle 2,306
Labour A Keefe 2,229
Majority
Conservative gain from Labour Swing {{{swing}}}
Conservative hold Swing {{{swing}}}
Conservative gain from Labour Swing {{{swing}}}

Southville

Southville
PartyCandidateVotes%±
Labour H Harding 1,302
Labour M Young 1,247
Labour F Pidgeon 1,245
Conservative C Taylor 1,226
Conservative C Fox 1,116
Conservative M Jones 1,104
Liberal N Harrisson 181
Liberal E Ellis 153
Liberal A Havvock 142
Majority
Labour hold Swing {{{swing}}}

St George East

St George East
PartyCandidateVotes%±
Labour L Rexworthy 2,226
Labour H Bloom 2,222
Labour D Beer 2,188
Conservative K Mountstephen 2,076
Conservative R King 1,902
Conservative C Woods 1,817
Majority
Labour hold Swing {{{swing}}}

St George West

St George West
PartyCandidateVotes%±
Labour M Rea 1,437
Labour J McLaren 1,417
Labour I Rogers 1,399
Conservative C Avery 1,108
Conservative M Gardner 956
Conservative B Irwin 881
National Front R Pearce 337
Majority
Labour hold Swing {{{swing}}}

St Paul

St Paul
PartyCandidateVotes%±
Labour D McLaren 1,157
Labour G Fowler 1,047
Labour P Korovilas 1,012
Conservative E Macdonald 596
Conservative K Rogers 526
Conservative J Seville 483
Majority
Labour hold Swing {{{swing}}}

St Philip & Jacob

St Philip & Jacob
PartyCandidateVotes%±
Labour I Knight 820
Labour J Britton 750
Labour D Tedder 741
Conservative G Edwards 378
Conservative S Watton 351
Conservative H Edwards 344
Majority
Labour hold Swing {{{swing}}}

Stapleton

Stapleton
PartyCandidateVotes%±
Conservative T Whiteley 3,075
Conservative P Brook 3,055
Conservative H Williams 3,000
Labour C Gingell 1,847
Labour M McGrath 1,847
Labour B Payton 1,772
Majority
Conservative hold Swing {{{swing}}}

Stockwood

Stockwood
PartyCandidateVotes%±
Conservative E Wilsdon 3,748
Conservative B Love 3,582
Conservative S Williams 3,444
Labour G Easton 2,948
Labour V Bath 2,750
Labour B Barker 2,706
Liberal H Bryant 784
Liberal J Edwards 654
Liberal M Langley 652
Majority
Conservative gain from Labour Swing {{{swing}}}

Westbury-on-Trym

Westbury-on-Trym
PartyCandidateVotes%±
Conservative D Poole 6,371
Conservative R Wall 6,316
Conservative C Alderson 6,201
Liberal L Edgell 1,063
Liberal G Davis 1,016
Labour J McLaren 965
Liberal M Hamilton 918
Labour D Evans 917
Labour S Andrews 854
Majority
Conservative hold Swing {{{swing}}}

Windmill Hill

Windmill Hill
PartyCandidateVotes%±
Labour C Reid 1,086
Labour D Poole 1,039
Labour G Bee 1,008
Conservative E Cockrell 592
Conservative S Simmons 565
Conservative W Wardle 544
Liberal R Hopkins 280
Liberal E Mottart 278
Liberal C Slater 248
National Front R Jacklin 178
Majority
Labour hold Swing {{{swing}}}

Related Research Articles

Bristol City Council elections

Bristol is a unitary authority and ceremonial county in England. Until 1 April 1996 it was a non-metropolitan district in Avon. Since 2012 it has also had a directly elected mayor.

Politics of Bristol

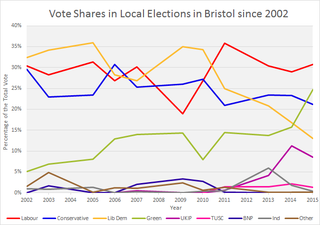
The city of Bristol, England, is a unitary authority, represented by four MPs representing seats wholly within the city boundaries. As well as these, Filton and Bradley Stoke covers the northern urban fringe in South Gloucestershire and the north eastern urban fringe is in the Kingswood constituency. The overall trend of both local and national representation became left of centre, favouring the Labour Party and Liberal Democrats during the latter 20th century, but there was a shift to the right in the 2010 general election. The city has a tradition of local activism, with environmental issues and sustainable transport being prominent issues in the city.

1986 Bristol City Council election

The 1986 Bristol City Council election took place on 8 May 1986 to elect members of Bristol City Council in England. This was on the same day as other local elections. One third of seats in the 1986 Council Elections in the English city of Bristol were up for election. The election in Brislington West was a by-election. There was a small swing away from the Conservatives and Labour regained a majority on the Council, which they kept until 2003.

1994 Bristol City Council election

The 1994 Bristol City Council election took place on 5 May 1994 to elect members of Bristol City Council in England. This was on the same day as other local elections. One third of seats were up for election. The Bristol Party was formed by Bristol Rovers fans to campaign for a new stadium for the club. There was a general swing from the Conservatives and Greens to the Liberal Democrats, reflecting the beginning of the Conservative decline nationally and also the Liberal Democrat recovery after the merger troubles.

2009 Bristol City Council election

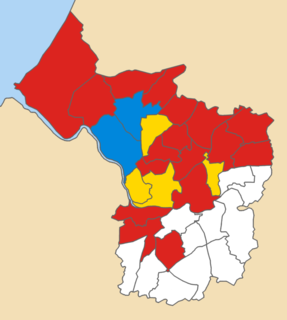
The 2009 Bristol City Council elections were held on Thursday 4 June 2009, for 23 seats, that being one-third of the total number of councilors. The Liberal Democrats who had been leading a minority administration, won an overall majority of the council, the first time the party had achieved this on Bristol City Council. The Liberal Democrats were defending 11 seats, the Labour Party 10 and the Conservatives 2.

2011 Bristol City Council election

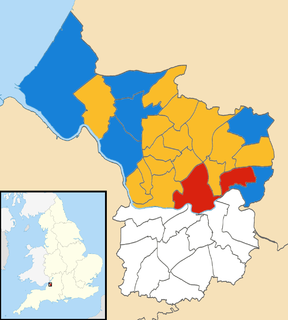
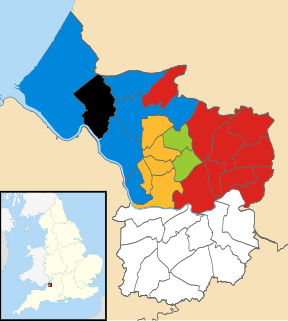
The 2011 Bristol City Council elections were held on Thursday 5 May 2011, for 24 seats, that being one third of the total number of councillors. The Liberal Democrats, who had won overall control of the council in 2009 and increased their majority in 2010, experienced a drop in support and lost 5 seats; 4 to the Labour Party and 1 to the Green Party, which gained its second ever council seat in Bristol. This meant that the Lib Dems no longer had a majority on the council. However, they continued to run the council, relying on opposition groups to vote through any proposal.

Mayor of Bristol

The Mayor of Bristol is the head of Bristol City Council. The Mayor is an elected politician who, along with the 70 members of Bristol City Council, is responsible for the strategic government of the city of Bristol, England. The role was created after a local referendum held on 3 May 2012, which followed the passage of the Localism Act 2011. 41,032 voted for an elected mayor and 35,880 voted against, with a turnout of 24%. An election for the new post was held on 15 November 2012.

2013 Bristol City Council election

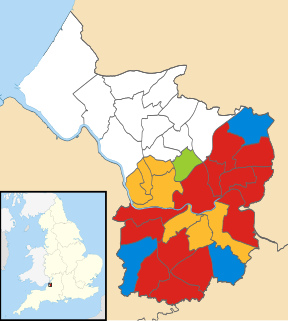
Elections for one third of Bristol City Council were held on 2 May 2013 as part of the United Kingdom local elections, 2013. No party gained overall control.

2014 Bristol City Council election

The 2014 Bristol City Council election took place on 22 May 2014 to elect members of Bristol City Council in England, as part of the United Kingdom 2014 Local Elections.

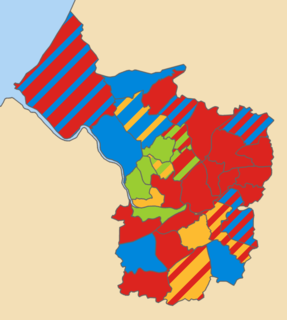
The 2015 Bristol City Council election took place on 7 May 2015 to elect members of Bristol City Council in England. This was on the same day as other local elections.

2016 Bristol City Council election

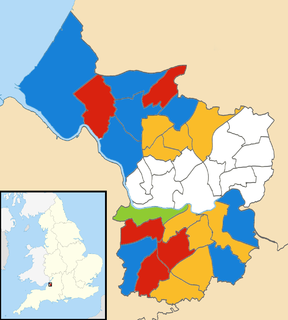
The 2016 Bristol City Council election took place on Thursday 5 May 2016, alongside nationwide local elections. Following a boundary review, the number of wards in the City was reduced to 34, with each electing one, two or three Councillors. The overall number of Councillors remained 70, with all seats are up for election at the same time. Elections would then be held every 4 years.

1973 Bristol City Council election

The 1973 Bristol City Council election took place on 7 June 1973 to elect members of Bristol City Council in England. This was on the same day as other local elections. Voting took place across 28 wards, each electing 3 Councillors. Following the Local Government Act 1972, this was the first election to the new non-metropolitan district council for Bristol, which came into being on 1 April the following year. Labour took control of the Council after winning a comfortable majority of seats.

1979 Bristol City Council election

The 1979 Bristol City Council election took place on 3 May 1979 to elect members of Bristol City Council in England. This was on the same day as other local elections and the 1979 general election. In contrast to the Conservative landslide in the national election, the Conservatives in Bristol lost 6 seats to Labour, who maintained overall control of the council.

1999 Bristol City Council election

The 1999 Bristol City Council election took place on 6 May 1999, on the same day as other local elections. All seats were up for election due to boundary changes, with each ward electing 2 councillors. The total number of seats on the council increased by 2 due to the creation of a new ward: Clifton East.

2001 Bristol City Council election

The 2001 Bristol City Council election took place on 7 June 2001, on the same day as other local elections. The Labour Party made a small number of gains and maintained overall control of the council.

2002 Bristol City Council election

The 2002 Bristol City Council election took place on 2 May 2002, on the same day as other local elections. Despite suffering some losses, the Labour Party managed to retain a slim majority.

2003 Bristol City Council election

The 2003 Bristol City Council election took place on 1 May 2003, on the same day as other local elections in the UK. The Labour Party made a number of losses, mainly to the Liberal Democrats, and lost overall control of the council. Loses included Council leader Diane Bunyan, who lost her Windmill Hill seat to the Liberal Democrats. This year also saw elections contested by the new Bristolian Party, founded by the local 'scandal sheet' The Bristolian, though they failed to win any seats.

2006 Bristol City Council election

The 2006 Bristol City Council election took place on 4 May 2006, on the same day as other local elections. The Labour Party continued to lose seats, but the Liberal Democrats failed to gain enough to form an overall majority. This election saw the first election of a Green Councillor to Bristol City Council – the first time four parties had been represented since the Council’s creation.

2007 Bristol City Council election

The 2007 Bristol City Council election took place on 3 May 2007, on the same day as other local elections. The Liberal Democrats lost 2 seats to Labour, but remained the largest party on the Council. No party gained overall control.

References

  1. "Local Elections Handbook 1976". The Elections Centre. Retrieved 2016-04-10.