| |||||||||||||||||
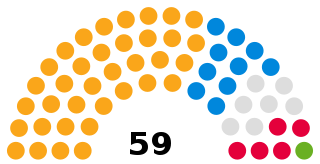
All 76 seats to Avon County Council 39 seats needed for a majority | |||||||||||||||||
| |||||||||||||||||
|
The 1993 Avon County Council election took place on 6 May 1993 to elect members of Avon County Council in England. This was on the same day as other nationwide local elections. The Liberal Democrats made a number of gains, mainly at the expense of the Conservatives. Labour remained the largest group on the council, but were 6 seats short of gaining a majority. [1]
Avon County Council was the county council of the non-metropolitan county of Avon in south west England. It came into its powers on 1 April 1974 and was abolished on 1 April 1996 at the same time as the county. The county council was based in Bristol at Avon House and Avon House North. It was replaced with four authorities: Bristol City Council, South Gloucestershire Council, North Somerset Council and Bath and North East Somerset Council.
This was the last election for Avon County, which was abolished in 1996 and replaced with four new unitary authorities: Bath and North East Somerset, Bristol, North Somerset and South Gloucestershire.
Avon was a non-metropolitan and ceremonial county in the west of England that existed between 1974 and 1996. The county was named after the River Avon, which flows through the area. It was formed from the county boroughs of Bristol and Bath, together with parts of the administrative counties of Gloucestershire and Somerset.
Bath and North East Somerset is the district of the unitary authority of Bath and North East Somerset Council that was created on 1 April 1996 following the abolition of the county of Avon. It is part of the ceremonial county of Somerset.
Bristol is a city and county in South West England with a population of 459,300. The wider district has the 10th-largest population in England. The urban area population of 724,000 is the 8th-largest in the UK. The city borders North Somerset and South Gloucestershire, with the cities of Bath and Gloucester to the south-east and north-east, respectively. South Wales lies across the Severn estuary.
Party | Candidate | Votes | % | ± | |
---|---|---|---|---|---|
Labour | D John | 1,416 | 56.5 | ||
Liberal Democrat | A Wilkinson | 376 | 15.0 | ||
Green | D Simpson | 360 | 14.4 | ||
Conservative | J Eastwood | 356 | 14.2 | ||
Majority | |||||
Labour hold | Swing |
Party | Candidate | Votes | % | ± | |
---|---|---|---|---|---|
Labour | E Bristow | 2,120 | 61.6 | ||
Conservative | N Tolchard | 955 | 27.8 | ||
Liberal Democrat | P Lloyd | 366 | 10.6 | ||
Majority | |||||
Labour hold | Swing |
Party | Candidate | Votes | % | ± | |
---|---|---|---|---|---|
Conservative | M Wheadon | 1,273 | 40.6 | ||
Liberal Democrat | K Keenan | 1,205 | 38.4 | ||
Labour | M Davis | 516 | 16.5 | ||
Green | J Risbridger | 140 | 4.5 | ||
Majority | |||||
Conservative hold | Swing |
Party | Candidate | Votes | % | ± | |
---|---|---|---|---|---|
Conservative | L Price | 1,275 | 36.9 | ||
Liberal Democrat | K Lunt | 1,213 | 35.1 | ||
Labour | B Barrett | 810 | 23.5 | ||
Green | J Rust | 155 | 4.5 | ||
Majority | |||||
Conservative hold | Swing |
Party | Candidate | Votes | % | ± | |
---|---|---|---|---|---|
Liberal Democrat | R Allan | 2,256 | 47.4 | ||
Conservative | I Dewey | 1,971 | 41.4 | ||
Labour | P Sas | 362 | 362 | ||
Green | S Bradley | 169 | 3.6 | ||
Majority | |||||
Liberal Democrat gain from Conservative | Swing | ||||
Party | Candidate | Votes | % | ± | |
---|---|---|---|---|---|
Liberal Democrat | J Willetts | 1,992 | 49.2 | ||
Conservative | M Adams | 1,648 | 40.7 | ||
Labour | M Dodsworth | 405 | 10.0 | ||
Majority | |||||
Liberal Democrat gain from Conservative | Swing | ||||
Party | Candidate | Votes | % | ± | |
---|---|---|---|---|---|
Conservative | B Pascoe | 1,436 | 45.4 | ||
Liberal Democrat | B Bodle | 1,415 | 44.7 | ||
Labour | J Campbell | 315 | 9.9 | ||
Majority | |||||
Conservative hold | Swing |
Party | Candidate | Votes | % | ± | |
---|---|---|---|---|---|
Liberal Democrat | S Hogg | 1,856 | 42.0 | ||
Labour | D Nicoll | 1,662 | 37.6 | ||
Conservative | K Day | 866 | 19.6 | ||
Independent | N Hales | 40 | 0.9 | ||
Majority | |||||
Liberal Democrat gain from Labour | Swing | ||||
Party | Candidate | Votes | % | ± | |
---|---|---|---|---|---|
Liberal Democrat | T Ball | 2,568 | 59.9 | ||
Labour | S Lydiard | 1,273 | 29.7 | ||
Conservative | V Oliver | 372 | 8.7 | ||
Green | S Walker | 72 | 1.7 | ||
Majority | |||||
Liberal Democrat gain from Labour | Swing | ||||
Party | Candidate | Votes | % | ± | |
---|---|---|---|---|---|
Conservative | E Miles | 1,432 | 43.4 | ||
Liberal Democrat | G Buckley | 1,396 | 42.3 | ||
Labour | H Strong | 469 | 14.2 | ||
Majority | |||||
Conservative hold | Swing |
Party | Candidate | Votes | % | ± | |
---|---|---|---|---|---|
Labour | S Hodkinson | 1,754 | 60.2 | ||
Liberal Democrat | R Hughes | 669 | 22.9 | ||
Conservative | J Lopresti | 390 | 13.4 | ||
Green | A Lewis | 103 | 3.5 | ||
Majority | |||||
Labour hold | Swing |
Party | Candidate | Votes | % | ± | |
---|---|---|---|---|---|
Labour | A Keefe | 1,844 | 46.6 | ||
Liberal Democrat | C Primmett | 935 | 23.6 | ||
Conservative | W Brown | 886 | 22.4 | ||
Independent | P Miller | 147 | 3.7 | ||
Green | J Quinnell | 146 | 3.7 | ||
Majority | |||||
Labour hold | Swing |
Party | Candidate | Votes | % | ± | |
---|---|---|---|---|---|
Labour | P Dunmore | 1,656 | 52.5 | ||
Conservative | M Jarrett | 1,114 | 35.3 | ||
Liberal Democrat | M Sykes | 295 | 9.4 | ||
Green | B Lewis | 89 | 2.8 | ||
Majority | |||||
Labour hold | Swing |
Party | Candidate | Votes | % | ± | |
---|---|---|---|---|---|
Liberal Democrat | C Downie | 2,656 | 51.6 | ||
Conservative | P Formela-Osborne | 1,554 | 30.2 | ||
Labour | A Coales | 939 | 18.2 | ||
Majority | |||||
Liberal Democrat hold | Swing |
Party | Candidate | Votes | % | ± | |
---|---|---|---|---|---|
Labour | W Martin | 1,967 | 52.8 | ||
Conservative | C Bretherton | 1,228 | 32.9 | ||
Liberal Democrat | J Freeman | 440 | 11.8 | ||
Green | D Eadon | 92 | 2.5 | ||
Majority | |||||
Labour hold | Swing |
Party | Candidate | Votes | % | ± | |
---|---|---|---|---|---|
Liberal Democrat | B Clarke | 1,244 | 35.6 | ||
Labour | D Norris | 1,210 | 34.7 | ||
Conservative | I Millard | 911 | 26.1 | ||
Green | P Braithwaite | 127 | 3.6 | ||
Majority | |||||
Liberal Democrat hold | Swing |
Party | Candidate | Votes | % | ± | |
---|---|---|---|---|---|
Liberal Democrat | S Williams | 1,450 | 46.7 | ||
Labour | L Akehurst | 938 | 30.2 | ||
Conservative | A Field-Thorne | 560 | 18.0 | ||
Green | A Clarke | 158 | 5.1 | ||
Majority | |||||
Liberal Democrat hold | Swing |
Party | Candidate | Votes | % | ± | |
---|---|---|---|---|---|
Conservative | A Telling | 2,410 | 56.5 | ||
Labour | J Carter | 1,276 | 29.9 | ||
Green | S Scott | 577 | 13.5 | ||
Majority | |||||
Conservative hold | Swing |
Party | Candidate | Votes | % | ± | |
---|---|---|---|---|---|
Conservative | G Morris | 1,482 | 36.8 | ||
Independent | D Shopland | 1,221 | 30.3 | ||
Liberal Democrat | B Chislett | 865 | 21.5 | ||
Labour | B Cooper | 460 | 11.4 | ||
Majority | |||||
Conservative hold | Swing |
Party | Candidate | Votes | % | ± | |
---|---|---|---|---|---|
Conservative | M Withers | 1,434 | 42.0 | ||
Liberal Democrat | B Price | 1,270 | 37.2 | ||
Labour | N Steven | 545 | 16.0 | ||
Green | N Campion | 165 | 4.8 | ||
Majority | |||||
Conservative hold | Swing |
Party | Candidate | Votes | % | ± | |
---|---|---|---|---|---|
Conservative | P Cobbold | 1,202 | 35.9 | ||
Labour | J Wakeham | 1,193 | 35.6 | ||
Liberal Democrat | M Bosel | 786 | 23.5 | ||
Green | G Collard | 170 | 5.1 | ||
Majority | |||||
Conservative hold | Swing |
Party | Candidate | Votes | % | ± | |
---|---|---|---|---|---|
Labour | G King | 2,392 | 55.4 | ||
Conservative | G Wells | 1,386 | 32.1 | ||
Liberal Democrat | E Verso | 537 | 12.4 | ||
Majority | |||||
Labour hold | Swing |
Party | Candidate | Votes | % | ± | |
---|---|---|---|---|---|
Liberal Democrat | M Smith | 1,685 | 52.7 | ||
Labour | J Nicholson | 1,305 | 40.8 | ||
Conservative | I Vickery | 207 | 6.5 | ||
Majority | |||||
Liberal Democrat gain from Labour | Swing | ||||
Party | Candidate | Votes | % | ± | |
---|---|---|---|---|---|
Labour | S Lanchbury | 1,524 | 45.7 | ||
Conservative | S Vickery | 1,293 | 38.7 | ||
Liberal Democrat | G Williams | 411 | 12.3 | ||
Green | S Jeffrey | 109 | 3.3 | ||
Majority | |||||
Labour hold | Swing |
Party | Candidate | Votes | % | ± | |
---|---|---|---|---|---|
Labour | E Tayler | 2,213 | 51.1 | ||
Conservative | A Castle | 1,483 | 34.2 | ||
Liberal Democrat | S Young | 634 | 14.6 | ||
Majority | |||||
Labour hold | Swing |
Party | Candidate | Votes | % | ± | |
---|---|---|---|---|---|
Labour | S Grant | 1,087 | 74.7 | ||
Conservative | C Simpson | 166 | 11.4 | ||
Liberal Democrat | J Knight | 152 | 10.4 | ||
Green | J Edmunds | 152 | 3.5 | ||
Majority | |||||
Labour hold | Swing |
Party | Candidate | Votes | % | ± | |
---|---|---|---|---|---|
Labour | A Becker | 2,198 | 53.1 | ||
Conservative | V Eaglestone | 1,415 | 34.2 | ||
Liberal Democrat | R Windmill | 528 | 12.8 | ||
Majority | |||||
Labour hold | Swing |
Party | Candidate | Votes | % | ± | |
---|---|---|---|---|---|
Conservative | P Burden | 1,863 | 48.0 | ||
Labour | J Clark | 1412 | 36.4 | ||
Liberal Democrat | J Morgan | 608 | 15.7 | ||
Majority | |||||
Conservative hold | Swing |
Party | Candidate | Votes | % | ± | |
---|---|---|---|---|---|
Labour | B Chalmers | 1,412 | 59.4 | ||
Conservative | D Robinson | 561 | 23.6 | ||
Liberal Democrat | J Grant | 332 | 14.0 | ||
Green | C Bolton | 73 | 3.1 | ||
Majority | |||||
Labour hold | Swing |
Party | Candidate | Votes | % | ± | |
---|---|---|---|---|---|
Labour | R Pyle | 1,872 | 52.7 | ||
Conservative | A Low | 1,233 | 34.7 | ||
Liberal Democrat | J Taylor | 447 | 12.6 | ||
Majority | |||||
Labour hold | Swing |
Party | Candidate | Votes | % | ± | |
---|---|---|---|---|---|
Liberal Democrat | J Webb | 2,508 | 59.1 | ||
Conservative | S Willis | 938 | 22.1 | ||
Labour | R Lomas | 740 | 17.4 | ||
Green | G Davey | 56 | 1.3 | ||
Majority | |||||
Liberal Democrat hold | Swing |
Party | Candidate | Votes | % | ± | |
---|---|---|---|---|---|
Conservative | J Portch | 2,021 | 49.1 | ||
Liberal Democrat | R Brown | 1,436 | 34.9 | ||
Labour | K Evans | 482 | 11.7 | ||
Green | D Wall | 154 | 3.7 | ||
Independent | S Carter | 20 | 0.5 | ||
Majority | |||||
Conservative hold | Swing |
Party | Candidate | Votes | % | ± | |
---|---|---|---|---|---|
Labour | J Marshall | 1,618 | 60.0 | ||
Conservative | J Wilkins | 621 | 23.0 | ||
Liberal Democrat | S Hender | 459 | 17.0 | ||
Majority | |||||
Labour hold | Swing |
Party | Candidate | Votes | % | ± | |
---|---|---|---|---|---|
Conservative | J Reed | 1,509 | 43.9 | ||
Labour | M Richardson | 1,426 | 41.5 | ||
Liberal Democrat | R Hollyman | 483 | 14.1 | ||
Green | P Scott | 18 | 0.5 | ||
Majority | |||||
Conservative hold | Swing |
Party | Candidate | Votes | % | ± | |
---|---|---|---|---|---|
Conservative | K Nicholls | 2,178 | 57.0 | ||
Liberal Democrat | G Roberts | 1,200 | 31.4 | ||
Labour | A Buckle | 446 | 11.7 | ||
Majority | |||||
Conservative hold | Swing |
Party | Candidate | Votes | % | ± | |
---|---|---|---|---|---|
Labour | J Lingard | 2,014 | 47.0 | ||
Conservative | R Abram | 1,377 | 32.1 | ||
Liberal Democrat | A Crouch | 898 | 20.9 | ||
Majority | |||||
Labour hold | Swing |
Party | Candidate | Votes | % | ± | |
---|---|---|---|---|---|
Labour | T Walker | 1,979 | 66.5 | ||
Conservative | F Birch | 610 | 20.5 | ||
Liberal Democrat | P Barrow | 388 | 13.0 | ||
Majority | |||||
Labour hold | Swing |
Party | Candidate | Votes | % | ± | |
---|---|---|---|---|---|
Labour | K Walker | 1,848 | 57.2 | ||
Conservative | J Veale | 984 | 30.5 | ||
Liberal Democrat | F Young | 397 | 12.3 | ||
Majority | |||||
Labour hold | Swing |
Party | Candidate | Votes | % | ± | |
---|---|---|---|---|---|
Labour | V Davey | 1,629 | 61.2 | ||
Conservative | T Skipp | 667 | 25.1 | ||
Liberal Democrat | D Gammon | 200 | 7.5 | ||
Green | J Barraclough | 164 | 6.2 | ||
Majority | |||||
Labour hold | Swing |
Party | Candidate | Votes | % | ± | |
---|---|---|---|---|---|
Liberal Democrat | P Hockey | 2,471 | 51.9 | ||
Conservative | D Moss | 1,624 | 34.1 | ||
Labour | R Millard | 510 | 10.7 | ||
Green | B Iles | 159 | 3.3 | ||
Majority | |||||
Liberal Democrat hold | Swing |
Party | Candidate | Votes | % | ± | |
---|---|---|---|---|---|
Labour | T Turvey | 1,793 | 70.2 | ||
Conservative | H Richmond | 344 | 13.5 | ||
Liberal Democrat | A Geoghegan | 326 | 12.8 | ||
Independent | J Lamb | 92 | 3.6 | ||
Majority | |||||
Labour hold | Swing |
Party | Candidate | Votes | % | ± | |
---|---|---|---|---|---|
Labour | P Boston | 1,550 | 59.0 | ||
Liberal Democrat | J Grace | 582 | 22.2 | ||
Conservative | A Smith | 464 | 17.7 | ||
Green | J Duggan | 30 | 1.1 | ||
Majority | |||||
Labour hold | Swing |
Party | Candidate | Votes | % | ± | |
---|---|---|---|---|---|
Conservative | J Calway | 2,150 | 44.3 | ||
Labour | D Shannon | 1,472 | 30.3 | ||
Liberal Democrat | A Greenfield | 1,231 | 25.4 | ||
Majority | |||||
Conservative hold | Swing |
Party | Candidate | Votes | % | ± | |
---|---|---|---|---|---|
Labour | B Perry | 2,190 | 51.8 | ||
Conservative | S Steel | 1,027 | 24.3 | ||
Liberal Democrat | R Inchley | 878 | 20.8 | ||
Green | K Butler | 131 | 3.1 | ||
Majority | |||||
Labour hold | Swing |
Party | Candidate | Votes | % | ± | |
---|---|---|---|---|---|
Labour | S Hunt | 2,681 | 55.6 | ||
Conservative | P Britton | 1,188 | 24.6 | ||
Liberal Democrat | M Hilborne | 957 | 19.8 | ||
Majority | |||||
Labour hold | Swing |
Party | Candidate | Votes | % | ± | |
---|---|---|---|---|---|
Conservative | A Barber | 1,927 | 39.9 | ||
Liberal Democrat | R Steadman | 1,714 | 35.4 | ||
Independent | N Baker | 670 | 13.9 | ||
Labour | D Mossman | 524 | 10.8 | ||
Majority | |||||
Labour hold | Swing |
Party | Candidate | Votes | % | ± | |
---|---|---|---|---|---|
Labour | M Harding | 1,550 | 53.4 | ||
Liberal Democrat | M Rossall | 694 | 23.9 | ||
Conservative | L Jackson | 681 | 20.0 | ||
Green | D Garrett | 77 | 2.7 | ||
Majority | |||||
Labour hold | Swing |
Party | Candidate | Votes | % | ± | |
---|---|---|---|---|---|
Liberal Democrat | G Crump | 2,121 | 50.3 | ||
Conservative | J Walters | 1,595 | 37.8 | ||
Labour | H Davies | 501 | 11.9 | ||
Majority | |||||
Liberal Democrat gain from Conservative | Swing | ||||
Party | Candidate | Votes | % | ± | |
---|---|---|---|---|---|
Liberal Democrat | P Heath | 1,419 | 45.8 | ||
Conservative | J Wyatt | 1,237 | 39.9 | ||
Labour | J Ackroyd | 444 | 14.3 | ||
Majority | |||||
Liberal Democrat gain from Conservative | Swing | ||||
Party | Candidate | Votes | % | ± | |
---|---|---|---|---|---|
Labour | C Dando | 2,473 | 55.3 | ||
Conservative | S Green | 944 | 21.1 | ||
Liberal Democrat | B Wilson | 895 | 20.0 | ||
Green | M Boulton | 160 | 3.6 | ||
Majority | |||||
Labour hold | Swing |
Party | Candidate | Votes | % | ± | |
---|---|---|---|---|---|
Labour | J Ashton | 1,478 | 36.8 | ||
Conservative | A Waycott | 1,334 | 33.3 | ||
Liberal Democrat | S Emmett | 1,055 | 26.3 | ||
Green | N Whittingham | 145 | 3.6 | ||
Majority | |||||
Labour gain from Conservative | Swing | ||||
Party | Candidate | Votes | % | ± | |
---|---|---|---|---|---|
Labour | M Bamford | 1,886 | 52.8 | ||
Conservative | R Long | 1,148 | 32.1 | ||
Liberal Democrat | D Verso | 541 | 15.1 | ||
Majority | |||||
Labour hold | Swing |
Party | Candidate | Votes | % | ± | |
---|---|---|---|---|---|
Conservative | W Fowler | 1,953 | 43.0 | ||
Liberal Democrat | P Tyzack | 1,851 | 40.7 | ||
Labour | M Twyman | 562 | 12.4 | ||
Green | J Greene | 179 | 3.9 | ||
Majority | |||||
Conservative hold | Swing |
Party | Candidate | Votes | % | ± | |
---|---|---|---|---|---|
Conservative | N Hudson | 2,056 | 48.4 | ||
Labour | M McGrath | 1,206 | 28.4 | ||
Liberal Democrat | J Parker | 985 | 23.2 | ||
Majority | |||||
Conservative hold | Swing |
Party | Candidate | Votes | % | ± | |
---|---|---|---|---|---|
Liberal Democrat | J Larkins | 2,456 | 50.3 | ||
Conservative | L Spiller | 1,940 | 39.8 | ||
Labour | B Granger | 483 | 9.9 | ||
Majority | |||||
Liberal Democrat gain from Conservative | Swing | ||||
Party | Candidate | Votes | % | ± | |
---|---|---|---|---|---|
Labour | J Smith | 1,631 | 63.3 | ||
Conservative | B Jocelyn | 626 | 24.3 | ||
Liberal Democrat | A West | 321 | 12.5 | ||
Majority | |||||
Labour hold | Swing |
Party | Candidate | Votes | % | ± | |
---|---|---|---|---|---|
Labour | D Johnson | 1,670 | 56.0 | ||
Conservative | C Stephenson | 724 | 24.3 | ||
Liberal Democrat | P Case | 415 | 13.9 | ||
Green | R Martin | 131 | 4.4 | ||
Independent | E Booth-Clibborn | 41 | 1.4 | ||
Majority | |||||
Labour hold | Swing |
Party | Candidate | Votes | % | ± | |
---|---|---|---|---|---|
Labour | J Norris | 1,498 | 53.3 | ||
Conservative | J Bramford | 828 | 29.4 | ||
Liberal Democrat | G Draper | 486 | 17.3 | ||
Majority | |||||
Labour hold | Swing |
Party | Candidate | Votes | % | ± | |
---|---|---|---|---|---|
Labour | R Stone | 1,910 | 62.3 | ||
Liberal Democrat | K Peacock | 747 | 24.4 | ||
Conservative | M Stump | 409 | 13.3 | ||
Majority | |||||
Labour hold | Swing |
Party | Candidate | Votes | % | ± | |
---|---|---|---|---|---|
Conservative | D Morris | 1,984 | 45.8 | ||
Labour | L Carruthers | 1,685 | 38.9 | ||
Liberal Democrat | J Collins | 566 | 13.1 | ||
Green | C Presley | 95 | 2.2 | ||
Majority | |||||
Conservative gain from Labour | Swing | ||||
Party | Candidate | Votes | % | ± | |
---|---|---|---|---|---|
Conservative | G Keeley | 2,086 | 56.1 | ||
Liberal Democrat | E Carpenter | 1,067 | 28.7 | ||
Labour | N Barton | 480 | 12.9 | ||
Green | L Hersey | 85 | 2.3 | ||
Majority | |||||
Conservative hold | Swing |
Party | Candidate | Votes | % | ± | |
---|---|---|---|---|---|
Conservative | H Roberts | 2,167 | 55.1 | ||
Liberal Democrat | A Nelson | 1,210 | 30.8 | ||
Labour | A Rutherford | 555 | 14.1 | ||
Majority | |||||
Conservative hold | Swing |
Party | Candidate | Votes | % | ± | |
---|---|---|---|---|---|
Liberal Democrat | D Pearce | 2,157 | 45.2 | ||
Conservative | R Gillett | 1,978 | 41.5 | ||
Labour | M Harris | 437 | 9.2 | ||
Green | A Pinder | 198 | 4.2 | ||
Majority | |||||
Liberal Democrat hold | Swing |
Party | Candidate | Votes | % | ± | |
---|---|---|---|---|---|
Conservative | J Gillard | 2,506 | 63.5 | ||
Liberal Democrat | C Stratton | 894 | 22.7 | ||
Labour | B Massey | 547 | 13.9 | ||
Majority | |||||
Conservative hold | Swing |
Party | Candidate | Votes | % | ± | |
---|---|---|---|---|---|
Conservative | P Taylor | 1,281 | 36.7 | ||
Liberal Democrat | J Bell | 1,134 | 32.5 | ||
Labour | B Jennings | 1,072 | 30.7 | ||
Majority | |||||
Conservative hold | Swing |
Party | Candidate | Votes | % | ± | |
---|---|---|---|---|---|
Conservative | D Greenland | 1,414 | 42.7 | ||
Liberal Democrat | R Martin | 1,273 | 38.5 | ||
Labour | R Tucker | 623 | 18.8 | ||
Majority | |||||
Conservative hold | Swing |
Party | Candidate | Votes | % | ± | |
---|---|---|---|---|---|
Labour | A Hughes | 1,425 | 46.4 | ||
Liberal Democrat | J Laband | 1,165 | 37.9 | ||
Conservative | J Dixon | 484 | 15.7 | ||
Majority | |||||
Labour hold | Swing |
Party | Candidate | Votes | % | ± | |
---|---|---|---|---|---|
Conservative | M Roe | 1,580 | 47.5 | ||
Liberal Democrat | N Sycamore | 1,200 | 36.1 | ||
Labour | G Board | 544 | 16.4 | ||
Majority | |||||
Conservative hold | Swing |
Party | Candidate | Votes | % | ± | |
---|---|---|---|---|---|
Labour | D Herod | 1,320 | 65.1 | ||
Conservative | T Jervis | 353 | 17.4 | ||
Liberal Democrat | G Jones | 275 | 13.6 | ||
Green | B Hussain | 79 | 3.9 | ||
Majority | |||||
Labour hold | Swing |
Party | Candidate | Votes | % | ± | |
---|---|---|---|---|---|
Liberal Democrat | D Webb | 1,757 | 41.1 | ||
Conservative | M Radnedge | 1,660 | 38.8 | ||
Labour | P Cooke | 859 | 20.1 | ||
Majority | |||||
Liberal Democrat gain from Conservative | Swing | ||||
Party | Candidate | Votes | % | ± | |
---|---|---|---|---|---|
Labour | M Chivers | 1,573 | 50.9 | ||
Conservative | W Biggs | 672 | 21.8 | ||
Green | J Boxall | 486 | 15.7 | ||
Liberal Democrat | J Bonham-Carter | 358 | 11.6 | ||
Majority | |||||
Labour hold | Swing |
Party | Candidate | Votes | % | ± | |
---|---|---|---|---|---|
Conservative | J Forrest | 2,152 | 47.5 | ||
Liberal Democrat | B McGrath | 1,397 | 30.9 | ||
Green | T Leimdorfer | 683 | 15.1 | ||
Labour | E Fowler | 294 | 6.5 | ||
Majority | |||||
Conservative hold | Swing |
Party | Candidate | Votes | % | ± | |
---|---|---|---|---|---|
Conservative | T Smith | 2,505 | 47.9 | ||
Liberal Democrat | P Heaney | 1,345 | 25.7 | ||
Labour | J Lloyd | 1,071 | 20.5 | ||
Green | J Thomas | 314 | 6.0 | ||
Majority | |||||
Conservative hold | Swing |
Party | Candidate | Votes | % | ± | |
---|---|---|---|---|---|
Liberal Democrat | A Hockridge | 2,005 | 46.9 | ||
Conservative | E Harraway | 1,534 | 35.9 | ||
Labour | J Davies | 739 | 17.3 | ||
Majority | |||||
Liberal Democrat gain from Conservative | Swing | ||||
Party | Candidate | Votes | % | ± | |
---|---|---|---|---|---|
Liberal Democrat | M Drew | 2,602 | 60.7 | ||
Conservative | F Davis | 959 | 22.4 | ||
Labour | J Sims | 636 | 14.8 | ||
Green | K Styles | 93 | 2.2 | ||
Majority | |||||
Liberal Democrat hold | Swing |
Party | Candidate | Votes | % | ± | |
---|---|---|---|---|---|
Liberal Democrat | J Dagnall | 3,004 | 58.6 | ||
Conservative | J Hadley | 1,741 | 33.9 | ||
Labour | D Jenks | 384 | 7.5 | ||
Majority | |||||
Liberal Democrat gain from Conservative | Swing | ||||
Somerset is a county in South West England which borders Gloucestershire and Bristol to the north, Wiltshire to the east, Dorset to the south-east and Devon to the south-west. It is bounded to the north and west by the Severn Estuary and the Bristol Channel, its coastline facing southeastern Wales. Its traditional border with Gloucestershire is the River Avon. Somerset's county town is Taunton.
North Somerset is a unitary authority area in England. Its area covers part of the ceremonial county of Somerset but it is administered independently of the non-metropolitan county. Its administrative headquarters is in the town hall in Weston-super-Mare.
North East Somerset is a constituency represented in the House of Commons of the UK Parliament since its 2010 creation by Jacob Rees-Mogg, a Conservative.
Bleadon is a village and civil parish in the historic county of Somerset, England. It is about 4 miles (6.4 km) south of Weston-super-Mare and, according to the 2011 census, has a population of 1,079.
Bath and North East Somerset is a unitary authority in Somerset, England. It was created on 1 April 1996 replacing Bath, Wansdyke and Avon County Council.
Kelston is a small village and civil parish in Somerset, 4 miles (6.4 km) north west of Bath, and 8 miles (12.9 km) east of Bristol, on the A431 road. It is situated just north of the River Avon, close to the Kelston and Saltford locks. The parish has a population of 248.
Bath and North East Somerset Council is the local council for the district of Bath and North East Somerset in Somerset, England.
Somerset County Council is the county council of Somerset in the South West of England, an elected local government authority responsible for the most significant local government services in most of the county. Somerset County Council plans drastic cuts to services because the government has cut funding and the council cannot balance its books.
North Somerset Council is a unitary authority in Somerset, England. Until 1 April 1996 it was a non-metropolitan district in Avon.
Burrington is a small village and civil parish in Somerset, England. It is situated in the Unitary authority of North Somerset, 5 miles (8.0 km) north east of Axbridge and about 10 miles (16 km) east of Weston-super-Mare. The parish includes the hamlets of Bourne and Rickford and has a population of 464.
Hutton is a village and civil parish in Somerset, England. The parish, which has a population of 2,582, is within the Unitary Authority of North Somerset and located on the western edge of the Mendip Hills, close to Weston-super-Mare.
Puxton is a village and civil parish, 5 miles (8.0 km) north west of Axbridge in the Unitary Authority of North Somerset within the ceremonial county of Somerset, England.
North Stoke is a village within the civil parish of Kelston in the Bath and North East Somerset (BANES) unitary authority within the historic county of Somerset, England, and close to the border with South Gloucestershire. The parish has a population of 72.
WebberBus was a privately owned company that operated bus services around Bridgwater, Burnham-on-Sea, Highbridge, Minehead, Taunton, Street, Glastonbury, and Wells in Somerset and also around Weston-super-Mare in North Somerset, England.
Wansdyke was a non-metropolitan district in Avon, England. It was abolished on 1 April 1996 and replaced by Bath and North East Somerset.
Avon was a non-metropolitan county in England. It was abolished on 1 April 1996 and replaced by Bath and North East Somerset, Bristol, North Somerset and South Gloucestershire.