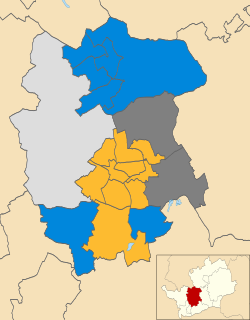
The 2010 Stroud Council election took place on 6 May 2010 to elect members of Stroud District Council in Gloucestershire, England. One third of the council was up for election and the Conservative party stayed in overall control of the council. [1]
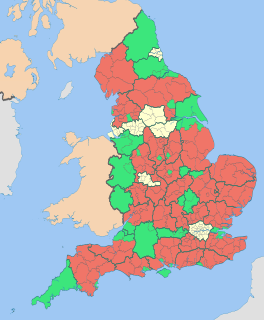
Non-metropolitan districts, or colloquially "shire districts", are a type of local government district in England. As created, they are sub-divisions of non-metropolitan counties in a two-tier arrangement.
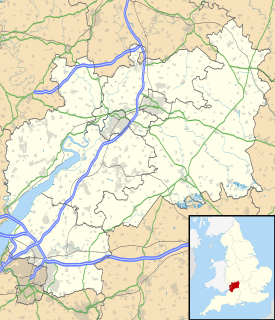
Gloucestershire is a county in South West England. The county comprises part of the Cotswold Hills, part of the flat fertile valley of the River Severn, and the entire Forest of Dean.
England is a country that is part of the United Kingdom. It shares land borders with Wales to the west and Scotland to the north-northwest. The Irish Sea lies west of England and the Celtic Sea lies to the southwest. England is separated from continental Europe by the North Sea to the east and the English Channel to the south. The country covers five-eighths of the island of Great Britain, which lies in the North Atlantic, and includes over 100 smaller islands, such as the Isles of Scilly and the Isle of Wight.
After the election, the composition of the council was
The Conservative Party, officially the Conservative and Unionist Party, is a centre-right political party in the United Kingdom. Presently led by Theresa May, it has been the governing party since 2010. It presently has 314 Members of Parliament in the House of Commons, 249 members of the House of Lords, and 18 members of the European Parliament. It also has 31 Members of the Scottish Parliament, 12 members of the Welsh Assembly, eight members of the London Assembly and 9,008 local councillors. One of the major parties of UK politics, it has formed the government on 45 occasions, more than any other party.
The Liberal Democrats are a liberal, centrist political party in the United Kingdom. They presently have 11 Members of Parliament in the House of Commons, 96 members of the House of Lords, and one member of the European Parliament. They also have five Members of the Scottish Parliament and a member each in the Welsh Assembly and London Assembly. The party reached the height of its influence in the early 2010s, forming a junior partner in a coalition government from 2010 to 2015. It is presently led by Vince Cable.
The Labour Party is a centre-left political party in the United Kingdom which has been described as an alliance of social democrats, democratic socialists and trade unionists. The party's platform emphasises greater state intervention, social justice and strengthening workers' rights. Labour is a full member of the Party of European Socialists and Progressive Alliance, and holds observer status in the Socialist International. As of 2017, the party was considered the "largest party in Western Europe" in terms of party membership, with more than half a million members.
The results saw the Conservatives retain control of the council with 30 councillors despite losing 2 seats to the Liberal Democrats. [3] [4] The Liberal Democrats gained Dursley and Wotton-under-Edge wards from the Conservatives, [3] to move to 7 seats, level with Labour. [4]
A Councillor is a member of a local government council.
Dursley is a market town and civil parish in southern Gloucestershire, England, situated almost equidistantly between the cities of Bristol and Gloucester. It is under the northeast flank of Stinchcombe Hill, and about 3 3⁄4 miles (6.0 km) southeast of the River Severn. The town is adjacent to Cam which, though a village, is a slightly larger community in its own right.
Wotton-under-Edge is a market town within the Stroud district of Gloucestershire, England. Located near the southern end of the Cotswolds, the Cotswold Way long-distance footpath passes through the town. Standing on the B4058 Wotton is about 5 miles (8.0 km) from the M5 motorway. The nearest railway station is Cam and Dursley, 7 miles (11 km) away by road, on the Bristol to Birmingham line.
Party | Seats | Gains | Losses | Net gain/loss | Seats % | Votes % | Votes | +/− | |
---|---|---|---|---|---|---|---|---|---|
Conservative | 12 | 1 | 2 | -1 | 66.7 | 44.1 | 21,102 | -7.1% | |
Liberal Democrat | 3 | 2 | 0 | +2 | 16.7 | 15.6 | 7,487 | +3.4% | |
Labour | 2 | 0 | 0 | 0 | 11.1 | 27.2 | 13,019 | +9.8% | |
Green | 1 | 0 | 0 | 0 | 5.6 | 13.0 | 6,242 | -4.8% | |
Independent | 0 | 0 | 1 | -1 | 0 | 0 | 0 | - |
Party | Candidate | Votes | % | ± | |
---|---|---|---|---|---|
Conservative | Gordon Craig | 1,281 | |||
Conservative | John Stanton | 1,253 | |||
Labour | Jaswant Gangotra | 800 | |||
Labour | John Greenwood | 790 | |||
Turnout | 4,124 | 71.0 | +32.0 | ||
Conservative hold | Swing | ||||
Conservative hold | Swing |
Party | Candidate | Votes | % | ± | |
---|---|---|---|---|---|
Conservative | Daniel Le Flemming | 721 | 48.1 | -15.3 | |
Green | Anna Bonallack | 585 | 39.1 | +15.4 | |
Labour | Theresa Watt | 192 | 12.8 | +8.2 | |
Majority | 136 | 9.1 | -30.6 | ||
Turnout | 1,498 | 83.3 | +31.4 | ||
Conservative hold | Swing |
Party | Candidate | Votes | % | ± | |
---|---|---|---|---|---|
Labour | Karon Cross | 1,725 | 44.6 | +2.4 | |
Conservative | Ian Robinson | 1,123 | 29.0 | -7.2 | |
Liberal Democrat | Sylvia Bridgland | 678 | 17.5 | +6.8 | |
Green | Helen Cranston | 341 | 8.8 | -2.1 | |
Majority | 602 | 15.6 | +9.5 | ||
Turnout | 3,867 | 70.1 | +36.8 | ||
Labour hold | Swing |
Party | Candidate | Votes | % | ± | |
---|---|---|---|---|---|
Conservative | John Hudson | 942 | 38.3 | -9.6 | |
Labour | Miranda Clifton | 858 | 34.9 | -3.2 | |
Liberal Democrat | Darren Jones | 586 | 23.8 | +9.8 | |
Green | Indigo Redfern | 73 | 3.0 | +3.0 | |
Majority | 84 | 3.4 | -6.4 | ||
Turnout | 2,459 | 75.6 | +29.5 | ||
Conservative hold | Swing |
Party | Candidate | Votes | % | ± | |
---|---|---|---|---|---|
Liberal Democrat | Dennis Andrewartha | 1,068 | 45.8 | +13.0 | |
Conservative | Jeffrey Tyndall | 662 | 28.4 | +0.4 | |
Labour | Josephine Colebrook | 604 | 25.9 | -13.4 | |
Majority | 406 | 17.4 | |||
Turnout | 2,334 | 72.3 | +34.3 | ||
Liberal Democrat hold | Swing |
Party | Candidate | Votes | % | ± | |
---|---|---|---|---|---|
Conservative | Chas Fellows | 2,033 | 51.5 | -4.7 | |
Green | Richard Dean | 1,041 | 26.4 | -2.8 | |
Labour | Sally Thorpe | 872 | 22.1 | +13.1 | |
Majority | 992 | 25.1 | -1.9 | ||
Turnout | 3,946 | 78.4 | +35.2 | ||
Conservative hold | Swing |
Party | Candidate | Votes | % | ± | |
---|---|---|---|---|---|
Conservative | Graham Trave | 844 | 55.9 | +20.9 | |
Labour | Tricia Leonard | 665 | 44.1 | +35.1 | |
Majority | 179 | 11.9 | |||
Turnout | 1,509 | 81.6 | +30.0 | ||
Conservative gain from Independent | Swing | ||||
Party | Candidate | Votes | % | ± | |
---|---|---|---|---|---|
Liberal Democrat | Brian Marsh | 1,136 | 33.0 | +0.7 | |
Conservative | Timothy Frankau | 1,120 | 32.5 | -1.9 | |
Labour | Geoffrey Wheeler | 1,026 | 29.8 | +1.6 | |
Green | Miriam Yagud | 163 | 4.7 | -0.5 | |
Majority | 16 | 0.5 | |||
Turnout | 3,445 | 68.1 | +29.1 | ||
Liberal Democrat gain from Conservative | Swing | ||||
Party | Candidate | Votes | % | ± | |
---|---|---|---|---|---|
Conservative | Graham Littleton | 1,606 | 63.1 | -6.2 | |
Labour | Barbara Peacock | 940 | 36.9 | +18.9 | |
Majority | 666 | 26.2 | -25.1 | ||
Turnout | 2,546 | 67.8 | +34.0 | ||
Conservative hold | Swing |
Party | Candidate | Votes | % | ± | |
---|---|---|---|---|---|
Conservative | Rowland Blackwell | 1,588 | 41.1 | -0.8 | |
Green | Catherine Farrell | 1,364 | 35.3 | -7.8 | |
Labour | Jo Smith | 908 | 23.5 | +13.9 | |
Majority | 224 | 5.8 | |||
Turnout | 3,860 | 72.9 | +26.5 | ||
Conservative hold | Swing |
Party | Candidate | Votes | % | ± | |
---|---|---|---|---|---|
Conservative | Frances Roden | 1,716 | 58.9 | -10.1 | |
Green | Peter Adams | 717 | 24.6 | +3.8 | |
Labour | Joan Moore | 481 | 16.5 | +6.3 | |
Majority | 999 | 34.3 | -13.8 | ||
Turnout | 2,914 | 80.5 | +30.5 | ||
Conservative hold | Swing |
Party | Candidate | Votes | % | ± | |
---|---|---|---|---|---|
Green | Philip Booth | 765 | 68.8 | +13.0 | |
Conservative | Jason Bullingham | 215 | 19.3 | -9.3 | |
Labour | John Appleton | 132 | 11.9 | +2.4 | |
Majority | 550 | 49.5 | +22.3 | ||
Turnout | 1,112 | 77.4 | +25.8 | ||
Green hold | Swing |
Party | Candidate | Votes | % | ± | |
---|---|---|---|---|---|
Conservative | John Jones | 1,511 | 53.1 | -7.5 | |
Liberal Democrat | John Howe | 825 | 29.0 | +9.7 | |
Labour | Lesley Williams | 507 | 17.8 | +4.8 | |
Majority | 686 | 24.1 | -17.2 | ||
Turnout | 2,843 | 76.4 | +33.5 | ||
Conservative hold | Swing |
Party | Candidate | Votes | % | ± | |
---|---|---|---|---|---|
Labour | Gary Powell | 1,684 | 41.9 | +1.7 | |
Conservative | Trevor Baker | 1,433 | 35.7 | -6.4 | |
Liberal Democrat | Andrew Fisk | 583 | 14.5 | +14.5 | |
Green | Clare Sheridan | 315 | 7.8 | -4.0 | |
Majority | 251 | 6.3 | |||
Turnout | 4,015 | 67.4 | +33.3 | ||
Labour hold | Swing |
Party | Candidate | Votes | % | ± | |
---|---|---|---|---|---|
Conservative | Nigel Studdert-Kennedy | 941 | 37.6 | -14.7 | |
Labour | Stephen Lydon | 593 | 23.7 | +0.7 | |
Liberal Democrat | Phillip Herbert | 558 | 22.3 | +11.4 | |
Green | Nicola Hillard | 412 | 16.5 | +2.7 | |
Majority | 348 | 13.9 | -15.4 | ||
Turnout | 2,504 | 76.5 | +35.3 | ||
Conservative hold | Swing |
Party | Candidate | Votes | % | ± | |
---|---|---|---|---|---|
Conservative | Penny Wride | 892 | 78.7 | +2.7 | |
Labour | Hilary Fowles | 242 | 21.3 | +11.7 | |
Majority | 650 | 57.3 | -4.2 | ||
Turnout | 1,134 | 76.0 | +26.9 | ||
Conservative hold | Swing |
Party | Candidate | Votes | % | ± | |
---|---|---|---|---|---|
Liberal Democrat | Alan O'Connor | 2,053 | 54.9 | +9.9 | |
Conservative | Nick McGarvey | 1,221 | 32.6 | -10.9 | |
Green | David Barker | 466 | 12.5 | +1.0 | |
Majority | 832 | 22.2 | +20.6 | ||
Turnout | 3,740 | 73.6 | +28.6 | ||
Liberal Democrat gain from Conservative | Swing | ||||
The 2008 St Albans City and District Council election took place on 1 May 2008 to elect members of St Albans District Council in Hertfordshire, England. One third of the council was up for election and the Liberal Democrats gained overall control of the council from no overall control.
The 1998 Worcester City Council election took place on 7 May 1998 to elect members of Worcester District Council in Worcestershire, England. One third of the council was up for election and the Labour party stayed in overall control of the council.
The 2006 Worcester City Council election took place on 4 May 2006 to elect members of Worcester District Council in Worcestershire, England. One third of the council was up for election and the Conservative party stayed in overall control of the council.
The 2010 Winchester Council election took place on 6 May 2010 to elect members of Winchester District Council in Hampshire, England. One third of the council was up for election and the Liberal Democrats gained overall control of the council from the Conservative party.
The 2000 Winchester Council election took place on 4 May 2000 to elect members of Winchester District Council in Hampshire, England. One third of the council was up for election and the Liberal Democrats stayed in overall control of the council.
The 2006 Winchester Council election took place on 4 May 2006 to elect members of Winchester District Council in Hampshire, England. One third of the council was up for election and the Conservative party gained overall control of the council from no overall control.
The 2010 Cheltenham Council election took place on 6 May 2010 to elect members of Cheltenham Borough Council in Gloucestershire, England. Half of the council was up for election and the Liberal Democrats stayed in overall control of the council.
The 1998 Cheltenham Council election took place on 7 May 1998 to elect members of Cheltenham Borough Council in Gloucestershire, England. One third of the council was up for election and the Liberal Democrats stayed in overall control of the council.
The 1999 Cheltenham Council election took place on 6 May 1999 to elect members of Cheltenham Borough Council in Gloucestershire, England. One third of the council was up for election and the Liberal Democrats lost overall control of the council to no overall control.
The 2008 Cheltenham Council election took place on 1 May 2008 to elect members of Cheltenham Borough Council in Gloucestershire, England. Half of the council was up for election and the council stayed under no overall control.
The 1998 Stroud Council election took place on 7 May 1998 to elect members of Stroud District Council in Gloucestershire, England. One third of the council was up for election and the council stayed under no overall control.
The 1999 Stroud Council election took place on 6 May 1999 to elect members of Stroud District Council in Gloucestershire, England. One third of the council was up for election and the council stayed under no overall control.
The 2000 Stroud Council election took place on 4 May 2000 to elect members of Stroud District Council in Gloucestershire, England. One third of the council was up for election and the council stayed under no overall control.
The 2002 Stroud Council election took place on 2 May 2002 to elect members of Stroud District Council in Gloucestershire, England. The whole council was up for election with boundary changes since the last election in 2000 reducing the number of seats by 4. The Conservative party gained overall control of the council from no overall control.
The 2003 Stroud Council election took place on 1 May 2003 to elect members of Stroud District Council in Gloucestershire, England. One third of the council was up for election and the Conservative party stayed in overall control of the council.
The 2004 Stroud Council election took place on 10 June 2004 to elect members of Stroud District Council in Gloucestershire, England. One third of the council was up for election and the Conservative party stayed in overall control of the council.
The 2006 Stroud Council election took place on 4 May 2006 to elect members of Stroud District Council in Gloucestershire, England. One third of the council was up for election and the Conservative party stayed in overall control of the council.
The 2007 Stroud Council election took place on 3 May 2007 to elect members of Stroud District Council in Gloucestershire, England. One third of the council was up for election and the Conservative party stayed in overall control of the council.
The 2008 Stroud Council election took place on 1 May 2008 to elect members of Stroud District Council in Gloucestershire, England. One third of the council was up for election and the Conservative party stayed in overall control of the council.
The 2010 Southampton Council election took place on 6 May 2010 to elect members of Southampton Unitary Council in Hampshire, England. One third of the council was up for election and the Conservative party stayed in overall control of the council.