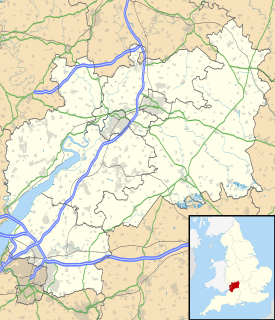
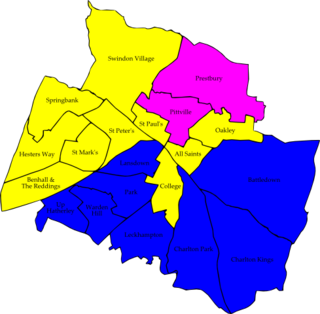
The 2008 Cheltenham Council election took place on 1 May 2008 to elect members of Cheltenham Borough Council in Gloucestershire, England. Half of the council was up for election and the council stayed under no overall control. [1]
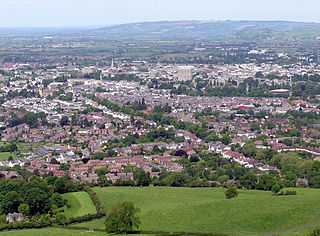
Cheltenham is a regency spa town and borough on the edge of the Cotswolds in Gloucestershire, England. Cheltenham has been a health and holiday spa town resort since the discovery of mineral springs in 1716 and has a number of internationally renowned and historic schools.
Borough status in the United Kingdom is granted by royal charter to local government districts in England, Wales and Northern Ireland. The status is purely honorary, and does not give any additional powers to the council or inhabitants of the district. In Scotland, similarly chartered communities were known as royal burghs, although the status is no longer granted.
Gloucestershire is a county in South West England. The county comprises part of the Cotswold Hills, part of the flat fertile valley of the River Severn, and the entire Forest of Dean.
After the election, the composition of the council was
The Liberal Democrats are a liberal political party in the United Kingdom. They presently have 11 Members of Parliament in the House of Commons, 96 members of the House of Lords, and one member of the European Parliament. They also have five Members of the Scottish Parliament and a member each in the Welsh Assembly and London Assembly. The party reached the height of its influence in the early 2010s, forming a junior partner in a coalition government from 2010 to 2015. It is presently led by Vince Cable.
The Conservative Party, officially the Conservative and Unionist Party, is a centre-right political party in the United Kingdom. Presently led by Theresa May, it has been the governing party since 2010. It presently has 314 Members of Parliament in the House of Commons, 249 members of the House of Lords, and 18 members of the European Parliament. It also has 31 Members of the Scottish Parliament, 12 members of the Welsh Assembly, eight members of the London Assembly and 9,008 local councillors. One of the major parties of UK politics, it has formed the government on 45 occasions, more than any other party.
People Against Bureaucracy (PAB) is a minor political party in Cheltenham, Gloucestershire. It was founded in 1976 to elect councillors to Tewkesbury Borough Council, later representing the same areas at Cheltenham Borough Council following council boundary changes. It describes itself as being opposed to 'party political' politics, and supportive of measures to make local government more transparent.
Before the election the Conservatives and Liberal Democrats had 17 seats each, People Against Bureaucracy 5 and Labour 1 seat, with the Conservatives forming the administration. [3] 20 seats were being contested with both Conservatives and Liberal Democrats contesting all of the seats, while Labour contested 9, Greens 4 and People Against Bureaucracy 3 seats. [3] The only Labour councillor Diana Hale stood down at the election, along with 2 Conservative and 1 People Against Bureaucracy councillors, while Liberal Democrat councillor Chris Coleman contested Leckhampton instead of his existing seat in St Paul's ward. [3]
The Labour Party is a centre-left political party in the United Kingdom which has been described as an alliance of social democrats, democratic socialists and trade unionists. The party's platform emphasises greater state intervention, social justice and strengthening workers' rights.
The Green Party of England and Wales is a green, left-wing political party in England and Wales. Headquartered in London, since September 2018, its co-leaders are Siân Berry and Jonathan Bartley. The Green Party has one representative in the House of Commons, one in the House of Lords, and three in the European Parliament. In addition, it has various councillors in UK local government and two members of the London Assembly.
A Councillor is a member of a local government council.
During the campaign the national Conservative leader David Cameron briefly visited Cheltenham to campaign, raising the issues of post offices being closed, garden grabbing, preserving local shops and house building on flood plains. [4] [5]
David William Donald Cameron is a British politician who served as Prime Minister of the United Kingdom from 2010 to 2016. He was the Member of Parliament (MP) for Witney from 2001 to 2016 and Leader of the Conservative Party from 2005 to 2016. He identifies as a one-nation conservative, and has been associated with both economically liberal and socially liberal policies.
A post office is a public department that provides a customer service to the public and handles their mail needs. Post offices offer mail-related services such as acceptance of letters and parcels; provision of post office boxes; and sale of postage stamps, packaging, and stationery. In addition, many post offices offer additional services: providing and accepting government forms, processing government services and fees, and banking services. The chief administrator of a post office is called a postmaster.
The results saw the Liberal Democrats become the largest party on the council with 20 of the 40 seats after making 3 gains. [6] [7] The Liberal Democrats held vulnerable seats in All Saints and St Peters wards, while making gains from each of the other 3 groups which had been defending seats. [8] They also almost defeated the Conservative leader of the council Duncan Smith who held on by 33 votes in Charlton Kings ward. [8]
Charlton Kings is a contiguous village adjoining or suburb of Cheltenham in Gloucestershire, England. The area constitutes a civil parish of 10,396 residents (2011).
The Conservatives stayed on 17 seats, [7] while the People Against Bureaucracy group lost 2 seats to have 3 councillors. [8] Labour was wiped out after losing their last seat [7] in Oakley, with the party only coming in third place in the ward. [9] Overall turnout in the election was 35.1%. [8]
Oakley is a district of Cheltenham in Gloucestershire, England. Until 2012, it was home to the smaller of Cheltenham's two GCHQ sites, and residential housing including private, council-owned and social housing. It backs onto Cleeve Hill and Harp Hill, greenbelt land and part of the Cotswold hills, including a covered reservoir. Oakley neighbours Prestbury and Whaddon. In the early 2000s, part of the GCHQ Oakley site was reclaimed and replaced with a Sainsburys supermarket. In the Domesday Book of 1086 it is recorded as held by Turstin FitzRolf.
Voter turnout is the percentage of eligible voters who cast a ballot in an election. Eligibility varies by country, and the voting-eligible population should not be confused with the total adult population. Age and citizenship status are often among the criteria used to determine eligibility, but some countries further restrict eligibility based on sex, race, or religion.
As a result of the election the Liberal Democrats took over control of the administration of the council from the Conservatives. [10] The change in control came in a vote with the Liberal Democrat leader Steve Jordan receiving 18 votes, compared to 19 abstentions and the remaining 3 councillors being absent. [11]
Party | Seats | Gains | Losses | Net gain/loss | Seats % | Votes % | Votes | +/− | |
---|---|---|---|---|---|---|---|---|---|
Liberal Democrat | 10 | 3 | 0 | +3 | 50.0 | 44.9 | 14,059 | +4.1% | |
Conservative | 9 | 1 | 1 | 0 | 45.0 | 45.8 | 14,342 | -0.1% | |
People Against Bureaucracy Action Group | 1 | 0 | 2 | -2 | 5.0 | 5.7 | 1,783 | -2.6% | |
Labour | 0 | 0 | 1 | -1 | 0 | 2.9 | 923 | -1.5% | |
Green | 0 | 0 | 0 | 0 | 0 | 0.7 | 209 | +0.7% |
Party | Candidate | Votes | % | ± | |
---|---|---|---|---|---|
Liberal Democrat | Stephen Jordan | 811 | 59.1 | +8.0% | |
Conservative | Peter Christensen | 461 | 33.6 | -3.9% | |
Green | Adrian Becker | 61 | 4.4 | +4.4% | |
Labour | Kevin Boyle | 40 | 2.9 | -2.9% | |
Majority | 350 | 25.5 | +11.9 | ||
Turnout | 1,373 | 31.9 | +1.8% | ||
Liberal Democrat hold | Swing |
Party | Candidate | Votes | % | ± | |
---|---|---|---|---|---|
Conservative | Andrew Wall | 1,013 | 66.7 | -1.6 | |
Liberal Democrat | Paul McCloskey | 442 | 29.1 | +3.5 | |
Labour | Catherine Mozley | 64 | 4.2 | -1.9 | |
Majority | 571 | 37.6 | -5.1 | ||
Turnout | 1,519 | 41.4 | -1.4 | ||
Conservative hold | Swing |
Party | Candidate | Votes | % | ± | |
---|---|---|---|---|---|
Conservative | Jacqueline Fletcher | 945 | 50.7 | +6.7 | |
Liberal Democrat | Christoper Pallet | 918 | 49.3 | -3.5 | |
Majority | 27 | 1.4 | |||
Turnout | 1,863 | 46.1 | +0.3 | ||
Conservative hold | Swing |
Party | Candidate | Votes | % | ± | |
---|---|---|---|---|---|
Conservative | Duncan Smith | 973 | 49.0 | -9.8 | |
Liberal Democrat | Helena McCloskey | 940 | 47.4 | +11.4 | |
Labour | Neville Mozley | 71 | 3.6 | -1.6 | |
Majority | 33 | 1.7 | -21.1 | ||
Turnout | 1,984 | 46.0 | +0.7 | ||
Conservative hold | Swing |
Party | Candidate | Votes | % | ± | |
---|---|---|---|---|---|
Conservative | Klara Sudbury | 1,285 | 67.9 | +3.8 | |
Liberal Democrat | Margaret Woodward | 607 | 32.1 | -3.8 | |
Majority | 678 | 35.8 | +7.7 | ||
Turnout | 1,892 | 47.0 | -1.6 | ||
Conservative hold | Swing |
Party | Candidate | Votes | % | ± | |
---|---|---|---|---|---|
Liberal Democrat | Lloyd Surgenor | 997 | 59.0 | +3.2 | |
Conservative | Timothy Mahon | 692 | 41.0 | -3.2 | |
Majority | 305 | 18.1 | +6.4 | ||
Turnout | 1,689 | 39.5 | +2.1 | ||
Liberal Democrat hold | Swing |
Party | Candidate | Votes | % | ± | |
---|---|---|---|---|---|
Liberal Democrat | Wendy Flynn | 779 | 65.1 | -1.3 | |
Conservative | Philip Woolley | 351 | 29.3 | +3.3 | |
Labour | Clive Harriss | 67 | 5.6 | -2.0 | |
Majority | 428 | 35.8 | -4.6 | ||
Turnout | 1,197 | 24.3 | -4.0 | ||
Liberal Democrat hold | Swing |
Party | Candidate | Votes | % | ± | |
---|---|---|---|---|---|
Conservative | Diggory Seacome | 759 | 59.3 | -8.9 | |
Liberal Democrat | Leone Meyer | 428 | 33.5 | +1.7 | |
Labour | Janet Thomas | 92 | 7.2 | +7.2 | |
Majority | 331 | 25.9 | -10.5 | ||
Turnout | 1,279 | 28.2 | -1.5 | ||
Conservative hold | Swing |
Party | Candidate | Votes | % | ± | |
---|---|---|---|---|---|
Conservative | Robin MacDonald | 1,210 | 56.0 | -4.5 | |
Liberal Democrat | Christopher Coleman | 950 | 44.0 | +4.5 | |
Majority | 260 | 12.0 | -8.9 | ||
Turnout | 2,160 | 52.9 | +1.5 | ||
Conservative hold | Swing |
Party | Candidate | Votes | % | ± | |
---|---|---|---|---|---|
Liberal Democrat | Martin Dunn | 661 | 51.3 | +5.8 | |
Conservative | Susie Godwin | 403 | 31.3 | +13.2 | |
Labour | Brian Hughes | 224 | 17.4 | -19.0 | |
Majority | 258 | 20.0 | +10.9 | ||
Turnout | 1,288 | 30.1 | -2.2 | ||
Liberal Democrat gain from Labour | Swing | ||||
Party | Candidate | Votes | % | ± | |
---|---|---|---|---|---|
Conservative | Heather McLAin | 1,273 | 67.7 | +1.5 | |
Liberal Democrat | Phillippa Stewart | 607 | 32.3 | -1.5 | |
Majority | 666 | 35.4 | +3.0 | ||
Turnout | 1,880 | 36.8 | -3.7 | ||
Conservative hold | Swing |
Party | Candidate | Votes | % | ± | |
---|---|---|---|---|---|
Conservative | Tim Cooper | 625 | 38.7 | +13.7 | |
Liberal Democrat | Rowena Hay | 541 | 33.5 | +8.0 | |
People Against Bureaucracy Action Group | Mary Nelson | 318 | 19.7 | -26.1 | |
Green | Cathy Green | 65 | 4.0 | +4.0 | |
Labour | Sandra Easton-Lawrence | 64 | 4.0 | +0.2 | |
Majority | 84 | 5.2 | |||
Turnout | 1,613 | 37.7 | -1.2 | ||
Conservative gain from Independent | Swing | ||||
Party | Candidate | Votes | % | ± | |
---|---|---|---|---|---|
People Against Bureaucracy Action Group | Malcolm Stennett | 1,098 | 55.1 | +0.3 | |
Conservative | Haydn Pearl | 539 | 27.0 | -6.5 | |
Liberal Democrat | Jennifer Jones | 253 | 12.7 | +1.0 | |
Labour | Jonquil Naish | 104 | 5.2 | +5.2 | |
Majority | 559 | 28.0 | +6.7 | ||
Turnout | 1,994 | 41.7 | -0.5 | ||
Independent hold | Swing |
Party | Candidate | Votes | % | ± | |
---|---|---|---|---|---|
Liberal Democrat | Simon Wheeler | 752 | 67.3 | +5.4 | |
Conservative | Simon Probert | 366 | 32.7 | -5.4 | |
Majority | 386 | 34.5 | +10.6 | ||
Turnout | 1,118 | 23.1 | -1.0 | ||
Liberal Democrat hold | Swing |
Party | Candidate | Votes | % | ± | |
---|---|---|---|---|---|
Liberal Democrat | John Webster | 622 | 50.3 | -3.9 | |
Conservative | Patsy Shilling | 423 | 34.2 | -1.4 | |
Labour | Rod Gay | 108 | 8.7 | -1.6 | |
Green | John Heyward | 83 | 6.7 | +6.7 | |
Majority | 199 | 16.1 | -2.5 | ||
Turnout | 1,236 | 26.4 | -1.8 | ||
Liberal Democrat hold | Swing |
Party | Candidate | Votes | % | ± | |
---|---|---|---|---|---|
Liberal Democrat | Paul Wheeldon | 493 | 65.7 | +14.5 | |
Conservative | Paul Ryder | 257 | 34.3 | +15.6 | |
Majority | 236 | 31.5 | -1.0 | ||
Turnout | 750 | 16.0 | -3.5 | ||
Liberal Democrat hold | Swing |
Party | Candidate | Votes | % | ± | |
---|---|---|---|---|---|
Liberal Democrat | John Rawson | 738 | 57.9 | +11.7 | |
Conservative | John Hopwood | 447 | 35.1 | -10.0 | |
Labour | Robert Irons | 89 | 7.0 | -1.8 | |
Majority | 291 | 22.8 | +21.7 | ||
Turnout | 1,274 | 26.0 | +0.6 | ||
Liberal Democrat hold | Swing |
Party | Candidate | Votes | % | ± | |
---|---|---|---|---|---|
Liberal Democrat | Bernard Fisher | 875 | 57.4 | +9.7 | |
People Against Bureaucracy | Peter Allen | 367 | 24.1 | -11.0 | |
Conservative | Leon Mekitarian | 282 | 18.5 | +1.3 | |
Majority | 508 | 33.3 | +20.7 | ||
Turnout | 1,524 | 33.4 | +1.3 | ||
Liberal Democrat gain from Independent | Swing | ||||
Party | Candidate | Votes | % | ± | |
---|---|---|---|---|---|
Liberal Democrat | Roger Whyborn | 1,115 | 58.4 | +19.7 | |
Conservative | Alan Nicholson | 793 | 41.6 | -3.1 | |
Majority | 322 | 16.9 | |||
Turnout | 1,908 | 45.0 | -1.6 | ||
Liberal Democrat gain from Conservative | Swing | ||||
Party | Candidate | Votes | % | ± | |
---|---|---|---|---|---|
Conservative | Anne Regan | 1,245 | 70.1 | +6.8 | |
Liberal Democrat | Frances McVeigh | 530 | 29.9 | -6.8 | |
Majority | 715 | 40.3 | +12.6 | ||
Turnout | 1,775 | 39.7 | -3.0 | ||
Conservative hold | Swing |
The 2002 Halton Borough Council election took place on 2 May 2002 to elect members of Halton Unitary Council in Cheshire, England. One third of the council was up for election and the Labour party stayed in overall control of the council.
The 2007 Halton Borough Council election took place on 3 May 2007 to elect members of Halton Unitary Council in Cheshire, England. One third of the council was up for election and the Labour party stayed in overall control of the council.
The 1999 Southend-on-Sea Council election took place on 6 May 1999 to elect members of Southend-on-Sea Unitary Council in Essex, England. One third of the council was up for election and the council stayed under no overall control.
The 2000 Southend-on-Sea Council election took place on 4 May 2000 to elect members of Southend-on-Sea Unitary Council in Essex, England. One third of the council was up for election and the Conservative party gained overall control of the council from no overall control.
The 2006 Southend-on-Sea Council election took place on 4 May 2006 to elect members of Southend-on-Sea Unitary Council in Essex, England. One third of the council was up for election and the Conservative party stayed in overall control of the council.
The 2007 Southend-on-Sea Council election took place on 3 May 2007 to elect members of Southend-on-Sea Unitary Council in Essex, England. One third of the council was up for election and the Conservative party stayed in overall control of the council.
An election for the Borough Council in Slough, England, was held on 6 May 2010. This was the 124th Slough general local authority election since Slough became a local government unit in 1863.
The 2010 Cheltenham Council election took place on 6 May 2010 to elect members of Cheltenham Borough Council in Gloucestershire, England. Half of the council was up for election and the Liberal Democrats stayed in overall control of the council.
The 1998 Cheltenham Council election took place on 7 May 1998 to elect members of Cheltenham Borough Council in Gloucestershire, England. One third of the council was up for election and the Liberal Democrats stayed in overall control of the council.
The 1999 Cheltenham Council election took place on 6 May 1999 to elect members of Cheltenham Borough Council in Gloucestershire, England. One third of the council was up for election and the Liberal Democrats lost overall control of the council to no overall control.
The 2000 Cheltenham Council election took place on 4 May 2000 to elect members of Cheltenham Borough Council in Gloucestershire, England. One third of the council was up for election and the Conservative party stayed in overall control of the council.
The 2006 Cheltenham Council election took place on 4 May 2006 to elect members of Cheltenham Borough Council in Gloucestershire, England. Half of the council was up for election and the council stayed under no overall control.
The 2008 Fareham Council election took place on 1 May 2008 to elect members of Fareham Borough Council in Hampshire, England. Half of the council was up for election and the Conservative party stayed in overall control of the council.
The 2006 Sunderland Council election took place on 4 May 2006 to elect members of Sunderland City Council in Tyne and Wear, England. One third of the Council was up for election and the Labour party stayed in overall control.
The 2008 Sunderland Council election took place on 1 May 2008 to elect members of Sunderland Metropolitan Borough Council in Tyne and Wear, England. One third of the council was up for election and the Labour party stayed in overall control of the council.
The 2010 Sunderland Council election took place on 6 May 2010 to elect members of Sunderland Metropolitan Borough Council in Tyne and Wear, England. One third of the council was up for election and the Labour party stayed in overall control of the council. The election took place on the same day as the 2010 General Election.
The 2008 Stroud Council election took place on 1 May 2008 to elect members of Stroud District Council in Gloucestershire, England. One third of the council was up for election and the Conservative party stayed in overall control of the council.
The 2002 Harrogate Council election took place on 2 May 2002 to elect members of Harrogate Borough Council in North Yorkshire, England. The whole council was up for election with boundary changes since the last election in 2000 reducing the number of seats by 5. The Liberal Democrats lost overall control of the council to no overall control.
The 2007 Christchurch Borough Council election took place on 3 May 2007 to elect members of Christchurch Borough Council in Dorset, England. The whole council was up for election and the Conservative party stayed in overall control of the council.