The 2000 Stroud Council election took place on 4 May 2000 to elect members of Stroud District Council in Gloucestershire, England. One third of the council was up for election and the council stayed under no overall control. [1]
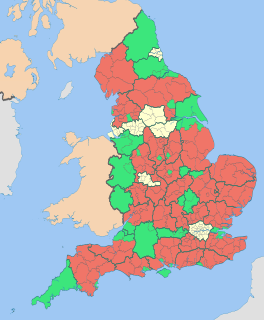
Non-metropolitan districts, or colloquially "shire districts", are a type of local government district in England. As created, they are sub-divisions of non-metropolitan counties in a two-tier arrangement.
Gloucestershire is a county in South West England. The county comprises part of the Cotswold Hills, part of the flat fertile valley of the River Severn, and the entire Forest of Dean.
England is a country that is part of the United Kingdom. It shares land borders with Wales to the west and Scotland to the north-northwest. The Irish Sea lies west of England and the Celtic Sea lies to the southwest. England is separated from continental Europe by the North Sea to the east and the English Channel to the south. The country covers five-eighths of the island of Great Britain, which lies in the North Atlantic, and includes over 100 smaller islands, such as the Isles of Scilly and the Isle of Wight.
After the election, the composition of the council was
The Conservative Party, officially the Conservative and Unionist Party, is a centre-right political party in the United Kingdom. Presently led by Theresa May, it has been the governing party since 2010. It presently has 314 Members of Parliament in the House of Commons, 249 members of the House of Lords, and 18 members of the European Parliament. It also has 31 Members of the Scottish Parliament, 12 members of the Welsh Assembly, eight members of the London Assembly and 9,008 local councillors. One of the major parties of UK politics, it has formed the government on 45 occasions, more than any other party.
The Labour Party is a centre-left political party in the United Kingdom which has been described as an alliance of social democrats, democratic socialists and trade unionists. The party's platform emphasises greater state intervention, social justice and strengthening workers' rights. Labour is a full member of the Party of European Socialists and Progressive Alliance, and holds observer status in the Socialist International. As of 2017, the party was considered the "largest party in Western Europe" in terms of party membership, with more than half a million members.
The Liberal Democrats are a liberal, centrist political party in the United Kingdom. They presently have 11 Members of Parliament in the House of Commons, 96 members of the House of Lords, and one member of the European Parliament. They also have five Members of the Scottish Parliament and a member each in the Welsh Assembly and London Assembly. The party reached the height of its influence in the early 2010s, forming a junior partner in a coalition government from 2010 to 2015. It is presently led by Vince Cable.
Before the election the council was run by an alliance between the Labour party and the Liberal Democrats. [3]
Party | Seats | Gains | Losses | Net gain/loss | Seats % | Votes % | Votes | +/− | |
---|---|---|---|---|---|---|---|---|---|
Conservative | 14 | +6 | 70.0 | 45.7 | 11,904 | ||||
Labour | 3 | -6 | 15.0 | 26.5 | 6,897 | ||||
Liberal Democrat | 2 | +1 | 10.0 | 20.2 | 5,250 | ||||
Green | 1 | 0 | 5.0 | 4.9 | 1,268 | ||||
Independent | 0 | -1 | 0 | 1.9 | 499 | ||||
UKIP | 0 | 0 | 0 | 0.5 | 136 | ||||
Natural Law | 0 | 0 | 0 | 0.3 | 66 |
Party | Candidate | Votes | % | ± | |
---|---|---|---|---|---|
Conservative | Anthony Moseley | 436 | 56.2 | ||
Labour | David Shaw | 259 | 33.4 | ||
Liberal Democrat | Thomas Murray | 81 | 10.4 | ||
Majority | 177 | 22.8 | |||
Turnout | 776 | 37.9 |
Party | Candidate | Votes | % | ± | |
---|---|---|---|---|---|
Labour | Andrew Read | 507 | 38.9 | ||
Liberal Democrat | Deborah Sutherland | 506 | 38.9 | ||
Conservative | Ralph Kenber | 289 | 22.2 | ||
Majority | 1 | 0.1 | |||
Turnout | 1,302 | 29.9 |
Party | Candidate | Votes | % | ± | |
---|---|---|---|---|---|
Liberal Democrat | Dennis Andrewartha | 526 | 33.1 | ||
Conservative | Philip Briscoe | 467 | 29.4 | ||
Labour | Miranda Clifton | 452 | 28.5 | ||
Independent | David Winsor | 142 | 8.9 | ||
Majority | 59 | 3.7 | |||
Turnout | 1,587 | 40.7 |
Party | Candidate | Votes | % | ± | |
---|---|---|---|---|---|
Conservative | Charles Fellows | 854 | 53.8 | ||
Labour | David Taylor | 305 | 19.2 | ||
Liberal Democrat | Leslie Christie | 291 | 18.3 | ||
UKIP | Adrian Blake | 136 | 8.6 | ||
Majority | 549 | 34.6 | |||
Turnout | 1,586 | 35.2 |
Party | Candidate | Votes | % | ± | |
---|---|---|---|---|---|
Conservative | Basil Allen | 605 | 41.1 | ||
Labour | Geoffrey Wheeler | 537 | 36.5 | ||
Liberal Democrat | David Thomas | 330 | 22.4 | ||
Majority | 68 | 4.6 | |||
Turnout | 1,472 | 33.0 |
Party | Candidate | Votes | % | ± | |
---|---|---|---|---|---|
Conservative | Graham Littleton | 532 | 56.1 | ||
Labour | David Purchase | 341 | 36.0 | ||
Liberal Democrat | John Howe | 75 | 7.9 | ||
Majority | 191 | 20.1 | |||
Turnout | 948 | 33.3 |
Party | Candidate | Votes | % | ± | |
---|---|---|---|---|---|
Conservative | Nigel Studdert-Kennedy | 471 | 35.1 | ||
Labour | Lesley Illiams | 411 | 30.6 | ||
Liberal Democrat | Elizabeth Cheyne | 255 | 19.0 | ||
Green | Sheila MacFadyen | 204 | 15.2 | ||
Majority | 60 | 4.5 | |||
Turnout | 1,341 | 44.9 |
Party | Candidate | Votes | % | ± | |
---|---|---|---|---|---|
Conservative | Dorcas Binns | 1,101 | |||
Conservative | Stephen Glanfield | 1,079 | |||
Labour | Martin Alder | 348 | |||
Labour | David Griffiths | 334 | |||
Liberal Democrat | Margaret Edmunds | 318 | |||
Liberal Democrat | Andrew Fisk | 235 | |||
Natural Law | Henry Brighouse | 28 | |||
Turnout | 3,443 | 41.1 |
Party | Candidate | Votes | % | ± | |
---|---|---|---|---|---|
Labour | Norman Kay | 710 | 44.7 | ||
Conservative | Mohammad Akhtar | 620 | 39.1 | ||
Liberal Democrat | Bruce Douglas-Mann | 257 | 16.2 | ||
Majority | 90 | 5.7 | |||
Turnout | 1,587 | 33.2 |
Party | Candidate | Votes | % | ± | |
---|---|---|---|---|---|
Conservative | John Stephenson-Oliver | 960 | 55.3 | ||
Liberal Democrat | Terence Parker | 625 | 36.0 | ||
Labour | John Rhodes | 113 | 6.5 | ||
Natural Law | Sally Brighouse | 38 | 2.2 | ||
Majority | 335 | 19.3 | |||
Turnout | 1,736 | 50.9 |
Party | Candidate | Votes | % | ± | |
---|---|---|---|---|---|
Conservative | David Tomlins | 453 | 70.5 | ||
Labour | Francoise Jones | 106 | 16.5 | ||
Liberal Democrat | Milner Woodhead | 84 | 13.1 | ||
Majority | 347 | 54.0 | |||
Turnout | 643 | 38.8 |
Party | Candidate | Votes | % | ± | |
---|---|---|---|---|---|
Liberal Democrat | Michael Charley | 278 | 54.2 | ||
Labour | Anthony Shoritt | 139 | 27.1 | ||
Conservative | John Ferris | 96 | 18.7 | ||
Majority | 139 | 27.1 | |||
Turnout | 513 | 44.2 |
Party | Candidate | Votes | % | ± | |
---|---|---|---|---|---|
Conservative | Roy Nicholas | 605 | 45.8 | ||
Labour | Ian Owen | 327 | 24.8 | ||
Green | Carol Kambites | 264 | 20.0 | ||
Liberal Democrat | Adrian Walker-Smith | 125 | 9.5 | ||
Majority | 278 | 21.0 | |||
Turnout | 1,321 | 32.1 |
Party | Candidate | Votes | % | ± | |
---|---|---|---|---|---|
Labour | Mattie Ross | 807 | 53.6 | ||
Conservative | Kamran Hameed | 476 | 31.6 | ||
Liberal Democrat | Melvyn Preston | 224 | 14.9 | ||
Majority | 331 | 22.0 | |||
Turnout | 1,507 | 28.4 |
Party | Candidate | Votes | % | ± | |
---|---|---|---|---|---|
Green | Gwendoline Belcher | 578 | 41.3 | ||
Conservative | Martin Hemming | 545 | 38.9 | ||
Labour | Henrietta Nichols | 192 | 13.7 | ||
Liberal Democrat | Margaret Fenn | 86 | 6.1 | ||
Majority | 33 | 2.4 | |||
Turnout | 1,401 | 35.9 |
Party | Candidate | Votes | % | ± | |
---|---|---|---|---|---|
Conservative | John Jeffreys | 428 | 32.3 | ||
Independent | Morgan Anthony | 357 | 26.9 | ||
Labour | Ronald Nichols | 235 | 17.7 | ||
Green | Kevin Cranston | 222 | 16.7 | ||
Liberal Democrat | Darren Jones | 84 | 6.3 | ||
Majority | 71 | 5.4 | |||
Turnout | 1,326 | 29.8 |
Party | Candidate | Votes | % | ± | |
---|---|---|---|---|---|
Conservative | Michael Beard | 372 | 53.8 | ||
Liberal Democrat | Keith Ardron | 270 | 39.1 | ||
Labour | Trevor Baker | 49 | 7.1 | ||
Majority | 102 | 14.8 | |||
Turnout | 691 | 51.8 |
Party | Candidate | Votes | % | ± | |
---|---|---|---|---|---|
Conservative | Jonathan Steel | 369 | 53.1 | ||
Labour | Robert Hall | 284 | 40.9 | ||
Liberal Democrat | Barbara Brown | 42 | 6.0 | ||
Majority | 85 | 12.2 | |||
Turnout | 695 | 48.3 |
Party | Candidate | Votes | % | ± | |
---|---|---|---|---|---|
Conservative | Sidney Gowers | 1,146 | 53.4 | ||
Liberal Democrat | Barrie Pierce | 558 | 26.0 | ||
Labour | Geoffrey Keen | 441 | 20.6 | ||
Majority | 588 | 27.4 | |||
Turnout | 2,145 | 37.0 |
Elections to Hartlepool Borough Council in the ceremonial county of County Durham in England were held on 4 May 2000. One third of the council was up for election and the Labour party lost overall control of the council to no overall control.
The 1999 Bromsgrove District Council election took place on 6 May 1999 to elect members of Bromsgrove district council in Worcestershire, England. The whole council was up for election and the Conservative party gained overall control of the council from the Labour party.
The 2000 Wyre Forest District Council election took place on 4 May 2000 to elect members of Wyre Forest District Council in Worcestershire, England. One third of the council was up for election and the council stayed under no overall control.
The 2000 Worcester City Council election took place on 4 May 2000 to elect members of Worcester District Council in Worcestershire, England. One third of the council was up for election and the Labour party lost overall control of the council to no overall control.
The 2002 Worcester City Council election took place on 2 May 2002 to elect members of Worcester District Council in Worcestershire, England. One third of the council was up for election and the council stayed under no overall control.
The 2000 Stratford-on-Avon District Council election took place on 4 May 2000 to elect members of Stratford-on-Avon District Council in Warwickshire, England. One third of the council was up for election and the Conservative party gained overall control of the council from no overall control.
The 2000 Southend-on-Sea Council election took place on 4 May 2000 to elect members of Southend-on-Sea Unitary Council in Essex, England. One third of the council was up for election and the Conservative party gained overall control of the council from no overall control.
The 2000 Cheltenham Council election took place on 4 May 2000 to elect members of Cheltenham Borough Council in Gloucestershire, England. One third of the council was up for election and the Conservative party stayed in overall control of the council.
The 2006 Solihull Metropolitan Borough Council election took place on 4 May 2006 to elect members of Solihull Metropolitan Borough Council in the West Midlands, England. One third of the council was up for election and the Conservative party stayed in overall control of the council.
The 1998 Stroud Council election took place on 7 May 1998 to elect members of Stroud District Council in Gloucestershire, England. One third of the council was up for election and the council stayed under no overall control.
The 1999 Stroud Council election took place on 6 May 1999 to elect members of Stroud District Council in Gloucestershire, England. One third of the council was up for election and the council stayed under no overall control.
The 2002 Stroud Council election took place on 2 May 2002 to elect members of Stroud District Council in Gloucestershire, England. The whole council was up for election with boundary changes since the last election in 2000 reducing the number of seats by 4. The Conservative party gained overall control of the council from no overall control.
The 2003 Stroud Council election took place on 1 May 2003 to elect members of Stroud District Council in Gloucestershire, England. One third of the council was up for election and the Conservative party stayed in overall control of the council.
The 2004 Stroud Council election took place on 10 June 2004 to elect members of Stroud District Council in Gloucestershire, England. One third of the council was up for election and the Conservative party stayed in overall control of the council.
The 2006 Stroud Council election took place on 4 May 2006 to elect members of Stroud District Council in Gloucestershire, England. One third of the council was up for election and the Conservative party stayed in overall control of the council.
The 2007 Stroud Council election took place on 3 May 2007 to elect members of Stroud District Council in Gloucestershire, England. One third of the council was up for election and the Conservative party stayed in overall control of the council.
The 2008 Stroud Council election took place on 1 May 2008 to elect members of Stroud District Council in Gloucestershire, England. One third of the council was up for election and the Conservative party stayed in overall control of the council.
The 2010 Stroud Council election took place on 6 May 2010 to elect members of Stroud District Council in Gloucestershire, England. One third of the council was up for election and the Conservative party stayed in overall control of the council.
The 2000 Harrogate Council election took place on 4 May 2000 to elect members of Harrogate Borough Council in North Yorkshire, England. One third of the council was up for election and the Liberal Democrats stayed in overall control of the council.
The 2002 Harrogate Council election took place on 2 May 2002 to elect members of Harrogate Borough Council in North Yorkshire, England. The whole council was up for election with boundary changes since the last election in 2000 reducing the number of seats by 5. The Liberal Democrats lost overall control of the council to no overall control.