The 2000 Torbay Council election took place on 4 May 2000 to elect members of Torbay unitary authority in England. The whole council was up for election and the Conservative party gained overall control of the council from no overall control. [1]
Torbay is a borough in Devon, England, administered by the unitary authority of Torbay Council. It consists of 62.87 square kilometres (24.27 sq mi) of land, spanning the towns of Torquay, Paignton and Brixham, located around an east-facing natural harbour on the English Channel. A popular tourist destination with a tight conurbation of resort towns, Torbay's sandy beaches, mild climate and recreational and leisure attractions have given rise to the nickname of the English Riviera.
The Conservative Party, officially the Conservative and Unionist Party, is a centre-right political party in the United Kingdom. Presently led by Theresa May, it has been the governing party since 2010. It presently has 314 Members of Parliament in the House of Commons, 249 members of the House of Lords, and 18 members of the European Parliament. It also has 31 Members of the Scottish Parliament, 12 members of the Welsh Assembly, eight members of the London Assembly and 9,008 local councillors. One of the major parties of UK politics, it has formed the government on 45 occasions, more than any other party.
In the context of local authorities in the United Kingdom, the term no overall control refers to a situation in which no single political group achieves a majority of seats; and is analogous to a hung parliament. Of the 310 councils who had members up for election in the 2007 local elections, 85 resulted in a NOC administration.
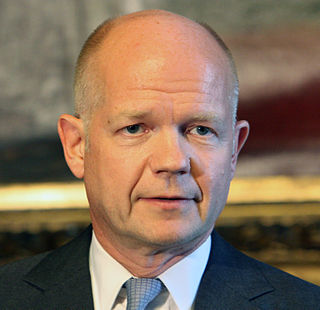
The election was seen as being a straight fight between the Liberal Democrats and Conservatives. [2] Before the election the Conservatives were optimistic that Torbay would be one of the councils that they would gain in the 2000 local elections [3] and they targeted it as a council that they had to win. [4] This emphasis on the council included two visits by William Hague the Conservative party leader. [5] Pre-election the Liberal Democrats only had control of the council based on the casting vote of the mayor, while the Conservatives needed 5 gains to take control. [5]
William Jefferson Hague, Baron Hague of Richmond, is a British Conservative politician and life peer. He represented Richmond, Yorkshire, as its Member of Parliament (MP) from 1989 to 2015 and was the Leader of the Opposition from 1997 to 2001. He was Secretary of State for Foreign and Commonwealth Affairs from 2010 to 2014 and was the Leader of the House of Commons from 2014 to 2015.
A casting vote is a vote that someone may exercise to resolve a deadlock. A casting vote is typically by the presiding officer of a council, legislative body, committee, etc., and may only be exercised to break a deadlock. Examples of officers who hold casting votes are the Speaker of the British House of Commons and the President of the United States Senate.
Conservative leaflets led with the theme of "Keep the Pound" but locally they accused the Liberal Democrat administration of incompetence and attacked the 22% Council Tax rise over the previous two years. [4] The Liberal Democrats were also attacked over the council's decision to not put on any floral displays in 1999 to save money, which was seen as being an error for an area dependent on tourism. [6] However the Liberal Democrats accused the Conservatives of playing on voters fears about asylum seekers being housed in the area. [4]
The pound sterling, commonly known as the pound and less commonly referred to as sterling, is the official currency of the United Kingdom, Jersey, Guernsey, the Isle of Man, South Georgia and the South Sandwich Islands, the British Antarctic Territory, and Tristan da Cunha. It is subdivided into 100 pence. A number of nations that do not use sterling also have currencies called the pound.
The Liberal Democrats are a liberal political party in the United Kingdom. They presently have 11 Members of Parliament in the House of Commons, 96 members of the House of Lords, and one member of the European Parliament. They also have five Members of the Scottish Parliament and a member each in the Welsh Assembly and London Assembly. The party reached the height of its influence in the early 2010s, forming a junior partner in a coalition government from 2010 to 2015. It is presently led by Vince Cable.
Council Tax is a local taxation system used in England, Scotland and Wales. It is a tax on domestic property which was introduced in 1993 by the Local Government Finance Act 1992, replacing the short lived Community Charge, which in turn replaced the domestic rates. Each property is assigned one of, eight bands in England and Scotland, or nine bands in Wales based on property value, and the tax is set as a fixed amount for each band. The more valuable the property, the higher the tax, except for properties valued above £320,000. Some property is exempt from the tax, some people are exempt from the tax, while some get a discount.
The results saw the Conservatives win 32 of the 36 seats on the council, with the Liberal Democrats reduced to just 4 seats after having run the council since 1991. [4] Liberal Democrat losses included the leader of the council, Anne Williams, and the mayor, John Turner. [4] The Labour party lost both their seats on the council blaming a poor turnout at 33% and the recent rise of only 75 pence in the state pension for their defeat. [4]
The Labour Party is a centre-left political party in the United Kingdom which has been described as an alliance of social democrats, democratic socialists and trade unionists. The party's platform emphasises greater state intervention, social justice and strengthening workers' rights.
Voter turnout is the percentage of eligible voters who cast a ballot in an election. Eligibility varies by country, and the voting-eligible population should not be confused with the total adult population. Age and citizenship status are often among the criteria used to determine eligibility, but some countries further restrict eligibility based on sex, race, or religion.
Following the election William Hague flew to Torbay to celebrate the results and described them as having begun the revival of the party. [7] The result was seen as being an omen for the next general election, where the sitting Liberal Democrat member of parliament Adrian Sanders only had a majority of 12 over the Conservatives. [4] However the 2001 general election would see the Liberal Democrats hold the parliamentary constituency with an increased majority. [8]
Adrian Mark Sanders is a Liberal Democrat politician in the United Kingdom. He was the Member of Parliament (MP) for Torbay in Devon from 1997 until his defeat in the 2015 general election.
Torbay is a constituency represented in the House of Commons of the UK Parliament since 2015 by Kevin Foster, a Conservative.
Party | Seats | Gains | Losses | Net gain/loss | Seats % | Votes % | Votes | +/− | |
---|---|---|---|---|---|---|---|---|---|
Conservative | 32 | +19 | 88.9 | 58.9 | 51,091 | ||||
Liberal Democrat | 4 | -14 | 11.1 | 31.9 | 27,672 | ||||
Labour | 0 | -2 | 0 | 8.1 | 7,000 | ||||
Independent Ratepayers | 0 | 0 | 0 | 0.6 | 508 | ||||
Best Value for Torbay | 0 | 0 | 0 | 0.3 | 251 | ||||
Monster Raving Loony | 0 | 0 | 0 | 0.2 | 177 | ||||
Independent | 0 | -3 | 0 | 0 | 0 | ||||
Party | Candidate | Votes | % | ± | |
---|---|---|---|---|---|
Conservative | Eric Abercrombie | 866 | |||
Conservative | Beverley Brennan | 828 | |||
Conservative | Olive Jarmain | 827 | |||
Liberal Democrat | Douglas Lentell | 766 | |||
Liberal Democrat | John Nicholls | 757 | |||
Liberal Democrat | Philip Whitehead | 714 | |||
Labour | Roger Ballinger | 369 | |||
Labour | Wayne Doidge | 347 | |||
Labour | Eric McCaig | 328 | |||
Turnout | 5,802 | 24.9 | |||
Party | Candidate | Votes | % | ± | |
---|---|---|---|---|---|
Conservative | Michael Hytche | 1,688 | |||
Conservative | Beryl McPhail | 1,685 | |||
Conservative | Christine Weston | 1,628 | |||
Liberal Democrat | Stewart Foulds | 720 | |||
Liberal Democrat | Jerome Betts | 686 | |||
Liberal Democrat | Neil King | 647 | |||
Labour | Rosalind Royle | 376 | |||
Turnout | 7,430 | 35.8 | |||
Party | Candidate | Votes | % | ± | |
---|---|---|---|---|---|
Conservative | John Goulden | 1,232 | |||
Conservative | Alan Hoyle | 1,197 | |||
Conservative | James O'Dwyer | 1,187 | |||
Liberal Democrat | Ann Williams | 1,023 | |||
Liberal Democrat | Richard James | 917 | |||
Liberal Democrat | Vincent McCann | 911 | |||
Labour | Brenda Hill | 316 | |||
Turnout | 6,783 | ||||
Party | Candidate | Votes | % | ± | |
---|---|---|---|---|---|
Conservative | Bruce Cowling | 970 | |||
Conservative | Peter Long | 908 | |||
Liberal Democrat | Elizabeth Midgley | 787 | |||
Liberal Democrat | John Davis | 786 | |||
Conservative | Alan Shepheard | 768 | |||
Liberal Democrat | John Dunn | 750 | |||
Independent Ratepayers | Lionel Digby | 508 | |||
Labour | Jonathan Haines | 358 | |||
Turnout | 5,835 | ||||
Party | Candidate | Votes | % | ± | |
---|---|---|---|---|---|
Conservative | Robert Pudner | 1,846 | |||
Conservative | Nicholas Bye | 1,831 | |||
Conservative | Moira Tapperell | 1,781 | |||
Liberal Democrat | Andrea Colborne | 486 | |||
Labour | John Robinson | 403 | |||
Labour | Christopher Day | 393 | |||
Liberal Democrat | Marlene Brown | 385 | |||
Labour | William Loader | 379 | |||
Turnout | 7,504 | ||||
Party | Candidate | Votes | % | ± | |
---|---|---|---|---|---|
Conservative | Jean Turnbull | 1,999 | |||
Conservative | Beverley Oxley | 1,995 | |||
Conservative | Ronald Morris | 1,949 | |||
Liberal Democrat | Timothy Nicholls | 897 | |||
Liberal Democrat | Linda Turner | 871 | |||
Liberal Democrat | John Pentney | 729 | |||
Labour | James Towell | 335 | |||
Turnout | 8,775 | ||||
Party | Candidate | Votes | % | ± | |
---|---|---|---|---|---|
Conservative | Heather Buckpitt | 1,531 | |||
Conservative | Paul Price | 1,517 | |||
Conservative | Donald Brook | 1,490 | |||
Liberal Democrat | Andrew Blake | 1,272 | |||
Liberal Democrat | Hilary Chambers | 1,212 | |||
Liberal Democrat | Roger Stringer | 1,169 | |||
Turnout | 8,191 | ||||
Party | Candidate | Votes | % | ± | |
---|---|---|---|---|---|
Conservative | Penelope Barnby | 1,991 | |||
Conservative | Maureen | 1,990 | |||
Conservative | Keith Bryant | 1,962 | |||
Liberal Democrat | John Turner | 1,133 | |||
Liberal Democrat | Andrew Douglas-Dunbar | 989 | |||
Liberal Democrat | Doreen Urquart | 935 | |||
Labour | Edward Harris | 394 | |||
Turnout | 9,394 | ||||
Party | Candidate | Votes | % | ± | |
---|---|---|---|---|---|
Conservative | Sally Jowett | 1,339 | |||
Conservative | Eileen Salloway | 1,332 | |||
Conservative | Alan Craig | 1,285 | |||
Labour | Michael Morey | 931 | |||
Labour | Irene Reade | 624 | |||
Labour | Peter Pimie | 614 | |||
Liberal Democrat | Frank Lomas | 404 | |||
Liberal Democrat | Stuart John | 403 | |||
Liberal Democrat | David Morris | 387 | |||
Turnout | 7,319 | ||||
Party | Candidate | Votes | % | ± | |
---|---|---|---|---|---|
Liberal Democrat | Stephen Darling | 1,157 | |||
Conservative | Mark Kingscote | 1,120 | |||
Liberal Democrat | Colin Charlwood | 1,102 | |||
Conservative | John Palmer | 1,084 | |||
Liberal Democrat | Alan Faulkner | 1,082 | |||
Conservative | Gert Eisner | 1,057 | |||
Labour | Stephen Turner | 293 | |||
Turnout | 6,895 | ||||
Party | Candidate | Votes | % | ± | |
---|---|---|---|---|---|
Conservative | Damian Barton | 994 | |||
Liberal Democrat | Jennider Faulkner | 924 | |||
Conservative | Frances Harrison | 917 | |||
Conservative | Margaret Stafford | 891 | |||
Liberal Democrat | Michael Collins | 787 | |||
Liberal Democrat | Michael Wege | 710 | |||
Labour | Pauline Cartlidge | 287 | |||
Best Value for Torbay | Stanley Lewis | 251 | |||
Turnout | 5,761 | ||||
Party | Candidate | Votes | % | ± | |
---|---|---|---|---|---|
Conservative | Richard Cuming | 1,838 | |||
Conservative | Julian Chandler | 1,805 | |||
Conservative | Matthew Phillips | 1,763 | |||
Liberal Democrat | Kathleen Hawkins | 441 | |||
Liberal Democrat | Eric Blatchford | 427 | |||
Liberal Democrat | Adrian Treneary | 306 | |||
Labour | Edward Corrigam | 253 | |||
Monster Raving Loony | John Rowe | 177 | |||
Turnout | 7,010 | ||||
The 1999 Bromsgrove District Council election took place on 6 May 1999 to elect members of Bromsgrove district council in Worcestershire, England. The whole council was up for election and the Conservative party gained overall control of the council from the Labour party.
The 1999 Worthing Borough Council election took place on 6 May 1999 to elect members of Worthing Borough Council in West Sussex, England. One third of the council was up for election and the Conservative party gained overall control of the council from the Liberal Democrats. Overall turnout was 34.8%.
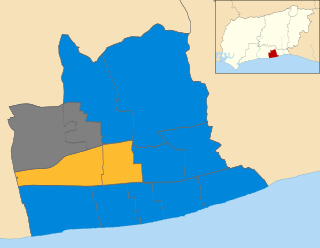
The 2007 Worthing Borough Council election took place on 3 May 2007 to elect members of Worthing Borough Council in West Sussex, England. One third of the council was up for election and the Conservative party stayed in overall control of the council.
The 2002 St Albans City and District Council election took place on 2 May 2002 to elect members of St Albans District Council in Hertfordshire, England. One third of the council was up for election and the council stayed under no overall control.
The 2006 Wyre Forest District Council election took place on 4 May 2006 to elect members of Wyre Forest District Council in Worcestershire, England. One third of the council was up for election and the council stayed under no overall control.
The 2003 Worcester City Council election took place on 1 May 2003 to elect members of Worcester District Council in Worcestershire, England. One third of the council was up for election and the Conservative party gained overall control of the council from no overall control.
The 2006 Worcester City Council election took place on 4 May 2006 to elect members of Worcester District Council in Worcestershire, England. One third of the council was up for election and the Conservative party stayed in overall control of the council.
The 2006 Winchester Council election took place on 4 May 2006 to elect members of Winchester District Council in Hampshire, England. One third of the council was up for election and the Conservative party gained overall control of the council from no overall control.
The 2000 Stratford-on-Avon District Council election took place on 4 May 2000 to elect members of Stratford-on-Avon District Council in Warwickshire, England. One third of the council was up for election and the Conservative party gained overall control of the council from no overall control.
The 2000 Southend-on-Sea Council election took place on 4 May 2000 to elect members of Southend-on-Sea Unitary Council in Essex, England. One third of the council was up for election and the Conservative party gained overall control of the council from no overall control.
The 2003 South Oxfordshire District Council election took place on 1 May 2003 to elect members of South Oxfordshire District Council in Oxfordshire, England. The whole council was up for election with boundary changes since the last election in 1999 reducing the number of seats by 2. The Conservative party gained overall control of the council from no overall control.
The 2003 Windsor and Maidenhead Borough Council election took place on 1 May 2003 to elect members of Windsor and Maidenhead Unitary Council in Berkshire, England. The whole council was up for election with boundary changes since the last election in 2000 reducing the number of seats by 1. The Liberal Democrats gained overall control of the council from no overall control.
The 2006 Solihull Metropolitan Borough Council election took place on 4 May 2006 to elect members of Solihull Metropolitan Borough Council in the West Midlands, England. One third of the council was up for election and the Conservative party stayed in overall control of the council.
The 2006 Harrogate Council election took place on 4 May 2006 to elect members of Harrogate Borough Council in North Yorkshire, England. One third of the council was up for election and the Conservative party lost overall control of the council to no overall control.
The 2011 North Devon District Council election took place on 5 May 2011 to elect members of North Devon District Council in Devon, England. The whole council was up for election and the Conservative party lost overall control of the council to no overall control.
The 2006 Maidstone Borough Council election took place on 4 May 2006 to elect members of Maidstone Borough Council in Kent, England. One third of the council was up for election and the council stayed under no overall control.
The 2008 Maidstone Borough Council election took place on 1 May 2008 to elect members of Maidstone Borough Council in Kent, England. One third of the council was up for election and the Conservative party gained overall control of the council from no overall control.
The 2003 North Devon District Council election took place on 1 May 2003 to elect members of North Devon District Council in Devon, England. The whole council was up for election with boundary changes since the last election in 1999 reducing the number of seats by 1. The Liberal Democrats stayed in overall control of the council.
The 2003 Eastbourne Borough Council election took place on 1 May 2003 to elect members of Eastbourne Borough Council in East Sussex, England. One third of the council was up for election and the Liberal Democrats stayed in overall control of the council.
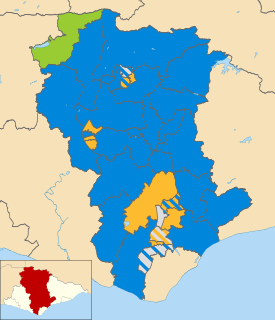
The 2007 Wealden District Council election took place on 3 May 2007 to elect members of Wealden District Council in East Sussex, England. The whole council was up for election and the Conservative party stayed in overall control of the council.