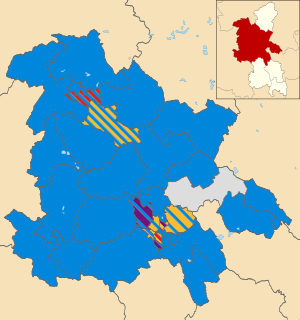
The 2015 Torbay Council election took place on 7 May 2015 to elect members of Torbay Council in England. [1] This was on the same day as other local elections, and the general election.
Torbay Council is the local authority of Torbay in Devon, England. It is a unitary authority, having the powers of a non-metropolitan county and district council combined. It provides a full range of local government services including Council Tax billing, libraries, social services, processing planning applications, waste collection and disposal, and it is a local education authority. The council appoints members to Devon and Somerset Fire and Rescue Authority and the Devon and Cornwall Police and Crime Panel. Torbay is divided into 15 wards, electing 36 councillors. The whole council is elected every four years with the last election taking place on 7 May 2015 and the next election scheduled for 2019. The council was created by the Local Government Act 1972 and replaced the Torbay Borough Council of the County Borough of Torbay. Since 1974 Torbay has held borough status which entitles the council to be known as Torbay Borough Council, although it has not used this name since becoming a unitary authority. The council is unusual in that its executive function is controlled by a directly elected mayor of Torbay, currently Gordon Oliver.
England is a country that is part of the United Kingdom. It shares land borders with Wales to the west and Scotland to the north-northwest. The Irish Sea lies west of England and the Celtic Sea lies to the southwest. England is separated from continental Europe by the North Sea to the east and the English Channel to the south. The country covers five-eighths of the island of Great Britain, which lies in the North Atlantic, and includes over 100 smaller islands, such as the Isles of Scilly and the Isle of Wight.
Party | Seats | Gains | Losses | Net gain/loss | Seats % | Votes % | Votes | +/− | |
---|---|---|---|---|---|---|---|---|---|
Conservative | 25 | 3 | 0 | 69.445 | 36.19 | 47478 | -5.61 | ||
Liberal Democrat | 7 | 0 | 2 | 19.445 | 24.83 | 32572 | -3.87 | ||
Labour | 0 | 0 | 1 | 0 | 9.34 | 12254 | -0.06 | ||
Green | 0 | 0 | 0 | 0 | 9.20 | 12066 | +1.9 | ||
UKIP | 1 | 0 | 0 | 2.78 | 15.42 | 20225 | +13.62 | ||
Independent | 3 | 0 | 0 | 8.33 | 5.02 | 6595 | -3.78 | ||
An asterisk * indicated an incumbent seeking re-election
Party | Candidate | Votes | % | ± | |
---|---|---|---|---|---|
Independent | Jackie Stockman* | 1930 | |||
Independent | Vic Ellery* | 1690 | |||
Independent | Mike Morey* | 1679 | |||
Conservative | Judith Mills | 1483 | |||
Conservative | Adam Billings | 1134 | |||
Green | Charlie Baker | 682 | |||
Green | Sassie Tickle | 532 | |||
Liberal Democrat | Michael Desmond | 322 | |||
Liberal Democrat | David Fordham | 296 | |||
Liberal Democrat | Eileen Fox | 288 | |||
Majority | |||||
Turnout | 62.54 | +18.52 | |||
Independent hold | Swing | ||||
Party | Candidate | Votes | % | ± | |
---|---|---|---|---|---|
Conservative | David Thomas* | 1659 | |||
Conservative | John Thomas* | 1495 | |||
Conservative | Chris Robson | 1406 | |||
UKIP | Steve Walsh | 1300 | |||
Liberal Democrat | Sabrina Bradshaw | 799 | |||
Labour | Jane Macey | 795 | |||
Labour | Eddie Harris | 764 | |||
Labour | Jackie Colby | 754 | |||
Liberal Democrat | Naomi Milward | 615 | |||
Liberal Democrat | Ian Somerville | 605 | |||
Green | Neil Rolfe | 472 | |||
Green | Stephen Peacock | 426 | |||
Green | Ashley Cunningham | 411 | |||
Majority | |||||
Turnout | 55.41 | +21.67 | |||
Conservative hold | Swing | ||||
Party | Candidate | Votes | % | ± | |
---|---|---|---|---|---|
Conservative | Derek Mills* | 1726 | |||
Conservative | Di Stubley | 1627 | |||
UKIP | Elizabeth Rayner | 965 | |||
Liberal Democrat | Dave Browne | 725 | |||
Labour | Bill Ingham | 288 | |||
Liberal Democrat | Thomas Pentney | 417 | |||
Green | Richard Spreckley | 396 | |||
Majority | |||||
Turnout | 71.93 | +17.91 | |||
Conservative hold | Swing | ||||
Party | Candidate | Votes | % | ± | |
---|---|---|---|---|---|
Liberal Democrat | Ian Doggett* | 1162 | |||
Liberal Democrat | Ruth Pentney* | 1154 | |||
Conservative | Richard Barnby | 1108 | |||
UKIP | Christine Dayment | 766 | |||
Conservative | Jackie Perrins | 740 | |||
Labour | Christina Vincent | 480 | |||
Green | Karen Cunningham | 370 | |||
Green | Matthew Rudland-Barfoot | 232 | |||
Majority | |||||
Turnout | 62.63 | +20.9 | |||
Liberal Democrat hold | Swing | ||||
Party | Candidate | Votes | % | ± | |
---|---|---|---|---|---|
Conservative | Nicole Amil* | 2048 | |||
Conservative | Mark King | 1752 | |||
Conservative | Thomas Winfield | 1664 | |||
Labour | Jack Critchlow | 1426 | |||
Liberal Democrat | Jean Cope | 1379 | |||
Liberal Democrat | Joanne Ledger | 1094 | |||
UKIP | Mark Dent | 1031 | |||
UKIP | Len Harvey | 998 | |||
Liberal Democrat | Fiona Hess | 918 | |||
UKIP | Merrick Rayner | 787 | |||
Green | Joanne McQuillan | 674 | |||
Green | Jimi Neary | 445 | |||
Majority | |||||
Turnout | 65.90 | +32.08 | |||
Conservative hold | Swing | ||||
Party | Candidate | Votes | % | ± | |
---|---|---|---|---|---|
UKIP | Julien Parrott* | 929 | |||
Liberal Democrat | Cindy Stocks* | 774 | |||
Liberal Democrat | Paul Raybould | 594 | |||
Conservative | Beryl McPhail | 552 | |||
Labour | Suzannah Jones | 534 | |||
Conservative | Matthew Phillips | 533 | |||
UKIP | Jen Walsh | 513 | |||
Green | Hazel Robertson | 306 | |||
Majority | |||||
Turnout | 52.88 | +19.06 | |||
UKIP hold | Swing | ||||
Liberal Democrat hold | Swing | ||||
Party | Candidate | Votes | % | ± | |
---|---|---|---|---|---|
Conservative | Jane Barnby* | 1325 | |||
Conservative | Alan Tyerman* | 1035 | |||
Liberal Democrat | Sue Biles | 965 | |||
UKIP | Gary Booth | 908 | |||
Liberal Democrat | Robert O'Brien | 732 | |||
UKIP | Peter Fryett | 670 | |||
Labour | Rosalind Royle | 468 | |||
Green | Jane Mary Hughes | 265 | |||
Green | Ellie Knight-Rolfe | 203 | |||
Majority | |||||
Turnout | 67.22 | +33.4 | |||
Conservative hold | Swing | ||||
Party | Candidate | Votes | % | ± | |
---|---|---|---|---|---|
Conservative | Chris Lewis* | 2155 | |||
Conservative | Lynn Sykes | 2023 | |||
Conservative | Anna Tolchard | 1722 | |||
UKIP | Sue Powell | 1419 | |||
Liberal Democrat | John Turner | 1324 | |||
Liberal Democrat | Elliot Abercrombie | 1296 | |||
Liberal Democrat | Linda Turner | 1281 | |||
Labour | Stephen Turner | 758 | |||
Green | Ian Downer | 606 | |||
Green | Jules Kirkby | 603 | |||
Green | Andrew Robinson | 543 | |||
Majority | |||||
Turnout | 68.82 | +23.36 | |||
Conservative hold | Swing | ||||
Party | Candidate | Votes | % | ± | |
---|---|---|---|---|---|
Conservative | Barbara Cunningham | 820 | |||
Liberal Democrat | Christine Carter | 685 | |||
Conservative | Simon Slade | 586 | |||
UKIP | Anthony Rayner | 575 | |||
UKIP | Eileen Harvey | 560 | |||
Liberal Democrat | Maggi Douglas-Dunbar | 494 | |||
Green | Paula Hermes | 468 | |||
Green | Sam Moss | 448 | |||
Labour | Irene Reade | 337 | |||
Independent | Bobbie Davies* | 330 | |||
Independent | Rick Heyse | 132 | |||
Majority | |||||
Turnout | 54.73 | +16.58 | |||
Conservative hold | Swing | ||||
Liberal Democrat hold | Swing | ||||
Bobbie Davies was elected for this ward as a Liberal Democrat in 2011, and Rick Heyse stood in the seat as an English Radical in the same election.
Party | Candidate | Votes | % | ± | |
---|---|---|---|---|---|
Conservative | Mark Kingscote* | 1425 | |||
Conservative | Dave Morris | 1405 | |||
Liberal Democrat | Colin Charlwood | 1250 | |||
Liberal Democrat | Adam Carter | 969 | |||
UKIP | Tamsin Davies | 905 | |||
UKIP | Mary Bennett | 812 | |||
Labour | Arjun Mehta | 606 | |||
Green | Ellie Taylor | 366 | |||
Majority | |||||
Turnout | 60.73 | +21.68 | |||
Conservative hold | Swing | ||||
Party | Candidate | Votes | % | ± | |
---|---|---|---|---|---|
Conservative | Neil Bent | 1772 | |||
Conservative | Anne Brooks | 1757 | |||
Conservative | Ray Hill* | 1588 | |||
Liberal Democrat | David Ward | 1541 | |||
Liberal Democrat | Steve Parr | 1469 | |||
Liberal Democrat | Hamish Renton | 1391 | |||
UKIP | Rie Greenwood | 1075 | |||
UKIP | Ian Walsh | 971 | |||
Labour | John Coombs | 877 | |||
Green | Jenny Giel | 738 | |||
Majority | |||||
Turnout | 62.91 | +21.59 | |||
Conservative gain from Liberal Democrat | Swing | ||||
Conservative hold | Swing | ||||
Party | Candidate | Votes | % | ± | |
---|---|---|---|---|---|
Conservative | Richard Haddock | 1151 | |||
Conservative | Terry Manning* | 916 | |||
UKIP | Sue Davies | 736 | |||
UKIP | Mike Cuggy | 714 | |||
Labour | Rosemary Clark | 546 | |||
Labour | Philip Gregory | 450 | |||
Liberal Democrat | Steve Bryant | 400 | |||
Independent | Ian Carr | 345 | |||
Liberal Democrat | Hannah Stevens | 285 | |||
Green | John Fallon | 254 | |||
Green | Julian Gunther | 179 | |||
Majority | |||||
Turnout | 58.17 | +16.53 | |||
Conservative hold | Swing | ||||
Conservative gain from Liberal Democrat | Swing | ||||
Party | Candidate | Votes | % | ± | |
---|---|---|---|---|---|
Liberal Democrat | Mandy Darling | 1304 | |||
Conservative | Robert Excell* | 1289 | |||
Conservative | Andy Lang | 1154 | |||
Conservative | Jackie Wakeman | 1125 | |||
Liberal Democrat | Gill Hayman | 1067 | |||
UKIP | Raymond Crump | 971 | |||
Labour | Darren Cowell | 944 | |||
Liberal Democrat | Robert Long | 933 | |||
UKIP | Neil Mead | 909 | |||
Labour | Lesley Discombe | 662 | |||
Green | Virginia Allum | 620 | |||
Labour | Julia Neal | 588 | |||
Green | Virginia Keyes | 511 | |||
Green | Stephen Morley | 416 | |||
Majority | |||||
Turnout | 53.07 | +19.76 | |||
Liberal Democrat hold | Swing | ||||
Conservative hold | Swing | ||||
Conservative gain from Labour | Swing | ||||
Party | Candidate | Votes | % | ± | |
---|---|---|---|---|---|
Liberal Democrat | Steve Darling* | 1383 | |||
Liberal Democrat | Roger Stringer* | 1146 | |||
Conservative | Celia Brown | 746 | |||
Labour | Kevin Hughes | 612 | |||
Conservative | Dan Godfrey | 595 | |||
Labour | Jermaine Atiya-Alla | 365 | |||
UKIP | Rob Howard | 277 | |||
Green | Jenny Stoneman | 194 | |||
Majority | |||||
Turnout | 59.19 | +17.83 | |||
Liberal Democrat hold | Swing | ||||
Party | Candidate | Votes | % | ± | |
---|---|---|---|---|---|
Conservative | Nick Bye | 2157 | |||
Conservative | James O'Dwyer | 1805 | |||
Liberal Democrat | Deborah Brewer | 934 | |||
UKIP | Chris Gibbings | 718 | |||
UKIP | Danny Harvey | 716 | |||
Liberal Democrat | Nick Pentney | 581 | |||
Independent | Fiona McPhail | 489 | |||
Green | Jessica Richards | 380 | |||
Green | Clive Richards | 326 | |||
Majority | |||||
Turnout | 66.27 | +20.65 | |||
Conservative hold | Swing | ||||
The by-election was held on 5 November 2015, following the death of Councillor Ruth Pentney. [4]
Party | Candidate | Votes | % | ± | |
---|---|---|---|---|---|
Liberal Democrat | Adrian Sanders | 1096 | 69.14 | ||
Conservative | Richard Barnby | 235 | 14.83 | ||
UKIP | Anthony Rayner | 158 | 9.97 | ||
Labour | Eddie Harris | 53 | 3.34 | ||
Green | Stephen Pocock | 43 | 2.71 | ||
Majority | 861 | 54.31 | |||
Turnout | 1585 | 28.5 | -34.13 | ||
Liberal Democrat hold | Swing | ||||
The by-election was called following the resignation of Councillor Andy Lang, and held on 5 May 2016. [5]
Party | Candidate | Votes | % | ± | |
---|---|---|---|---|---|
Liberal Democrat | Nicholas Pentney | 1126 | 46.70 | ||
Conservative | Jackie Wakeham | 533 | 22.11 | ||
Labour | Darren Cowell | 344 | 14.27 | ||
UKIP | Steven Walsh | 315 | 13.06 | ||
Green | Stephen Morley | 66 | 2.74 | ||
TUSC | Michelle Goodman | 27 | 1.12 | ||
Majority | 593 | 24.59 | |||
Turnout | 2411 | 29.76 | -23.31 | ||
Liberal Democrat gain from Conservative | Swing | ||||
The by-election was called following the death of Councillor Roger Stringer [6] . The by-election was held on 14 December 2017.
Party | Candidate | Votes | % | ± | |
---|---|---|---|---|---|
Liberal Democrat | Swithin Long | 655 | 57.06 | ||
Conservative | Daniel Maddock | 355 | 30.92 | ||
Labour | Julia Neal | 121 | 10.54 | ||
Green | Eleanor Taylor | 17 | 1.48 | ||
Majority | 300 | 26.14 | |||
Turnout | 1148 | 22.30 | -36.89 | ||
Liberal Democrat hold | Swing | ||||
Torbay is a unitary authority in Devon, England. Until 1 April 1998 it was a non-metropolitan district. Since 2005 it has also had a directly elected mayor.
Directly elected mayors in England and Wales are local government executive leaders who have been directly elected by the people who live in a local authority area. The first such political post was the Mayor of London, created as the executive of the Greater London Authority in 2000 as part of a reform of the local government of Greater London. Since the Local Government Act 2000, all of the several hundred principal local councils in England and Wales are required to review their executive arrangements.
One-third of Weymouth and Portland District Council in Dorset, England, is elected each year, followed by one year where there is an election to Dorset County Council instead.
Redbridge London Borough Council is elected every four years.
Havering London Borough Council in London, England is elected every four years. Since the last boundary changes in 2002, 54 councillors have been elected from 18 wards.
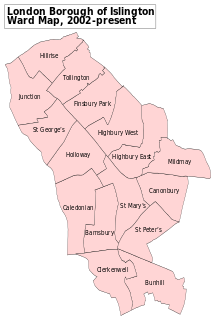
Islington London Borough Council in London, England is elected every four years. Since the last boundary changes in 2002, 48 councillors have been elected from 16 wards.
The Mayor of Torbay is the executive mayor of the borough of Torbay in Devon, England. The incumbent since 2011 is Gordon Oliver. The post will be abolished in 2019, after a referendum held in May 2016.
The Mayor of Bristol is the head of Bristol City Council. The Mayor is an elected politician who, along with the 70 members of Bristol City Council, is responsible for the strategic government of the city of Bristol, England. The role was created after a local referendum held on 3 May 2012, which followed the passage of the Localism Act 2011. 41,032 voted for an elected mayor and 35,880 voted against, with a turnout of 24%. An election for the new post was held on 15 November 2012.
Greenwich London Borough Council in London, England is elected every four years. Since the last boundary changes in 2002, 51 councillors have been elected from 17 wards.
Wandsworth London Borough Council in London, England, is elected every four years. Since the last boundary changes in 2002, 60 councillors have been elected from 20 wards.
The 2014 Lambeth Council election was held on 22 May 2014 to elect members of Lambeth Council in Greater London, England. This was on the same day as other local elections. The election saw the Labour Party further increase its majority on the council, winning all but four of the 63 council seats.
The 2014 Newham London Borough Council election took place on 22 May 2014 to elect members of Newham London Borough Council in England. This was on the same day as other local elections.
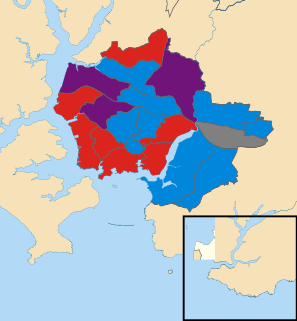
The 2014 Plymouth City Council election took place on 22 May 2014 to elect members of Plymouth City Council in England. This was on the same day as other local elections. The election was won by the Labour Party, who maintained their overall majority. The UK Independence Party gained representation on the council for the first time, and this was the only election in which the party won seats in Plymouth.
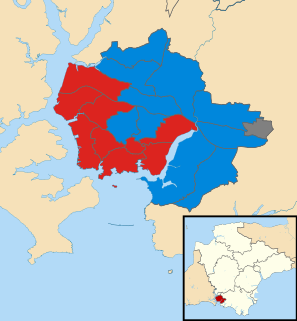
The 2015 Plymouth City Council election took place on 7 May 2015 to elect members of Plymouth City Council in England.
The 2015 Poole Borough Council election took place on 7 May 2015 to elect members of Poole Borough Council in England. This was on the same day as other local elections and the Parliamentary General Election.
The 2015 Aylesbury Vale District Council election took place on 7 May 2015 to elect members of Aylesbury Vale District Council in Buckinghamshire, England. The whole council was up for election with boundary changes since the last election in 2011. The Conservative party remained in overall control of the council.
The 2015 Torridge District Council election took place on 7 May 2015 to elect members of Torridge District Council in England. This was on the same day as other local elections and the 2015 UK General Election hence turnout was much higher than usual Local Elections.
Knutsford Town Council is the town council for the Cheshire Market Town of Knutsford. It was established in 1974 as a successor council to the Knutsford Urban District Council. The Council last elections were held in May 2015 which saw the Conservative Party win 13 of the 15 seats. The Council is split into four wards, Nether (3), Norbury Booths (3), Over (6) and Bexton (3).
The 2017 United Kingdom local elections were held on Thursday 4 May 2017. Local elections were held across Great Britain, with elections to 35 English local authorities and all councils in Scotland and Wales.