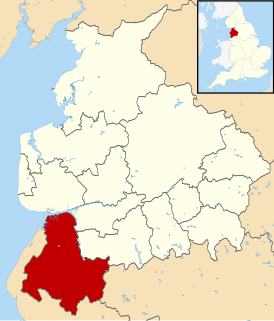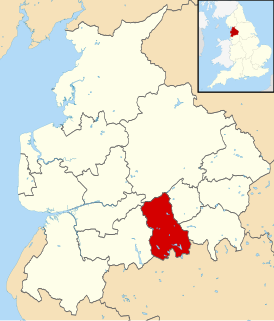
The 2015 West Lancashire Borough Council election took place on 7 May 2015, to elect members of West Lancashire Borough Council in Lancashire, England. One third of the council was election.The UK general election was also on 7 May 2015. [1]
West Lancashire is a non-metropolitan district with the status of a borough in Lancashire, England. Its council is based in Ormskirk. The other town in the borough is Skelmersdale. The population of the District taken at the 2011 census was 110,685. The district was formed in 1974 under the Local Government Act 1972, as a merger of Ormskirk and Skelmersdale and Holland urban districts along with part of West Lancashire Rural District and part of the former Wigan Rural District.
Borough status in the United Kingdom is granted by royal charter to local government districts in England, Wales and Northern Ireland. The status is purely honorary, and does not give any additional powers to the council or inhabitants of the district. In Scotland, similarly chartered communities were known as royal burghs, although the status is no longer granted.
Lancashire is a ceremonial county in North West England. The administrative centre is Preston. The county has a population of 1,449,300 and an area of 1,189 square miles (3,080 km2). People from Lancashire are known as Lancastrians.
Party | Candidate | Votes | % | ± | |
---|---|---|---|---|---|
Labour | Liz Savage | 2,211 | 71.9% | -5.4% | |
UKIP | Barry Critchley | 472 | 15.4 | +15.4% | |
Conservative | George Pratt | 391 | 12.7 | -10.0% | |
Majority | 1,739 | ||||
Turnout | 3,104 | 68.2 | |||
Party | Candidate | Votes | % | ± | |
---|---|---|---|---|---|
Conservative | David Westley | 1,554 | 46.4 | -13.5% | |
Labour | Charles Gains | 1,071 | 32.0 | -9.1% | |
UKIP | Jim Bevan | 497 | 14.8 | +14.8% | |
Green | Hannah James | 229 | 6.8 | +6.8% | |
Majority | 483 | ||||
Turnout | 3,366 | 74.4% | |||
Party | Candidate | Votes | % | ± | |
---|---|---|---|---|---|
Conservative | Marilyn Westley | 1,116 | 48.4 | -21.3% | |
Labour | Paul Hennessy | 818 | 35.5 | +5.2% | |
UKIP | David Gallagher | 373 | 16.2 | +16.2% | |
Majority | 298 | ||||
Turnout | 2,319 | 73.1 | |||
Party | Candidate | Votes | % | ± | |
---|---|---|---|---|---|
Labour | Paul Cotterill | 511 | 41.4 | -2.5% | |
Conservative | David Griffiths | 458 | 37.1 | -19.0% | |
UKIP | Ken Tyms | 150 | 12.2 | +12.2% | |
Our West Lancashire | Gordon Johnson | 115 | 9.3 | +9.3% | |
Majority | 53 | 4.3 | |||
Turnout | 1,234 | 75.2 | |||
Party | Candidate | Votes | % | ± | |
---|---|---|---|---|---|
Labour | Frank McKenna | 1,255 | 75.5 | -12.8% | |
UKIP | Damon Noone | 272 | 16.4 | +16.4% | |
Conservative | David Meadows | 135 | 8.1 | -3.6% | |
Majority | 983 | ||||
Turnout | 1662 | 58.2 | |||
Party | Candidate | Votes | % | ± | |
---|---|---|---|---|---|
Labour | Phill Hudson | 1,177 | 35.5 | -0.1% | |
Conservative | Edward McCarthy | 1,055 | 31.8 | -21.1% | |
Our West Lancashire | Ian Davis | 460 | 13.9 | +13.9% | |
Green | Heather Doyle | 323 | 9.7 | -1.9% | |
UKIP | Ray Brookfield | 302 | 9.1 | +9.1% | |
Majority | 122 | 3.7 | |||
Turnout | 3,323 | 69 | |||
Party | Candidate | Votes | % | ± | |
---|---|---|---|---|---|
Labour | Chris Wynn | 1,512 | 83.5 | -1.7% | |
Conservative | Richard Shepherd | 151 | 8.3 | -1.9% | |
Green | William Hite | 148 | 8.2 | +8.2% | |
Majority | 1,361 | ||||
Turnout | 1,820 | 61.2 | |||
Party | Candidate | Votes | % | ± | |
---|---|---|---|---|---|
Labour | Nikki Hennessy | 1,512 | 45.4 | +4.3% | |
Conservative | Rob Murrin-Bailey | 1,125 | 33.8 | -14.5% | |
UKIP | Tony Green | 316 | 9.5 | +9.5% | |
Green | Gaynor Pickering | 188 | 5.7 | -4.8% | |
Our West Lancashire | Peter Banks | 186 | 5.6 | +5.6% | |
Majority | 387 | 11.6 | |||
Turnout | 3,345 | 73.7 | |||
Party | Candidate | Votes | % | ± | |
---|---|---|---|---|---|
Conservative | Tom Blane | 1,026 | 50.5 | -14.5% | |
Labour | Andrew Pritchard | 586 | 28.8 | -6.2% | |
UKIP | Richard Smith | 420 | 20.7 | +20.7% | |
Majority | 440 | ||||
Turnout | 2,052 | 65.0 | |||
Party | Candidate | Votes | % | ± | |
---|---|---|---|---|---|
Conservative | May Blake | 1,412 | 60.5 | -7.4% | |
Labour | Clare Gillard | 761 | 32.6 | +0.5% | |
Green | Jai Brierley | 162 | 6.9 | +6.9% | |
Majority | 651 | ||||
Turnout | 2,347 | 77.8 | |||
Party | Candidate | Votes | % | ± | |
---|---|---|---|---|---|
Conservative | Charles Marshall | 1,190 | 55.1 | -11.7% | |
Labour | Margaret Blake | 525 | 24.3 | -8.9% | |
UKIP | David Massam | 345 | 16.0 | +16.0% | |
Green | John Watt | 100 | 4.6 | +4.6% | |
Majority | 665 | ||||
Turnout | 2,167 | 72.1 | |||
Party | Candidate | Votes | % | ± | |
---|---|---|---|---|---|
Labour | John Hodson | 1,189 | 39.5 | -6.6% | |
Conservative | William Weingart | 732 | 24.3 | -14.1% | |
Our West Lancashire | Jane Thompson | 578 | 19.2 | +19.2% | |
UKIP | Tom Shannon | 298 | 9.9 | +9.9% | |
Green | Maurice George | 212 | 7.0 | -1.4% | |
Majority | 457 | ||||
Turnout | 3,020 | 68.6 | |||
Party | Candidate | Votes | % | ± | |
---|---|---|---|---|---|
Labour | Jennifer Patterson | 1,623 | 84.7 | -0.3% | |
Conservative | Susan Janvier | 293 | 15.3 | +0.3% | |
Majority | 1,330 | ||||
Turnout | 1,947 | 67.3 | |||
Party | Candidate | Votes | % | ± | |
---|---|---|---|---|---|
Labour | Nicola Pryce-Roberts | 2,240 | 71.3 | +0.1% | |
Conservative | Jennifer Mayer | 451 | 14.4 | -7.1% | |
Our West Lancashire | Gerry Latham | 243 | 7.7 | +7.7% | |
Green | Martin Lowe | 207 | 6.6 | -0.7% | |
Majority | 1,789 | ||||
Turnout | 3,160 | 67.8 | |||
Party | Candidate | Votes | % | ± | |
---|---|---|---|---|---|
Labour | Maureen Nixon | 1,644 | 83.9 | +4.4% | |
Conservative | Amanda Shaw | 316 | 16.1 | -4.4% | |
Majority | 1,328 | ||||
Turnout | 1,988 | 58.0 | |||
Party | Candidate | Votes | % | ± | |
---|---|---|---|---|---|
Conservative | James Kay | 1,738 | 54.6 | -14.1% | |
Labour | Neil Pye | 544 | 17.1 | -14.2% | |
UKIP | Barry Gannaway-Jones | 482 | 15.1 | +25.1% | |
Independent | Jim Doran | 422 | 13.2 | +13.2% | |
Majority | 1,194 | ||||
Turnout | 3,197 | 70.5 | |||
Party | Candidate | Votes | % | ± | |
---|---|---|---|---|---|
Labour | John Bullock | 1,743 | 50.9 | -5.8% | |
Conservative | Ruth Pollock | 1,020 | 29.8 | -7.6% | |
UKIP | John Stewart | 661 | 19.3 | +19.3% | |
Majority | 723 | ||||
Turnout | 3,445 | 70.7 | |||
Party | Candidate | Votes | % | ± | |
---|---|---|---|---|---|
Conservative | Pam Baybutt | 1,334 | 55.3 | -9.8% | |
Green | Julie Hotchkiss | 744 | 30.8 | +30.8% | |
Labour | Sophia Hennessy | 335 | 13.6 | -21.3% | |
Majority | 590 | ||||
Turnout | 2,428 | 73.1 | |||
Blackburn with Darwen is a unitary authority area in Lancashire, North West England. It consists of Blackburn, the small town of Darwen to the south of it, and the surrounding countryside. The population of the Unitary Authority taken at the 2011 census was 147,489.
The Metropolitan Borough of Wigan is a metropolitan borough of Greater Manchester, in North West England. It is named after its largest component town and former county borough, Wigan and includes the towns and villages of Leigh, part of Ashton-in-Makerfield, Ince-in-Makerfield, Hindley, Orrell, Standish, Atherton, Tyldesley, Golborne, Lowton, Billinge, Astley, Haigh and Aspull. The borough was formed in 1974 and is an amalgamation of several former local government districts and parishes. The borough has three civil parishes and lies directly to the west of the City of Salford and southwest of the Metropolitan Borough of Bolton. The local authority is Wigan Metropolitan Borough Council.
Blackpool is a unitary authority in Lancashire, England. Until 1 April 1998 it was a non-metropolitan district.
Fylde Borough Council in Lancashire, England is elected every four years. 51 councillors are elected from 21 wards since the last boundary changes in 2003.
Blackburn with Darwen is a unitary authority in Lancashire, England. Until 1 April 1998 it was a non-metropolitan district.
The 1999 St Helens Metropolitan Borough Council election took place on 6 May 1999 to elect members of St Helens Metropolitan Borough Council in Merseyside, England. One third of the council was up for election and the Labour party stayed in overall control of the council.
The 2000 St Helens Metropolitan Borough Council election took place on 4 May 2000 to elect members of St Helens Metropolitan Borough Council in Merseyside, England. One third of the council was up for election and the Labour party stayed in overall control of the council.
One third of West Lancashire Borough Council in Lancashire, England is elected each year, followed by one year without election. Since the last boundary changes in 2002, 54 councillors have been elected from 25 wards.
One third of Rossendale Borough Council in Lancashire, England is elected each year, followed by one year where there is an election to Lancashire County Council instead.
The 1998 Burnley Borough Council election took place on 7 May 1998 to elect members of Burnley Borough Council in Lancashire, England. One third of the council was up for election and the Labour party stayed in overall control of the council.
The 2010 West Lancashire Borough Council election took place on 6 May 2010 to elect members of West Lancashire Borough Council in Lancashire, England. One third of the council was up for election and the Conservative party stayed in overall control of the council.
The 1998 Pendle Borough Council election took place on 7 May 1998 to elect members of Pendle Borough Council in Lancashire, England. One third of the council was up for election and the Liberal Democrats stayed in overall control of the council.
The 2007 Pendle Borough Council election took place on 3 May 2007 to elect members of Pendle Borough Council in Lancashire, England. One third of the council was up for election and the Liberal Democrats stayed in overall control of the council.
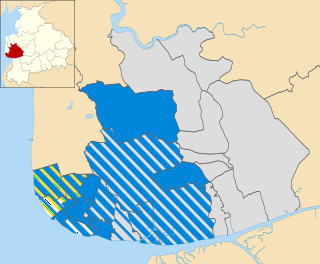
The 2011 Fylde Borough Council election took place on 5 May 2011 to elect members of Fylde Borough Council in Lancashire, England. The whole council was up for election and the Conservative party stayed in overall control of the council.
The 2012 West Lancashire Borough Council election took place on 3 May 2012 to elect members of West Lancashire Borough Council in Lancashire, England. One third of the council was up for election, with results compared to the corresponding vote in West Lancashire Council election, 2008.
The 2014 West Lancashire Borough Council election took place on 22 May 2014 to elect members of West Lancashire Borough Council in Lancashire, England, as part of the wider 2014 United Kingdom local elections and with the United Kingdom component of the 2014 European Parliament election on the same day. One third of the council is up for election.
The 2011 West Lancashire Borough Council election took place on 5 May 2011 to elect members of West Lancashire Borough Council in Lancashire, England. One third of the council was up for election, with results compared to the corresponding vote in West Lancashire Council election, 2007.
The 2015 Cheshire West and Chester Council election took place on 7 May 2015, electing members of Cheshire West and Chester Council in England. This was on the same day as other local elections across the country as well as the general election.
Elections to Burnley Borough Council in Lancashire, England were held on 7 May 2015, as part of the wider United Kingdom local elections, 2015.
The 2016 West Lancashire Borough Council election take place on 5 May 2016 to elect members of West Lancashire Borough Council in Lancashire, England. Following the 2015 local elections Labour Party (UK) took control of the council. A third of the seats were being polled during this election. Summary post election-