Warwick District Council election, 2015

Last updated

Elections to Warwick District Council took place on Thursday 7 May 2015, with votes counted and declared on Saturday 9 May 2015.

Contents

A total of 46 seats were up for election, all councillors from all wards. The previous elections produced a majority for the Conservative Party. The boundaries of many of the wards across the District were changed from the previous election.

Conservative Party (UK) Political party in the United Kingdom

The Conservative Party, officially the Conservative and Unionist Party, is a centre-right political party in the United Kingdom. The governing party since 2010, it is the largest in the House of Commons, with 313 Members of Parliament, and also has 249 members of the House of Lords, 18 members of the European Parliament, 31 Members of the Scottish Parliament, 12 members of the Welsh Assembly, eight members of the London Assembly and 8,916 local councillors.

Election result

Warwick District Council Election, 2015
PartySeatsGainsLossesNet gain/lossSeats %Votes %Votes+/−
  Conservative 31 8 2 +6 67.4% 43.3% 32,645 +2.5%
  Labour 9 3 2 +1 19.6% 22.7% 17,114 -2.4%
  Green 1 1 0 +1 2.17% 13.4% 10,102 +2.2%
  Liberal Democrat 2 0 7 -7 4.35% 13.1% 9,876 -4.7%
  Whitnash Residents 3 0 0 ±0 6.52% 3.7% 2,789 -0.5%
  UKIP 0 0 0 ±0 0.0% 2.3% 1,734 +1.9%
  Independent 0 0 1 -1 0.0% 1.4%% 1,055 +0.8%

Ward results

Abbey Ward (3 Councillors)
PartyCandidateVotes%±
Conservative Michael Francis Coker 1,851 15.1% -1.7%
Conservative George Reginald Illingworth 1,803 14.7% -1.0%
Conservative Rowena Hill 1,693 13.8% -0.4%
Liberal Democrat Kate Dickson 1,360 11.1% -4.8%
Liberal Democrat Andy Tulloch 1,060 8.6% -2.6%
Liberal Democrat Alison Rita Margaret Tyler 977 8.0% -2.7%
Labour Josh Payne 943 7.7% +2.5%
Green John Alfred Dearing 668 5.4% +0.4%
Green Janice Eleanor Austin 665 5.4% +2.7%
UKIP Susan Mabel Katherine Eva Chambers 614 5.0%N/A
Green Ayla Claire Nickels 488 4.0% +1.6%
TUSC Non Frenguelli 156 1.3%N/A
Majority 333 7.2% +6.3%
Turnout 12,278 72.7%
Conservative hold Swing
Conservative gain from Liberal Democrat Swing
Arden Ward (2 Councillors)
PartyCandidateVotes%±
Conservative Sue Gallagher 2,777 46.0% -33.5%
Conservative Peter Whiting 2,261 37.5% -44.5%
Green Julia Sokota 503 8.3% -2.2%
Green Avnash Jhita 503 8.1% -9.9%
Majority 1,758 29.1% -37.4%
Turnout 6,032 78.0%
Conservative hold Swing
Aylesford Ward (2 Councillors)
PartyCandidateVotes%±
Conservative Noel Stephen Butler 1,746 29.3% +15.0%
Conservative Martyn Geoffrey Ashford 1,506 25.3% +11.1%
Labour Roger William Smith 914 15.4% +1.5%
Labour Raj Randev 870 14.6% +1.4%
Green James Christopher Myles Alty 341 5.7% +2.1%
Liberal Democrat Deborah Jane Pittarello 300 5.0% +1.0%
Green Thomas Merlin Ingall 277 4.6% +2.3%
Majority 592 17.6% +17.4%
Turnout 5,954 69.1%
Conservative hold Swing
Bishop's Tachbrook Ward (1 Councillor)
PartyCandidateVotes%±
Conservative Andrew John William Day 846 53.1% +5.6%
Labour Jane Naylor 364 22.8% +0.3%
Independent Lyn Rees Day-Jones 296 18.6%N/A
Green Bruce Simon Knight 87 5.5% -0.1%
Majority 482 30.0% +5.0%
Turnout 1593 76.2%
Conservative hold Swing
Brunswick Ward (2 Councillors)
PartyCandidateVotes%±
Green Ian William Davison 1,264 22.3% +13.6%
Labour Kristie Naimo 1,181 20.8% +5.2%
Green Jonathan Chilvers 1,146 20.2% +11.7%
Labour Alan Wilkinson 854 15.0% +0.2%
Conservative Charles Barclay 524 9.2% +1.9%
Conservative Will Jackson 521 9.2% +2.8%
Liberal Democrat Moh Ahson 189 3.3% +1.7%
Majority 35 0.6% +0.3%
Turnout
Green gain from Labour Swing
Labour hold Swing
Budbrooke Ward (2 Councillors)
PartyCandidateVotes%±
Conservative Alan Bertrand Rhead 2,332 34.0% +1.7%
Conservative Peter Phillips 2,057 30.0% -0.8%
Labour Emma Samantha Mort 802 11.7% +0.0%
UKIP Scott Wilson 569 8.3%N/A
Labour Christopher Glyn Wrench 492 7.2% -1.5%
Green Nicholas James Standish Brierley 311 4.5% +0.0%
Green Bernie McCullagh 305 4.4% +2.2%
Majority 1,255 32.1% +30.6%
Turnout 6,868 80.2%
Conservative hold Swing
Clarendon Ward (2 Councillors)
PartyCandidateVotes%±
Conservative Caroline Evetts 1,029 18.5% +3.1%
Labour Jane Margaret Knight 937 16.8% -2.1%
Conservative Alexander Shaw 835 15.0% +1.2%
Labour Jerry Weber 722 13.0% -4.5%
Liberal Democrat Nick Pittarello 713 12.8% -0.1%
Liberal Democrat David Peter James Robertson 500 9.0% -0.9%
Green Tony Ross 471 8.5% +2.7%
Green Rob van Schie 360 6.5% +2.5%
Majority 102 1.8% +0.4%
Turnout 5,567 65.3%
Conservative gain from Labour Swing
Labour hold Swing
Crown Ward (2 Councillors)
PartyCandidateVotes%±
Liberal Democrat Alan Boad 1,074 18.7% -6.2%
Labour Stef Parkins 935 16.3% -1.6%
Labour John Howell 905 15.8% -1.1%
Liberal Democrat Nick Solman 781 13.6% -6.3%
Conservative Georgina Stockley 608 10.6% +1.3%
Conservative Andrew Ian Phillips 590 10.3% +3.0%
UKIP Sam Turner 379 6.6%N/A
Green Juliet Carter 236 4.1% +1.4%
Green Angela Owen 235 4.1% +2.9%
Majority 30 0.5% -4.8%
Turnout 5,743 63.9%
Liberal Democrat hold Swing
Labour gain from Liberal Democrat Swing
Emscote Ward (2 Councillors)
PartyCandidateVotes%±
Conservative Richard Edgington 1,386 26.7% +13.0%
Labour Jackie D'Arcy 1009 19.4% +8.7%
Labour Raj Kang 805 15.5% +4.8%
UKIP Martin Mackenzie 606 11.7% 9.4%
Green David Cumner 523 10.1% +5.2%
Liberal Democrat Geoffrey Stewart Harris 513 9.9%N/A
Green Matt Swift 351 6.8% 1.9%
Majority 204 3.9% +2.5%
Turnout 5,193 68.0%
Conservative hold Swing
Labour hold Swing
Leam Ward (2 Councillors)
PartyCandidateVotes%±
Labour Colin Quinney 1,050 20.8% +3.2%
Labour Barbara Weed 1,049 20.8% +4.2%
Conservative Jackie David 842 16.6% +8.1%
Conservative Jack McCann 776 15.4% +7.2%
Green Ayla Nickels 697 13.8% +8.5%
Green Azzees Dee Minott 642 12.7% +8.6%
Majority 207 4.1% +3.1%
Turnout 5,056 67.3%
Labour hold Swing
Labour hold Swing
Manor Ward (2 Councillors)
PartyCandidateVotes%±
Conservative Amanda Marjorie Stevens 1,542 21.9% +10.9%
Conservative Gordon Harry Cain 1,339 19.0% +7.6%
Liberal Democrat Cymone Katherine De-Lara Bond 1,190 16.9% +2.2%
Liberal Democrat Heather Mary Calver 984 14.0% 0.0%
Labour Sue Eades 780 11.1% +5.1%
Labour Ron Stone 572 8.1% +2.2%
Green Christopher John Philpott 324 4.6% +1.5%
Green Felicity Rock 303 4.3% +1.4%
Majority 149 2.1% +1.4%
Turnout 7,034 75.4%
Conservative gain from Liberal Democrat Swing
Milverton Ward (2 Councillors)
PartyCandidateVotes%±
Liberal Democrat Bill Gifford 1,523 23.4% +7.7%
Conservative Hayley Grainger 1,141 17.6% +7.2%
Liberal Democrat David George Wigman 1,015 15.6% +3.3%
Conservative John Stanley Hammon 827 12.7% +2.6%
Labour Helen McCabe 717 11.0% +3.8%
Labour Catherine Anne Stephens 620 9.5% +2.7%
Green Martin Atkin 432 6.6% +1.8%
Green Caz Ingall 227 3.5% +0.4%
Majority 126 1.9% -1.5%
Turnout 6,502 75.1%
Liberal Democrat hold Swing
Conservative gain from Liberal Democrat Swing
Myton & Heathcote Ward (2 Councillors)
PartyCandidateVotes%±
Conservative Neale Murphy 1,286 25.9% +8.0%
Conservative Raj Mann 1,252 25.2% +8.0%
Independent Anne Monica Mellor 440 8.9%N/A
Liberal Democrat Kelvin Howard Lambert 431 8.7% +5.1%
Green Juliet Anne Nickels 427 8.6% +4.0%
Green Richard John Brayne 383 7.7% +4.4%
UKIP Tim Griffiths 374 7.5%N/A
Independent Linda Bromley 370 7.5%N/A
Majority 812 16.4% +15.7%
Turnout 4,963 75.6%
Conservative hold Swing
Newbold Ward (2 Councillors)
PartyCandidateVotes%±
Conservative Andrew Thompson 1,197 19.5% +8.6%
Conservative Daniel John Howe 1,160 18.9% +10.3%
Labour Janice Louise Dean 860 14.0% +7.7%
Labour Pip Burley 846 13.8% +8.4%
Liberal Democrat Carolyn Patricia Gifford 661 10.8% -2.8%
Liberal Democrat Simon Wheeler 623 10.2% -1.7%
Green Judith Helen Barrett 397 6.5% +3.7%
Green Clare Louise Phillips 394 6.4% +4.1%
Majority 300 4.9% +2.3%
Turnout 6,138 72.1%
Conservative gain from Liberal Democrat Swing
Park Hill Ward (3 Councillors)
PartyCandidateVotes%±
Conservative Dave Shilton 2,643 19.6% -0.4%
Conservative Felicity Bunker 2,520 18.7% +0.3%
Conservative Andrew Mobbs 2,436 18.1% +0.4%
Labour Jeremy Eastaugh 964 7.2% -0.5%
Labour Caryll Green 756 5.6% -0.2%
Labour Elizabeth Ann Saxon 717 5.3%N/A
Liberal Democrat Lynn Annette Pollard 668 5.0% -2.2%
Liberal Democrat Andy Brierley 659 4.9% -1.1%
Green James Nicholas Harrison 591 4.4% -0.9%
Liberal Democrat Ian Malcolm Fenwick 574 4.3% -1.5%
Green Pam Lunn 519 3.8% +0.3%
Green George Martin 439 3.3% +0.7%
Majority 1,472 10.9% +9.3%
Turnout 13,486 74.2%
Conservative hold Swing -0.4%
Conservative hold Swing +0.3%
Conservative hold Swing +0.4%
Radford Semele Ward (1 Councillor)
PartyCandidateVotes%±
Conservative Michael Doody 1,019 63.0% +7.6%
Labour Kevin Walsh 378 21.6% +1.8%
Green Rebecca Elizabeth Knight 220 9.8% +3.8%
Majority 641 39.6% +5.8%
Turnout 1,617 75.2%
Conservative hold Swing +7.6%
Saltisford Ward (2 Councillors)
PartyCandidateVotes%±
Conservative Terry John Morris 1,582 24.9% +8.0%
Labour John-Paul Bromley 1,214 19.1% +7.3%
Conservative Bala Jaspal 1,070 16.9% +2.4%
Labour John Paul Sullivan 1,034 16.3% +7.3%
Liberal Democrat Anthony Butcher 575 9.1% +6.2%
Green Alison Jane Browne 502 7.9% +5.7%
Green James Barrett 369 5.8% +2.9%
Majority 144 2.3%
Turnout 6,346 67.4%
Conservative hold Swing +8.0%
Labour gain from Conservative Swing +4.9%
St. John's Ward (3 Councillors)
PartyCandidateVotes%±
Conservative Richard Davies 2,488 18.1% +0.1%
Conservative Pat Cain 2,463 17.9% +1.3%
Conservative John Cooke 2,453 17.8% +1.6%
Liberal Democrat Richard Guy Dickson 1,132 8.2% +0.9%
Liberal Democrat Gill Palmer 974 7.1% 0.0%
Labour Richard Thomas Grimes 792 5.8% -1.3%
Labour Nick Hoten 698 5.1% -1.9%
Labour Peter Joseph Shiels 673 4.9% -1.8%
Green Pippa Austin 632 4.6% -0.4%
Liberal Democrat John Steven Wilson 632 4.6% -0.7%
Green James Connor Ablett 512 3.7% +1.8%
Green Andrew John Patrick 309 2.2% +0.4
Majority 1,321 9.6% +8.2
Turnout 13,758 72.7%
Conservative hold Swing +0.1%
Conservative hold Swing +1.3%
Conservative hold Swing +1.6%
Stoneleigh & Cubbington Ward (2 Councillors)
PartyCandidateVotes%±
Conservative Nick Harrington 1,390 26.3% -7.1%
Conservative Pam Redford 1,177 22.3% -10.0%
Independent David Alan Ellwood 1,039 19.6%N/A
Labour John Harrow Roberts 614 11.6% -5.0%
Green Gareth John Davies 468 8.8% -3.4%
Labour Fiona Margaret Walsh 376 7.1%N/A
Green Colin Maddison Hughes 224 4.2% -1.3%
Majority 138 2.6% +1.5%
Turnout 5,288 75.0%
Conservative hold Swing
Sydenham Ward (2 Councillors)
PartyCandidateVotes%±
Labour John Thomas Barrott 1,262 25.1% +8.7%
Labour Balvinder Gill 1,249 24.8% +8.9%
Conservative Elliott James Mason 828 16.5% +8.4%
Conservative Rachel Willis 786 15.6% +6.3%
Green Derrick Garth Knight 492 9.8% +1.9%
Green Peggy Wiseman 412 8.2% +4.2%
Majority 421 8.4%
Turnout 5,029 58.9%
Labour hold Swing +8.7%
Labour hold Swing +8.9%
Whitnash Ward (3 Councillors)
PartyCandidateVotes%±
Whitnash Residents Judith Ann Falp 1,941 15.2% -8.5%
Whitnash Residents Tony Heath 1,851 14.6% -5.3%
Whitnash Residents Robert Leslie Margrave 1,646 12.9% -6.7%
Labour William David Clemmey 1,374 10.8% +3.3%
Conservative Christine Brenda Cross 1,078 8.5% +3.1%
Labour Sarah Campbell 1,036 8.1% +1.4%
Conservative Thomas Raynor 988 7.8% +2.8%
Labour Tim Naylor 954 7.5% +2.4%
Conservative David Wyatt 886 7.0%N/A
Green Eloise Rhianon Chilvers 375 3.0% +0.3%
Green Sue Tucker 363 2.8% +0.4%
Green Stan Shire 232 1.8% -0.2%
Majority 272 2.1% -1.7%
Turnout 12,724 68.5%
Whitnash Residents hold Swing
Woodloes Ward (2 Councillors)
PartyCandidateVotes%±
Conservative Stephen Cross 1,400 26.3% +9.7%
Conservative Moira-Ann Grainger 1,206 22.6% +7.0%
Labour Daniel Browne 766 14.4% +2.8%
Labour Alec Roberts 602 11.3% -0.2%
UKIP Jayne Macbrayne 474 8.9% +6.1%
UKIP Alastair Macbrayne 327 6.1%N/A
Liberal Democrat Alan Charles Beddow 261 4.9%N/A
Green Graham Paul Meredith Browne 173 3.2% -2.4%
Green Andy Stevenson 121 2.3% -3.0%
Majority 440 8.3% +7.9%
Turnout 5,330 69.2%
Conservative hold Swing

Related Research Articles

Milton Keynes is a unitary authority in Buckinghamshire, England. Until 1 April 1997 it was a non-metropolitan district.

2011 South Norfolk District Council election

The elections to South Norfolk District Council were held on Thursday 5 May 2011 along with various other local elections around England, elections to the Scottish Parliament, National Assembly of Wales and Northern Ireland Assembly, and a referendum on whether to adopt the Alternative Vote electoral system for elections to the House of Commons. All 46 council seats were up for election. The previous council was controlled by the Conservatives, with the Liberal Democrats being the only opposition.

The first elections to Pembrokeshire County Council was held on 4 May 1995. It was followed by the 1999 election. On the same day there were elections to the other 21 local authorities in Wales and community councils in Wales.

Elections to Pembrokeshire County Council were held on 6 May 1999. It was preceded by the 1995 election and followed by the 2004 election. On the same day there were the first elections to the Welsh Assembly and elections to the other 21 local authorities in Wales and community councils in Wales.

The 1964 Barnet Council election took place on 7 May 1964 to elect members of Barnet London Borough Council in London, England. The whole council was up for election and the Conservative party gained control of the council.

2015 South Norfolk District Council election

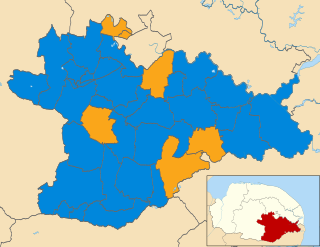
The 2015 South Norfolk District Council election was held on Thursday 7 May 2015 to elect the whole council as part of United Kingdom local elections, 2015 coinciding with the general election. The council continued to consist of 46 councillors and as immediately after the previous election, the council was controlled by local Conservatives, with local Liberal Democrats being the only opposition. The governing group's numbers were augmented by two councillors at the expense of that opposition group. Three defecting-from-majority independent councillors lost their council seats.

The 1964 Hounslow Council election took place on 7 May 1964 to elect members of Hounslow London Borough Council in London, England. The whole council was up for election and the Labour party gained control of the council.

The 1964 Croydon Council election took place on 7 May 1964 to elect members of Croydon London Borough Council in London, England. The whole council was up for election and the council went into no overall control.

2015 City of York Council election

The 2015 City of York Council election took place on 7 May 2015 to elect members of City of York Council in England. The whole council was up for election. Turnout was substantially up across the city due to the election being held on the same day as the general election and other local elections in England.

2015 Breckland District Council election

The 2015 Breckland District Council election took place on 7 May 2015 to elect members of Breckland District Council in England. This was on the same day as other local elections.

Elections to Cannock Chase District Council took place on 7 May 2015, in line with other local elections in the United Kingdom which were held on the same day as the general election. A total of 15 councillors were elected from all 15 of the council's wards as a third of the council was up for election.

Elections to elect all members of the North West Leicestershire District Council took place on 7 May 2015, simultaneously with a general election, held as one of the English local elections of that year.

2015 Sedgemoor District Council election

The 2015 Sedgemoor District Council election took place on Thursday 7 May 2015 as a four-yearly election to elect all members (councillors) of Sedgemoor District Council in the English county of Somerset. The principal town in the district is Bridgwater accounting for 15 of the 48 councillors elected. The election was part of the United Kingdom local elections, 2015 which were held simultaneously with the 2015 General Election.

2015 South Oxfordshire District Council election

The 2015 South Oxfordshire District Council election was held on 7 May 2015 to elect members of South Oxfordshire District Council in England. This was on the same day as other local elections.

2015 South Kesteven District Council election

The 2015 South Kesteven District Council election took place on 7 May 2015 to elect members of South Kesteven District Council in Lincolnshire, England. The whole council was up for election after boundary changes reduced the number of seats by two. The Conservative party stayed in overall control of the council.

2015 Wychavon District Council election

The 2015 Wychavon District Council election took place on 7 May 2015 to elect members of Wychavon District Council in Worcestershire, England. The whole council was up for election and the Conservative party stayed in overall control of the council.

2014 West Oxfordshire District Council election

The 2014 West Oxfordshire District Council election took place on 22 May 2014 to elect members of West Oxfordshire District Council in Oxfordshire, England. One third of the council was up for election and the Conservative party stayed in overall control of the council.

2016 Cannock Chase District Council election

Elections to Cannock Chase District Council took place on 5 May 2016. This election was held on the same day as other local elections as well as Police and Crime Commissioner elections. A total of 13 councillors were elected from all but two of the council's wards as a third of the council was up for election.

Elections to Cannock Chase District Council took place on 3 May 2018 on the same day as other local elections in England. A third of the council was up for election, meaning a total of 13 councillors were elected from all but two of the council's wards.

The 2019 Bassetlaw District Council election is due to take place on 2 May 2019 to elect all 48 members of Bassetlaw District Council in England. This will be on the same day as other local elections.

References