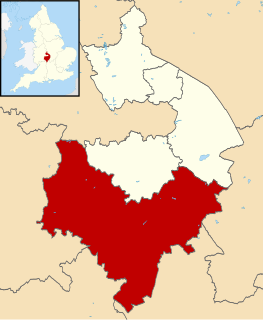
The 2004 Stratford-on-Avon District Council election took place on 10 June 2004 to elect members of Stratford-on-Avon District Council in Warwickshire, England. One third of the council was up for election and the Conservative party stayed in overall control of the council. [1]
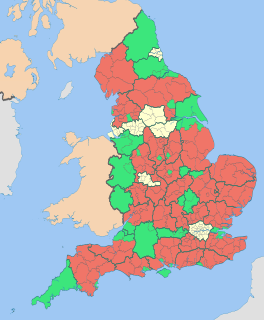
Non-metropolitan districts, or colloquially "shire districts", are a type of local government district in England. As created, they are sub-divisions of non-metropolitan counties in a two-tier arrangement.
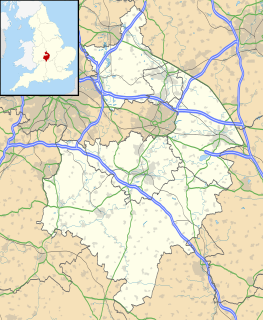
Warwickshire is a landlocked county in the West Midlands region of England. The county town is Warwick, although the largest town is Nuneaton. The county is famous for being the birthplace of William Shakespeare.
England is a country that is part of the United Kingdom. It shares land borders with Wales to the west and Scotland to the north-northwest. The Irish Sea lies west of England and the Celtic Sea lies to the southwest. England is separated from continental Europe by the North Sea to the east and the English Channel to the south. The country covers five-eighths of the island of Great Britain, which lies in the North Atlantic, and includes over 100 smaller islands, such as the Isles of Scilly and the Isle of Wight.
After the election, the composition of the council was
The Conservative Party, officially the Conservative and Unionist Party, is a centre-right political party in the United Kingdom. Presently led by Theresa May, it has been the governing party since 2010. It presently has 314 Members of Parliament in the House of Commons, 249 members of the House of Lords, and 18 members of the European Parliament. It also has 31 Members of the Scottish Parliament, 12 members of the Welsh Assembly, eight members of the London Assembly and 9,008 local councillors. One of the major parties of UK politics, it has formed the government on 45 occasions, more than any other party.
The Liberal Democrats are a liberal, centrist political party in the United Kingdom. They presently have 11 Members of Parliament in the House of Commons, 96 members of the House of Lords, and one member of the European Parliament. They also have five Members of the Scottish Parliament and a member each in the Welsh Assembly and London Assembly. The party reached the height of its influence in the early 2010s, forming a junior partner in a coalition government from 2010 to 2015. It is presently led by Vince Cable.
19 of the 53 seats on the council were contested in the election. [3] The Conservatives were defending 11 of the seats and this was seen as giving the Liberal Democrats a chance at taking over control of the council, [3] which had a one-seat Conservative majority before the election. [4] Meanwhile, Labour had their only remaining council seat up for election in Southam ward, leading to the possibility that they could fail to be represented on the council after the election. [3]
The Labour Party is a centre-left political party in the United Kingdom which has been described as an alliance of social democrats, democratic socialists and trade unionists. The party's platform emphasises greater state intervention, social justice and strengthening workers' rights. Labour is a full member of the Party of European Socialists and Progressive Alliance, and holds observer status in the Socialist International. As of 2017, the party was considered the "largest party in Western Europe" in terms of party membership, with more than half a million members.
Southam is a small market town and civil parish in the Stratford-on-Avon district of Warwickshire, England. Southam is on the River Stowe, which flows from Napton-on-the-Hill and joins Warwickshire's River Itchen at Stoneythorpe, just outside the town. The town is about 7 1⁄2 miles (12 km) east of Leamington Spa, about 10 miles (16 km) from Rugby and Daventry, 13 miles (21 km) south of Coventry and 14 miles (23 km) north of Banbury.
The results saw the Conservatives strengthen their majority on the council up to 7 seats. [5] They gained 4 seats in Harbury, Southam, Stratford Guild and Hathaway and Wellesbourne wards and only suffered 1 loss to the Liberal Democrats in Studley. [5] While the Liberal Democrats lost ground as a result, the defeat in Southam meant Labour was no longer represented on the council. [6] [7]
Harbury is a village and civil parish in the Stratford-on-Avon district of Warwickshire, England. It is about 3 miles (5 km) west-southwest of Southam and about 5 miles (8 km) southeast of Royal Leamington Spa. The parish includes the hamlet of Deppers Bridge. The 2011 Census recorded the parish's population as 2,420.
Wellesbourne is a large village in the civil parish of Wellesbourne and Walton, in the county of Warwickshire, in the West Midlands region of the UK. In the 2001 census the parish, which also includes the village of Walton, had a population of 5,691. In 2011 the population was measured at 5,849. The civil parish was renamed from Wellesbourne to Wellesbourne and Walton in 1 April 2014.
Studley is a large village and civil parish in the Stratford-on-Avon district of Warwickshire, England. Situated on the western edge of Warwickshire near the border with Worcestershire it is 4 miles (6 km) southeast of Redditch and 13 miles (21 km) northwest of Stratford-upon-Avon. The Roman road of Ryknild Street, now the A435, passes through the village on its eastern edge, parallel to the River Arrow. The name derives from the Old English leah, being a meadow or pasture, where horses, stod, are kept.
The Conservatives said they were pleased with the results, that saw them win almost half of the vote, and which they put down to a strong positive campaign. [8] Overall turnout in the election was higher than the national average at 43.5%. [9]
Voter turnout is the percentage of eligible voters who cast a ballot in an election. Eligibility varies by country, and the voting-eligible population should not be confused with the total adult population. Age and citizenship status are often among the criteria used to determine eligibility, but some countries further restrict eligibility based on sex, race, or religion.
Party | Seats | Gains | Losses | Net gain/loss | Seats % | Votes % | Votes | +/− | |
---|---|---|---|---|---|---|---|---|---|
Conservative | 14 | 4 | 1 | +3 | 73.7 | 49.9 | 14,264 | +10.3% | |
Liberal Democrat | 4 | 1 | 3 | -2 | 21.1 | 39.2 | 11,192 | -6.3% | |
Independent | 1 | 0 | 0 | 0 | 5.3 | 6.2 | 1,780 | -4.3% | |
Labour | 0 | 0 | 1 | -1 | 0 | 4.7 | 1,347 | +0.6% |
Party | Candidate | Votes | % | ± | |
---|---|---|---|---|---|
Liberal Democrat | Clifford Meade | 1,054 | 57.6 | -1.7 | |
Conservative | Maurice Abney-Hastings | 665 | 36.4 | -4.3 | |
Labour | Matthew Stephens | 110 | 6.0 | +6.0 | |
Majority | 389 | 21.3 | +2.7 | ||
Turnout | 1,829 | 39.8 | +2.7 | ||
Liberal Democrat hold | Swing |
Party | Candidate | Votes | % | ± | |
---|---|---|---|---|---|
Conservative | William Lawrence | 479 | 61.1 | +6.0 | |
Liberal Democrat | Shahid Juned | 305 | 38.9 | -6.0 | |
Majority | 174 | 22.2 | +12.0 | ||
Turnout | 784 | 52.9 | |||
Conservative hold | Swing |
Party | Candidate | Votes | % | ± | |
---|---|---|---|---|---|
Conservative | John Winterburn | 435 | 64.9 | +4.7 | |
Liberal Democrat | John Insoll | 235 | 35.1 | +3.8 | |
Majority | 200 | 29.9 | +1.0 | ||
Turnout | 670 | 43.0 | |||
Conservative hold | Swing |
Party | Candidate | Votes | % | ± | |
---|---|---|---|---|---|
Independent | Kim James | 997 | 56.0 | +56.0 | |
Independent | John Sandle | 783 | 44.0 | +44.0 | |
Majority | 214 | 12.0 | |||
Turnout | 1,780 | 36.0 | +8.5 | ||
Independent hold | Swing |
Party | Candidate | Votes | % | ± | |
---|---|---|---|---|---|
Conservative | Simon Jackson | 536 | 65.8 | -4.4 | |
Liberal Democrat | Sarah Evans | 279 | 34.2 | +4.4 | |
Majority | 257 | 31.5 | -8.9 | ||
Turnout | 815 | 49.6 | |||
Conservative hold | Swing |
Party | Candidate | Votes | % | ± | |
---|---|---|---|---|---|
Conservative | Jane Harrison | 625 | 73.3 | -8.5 | |
Liberal Democrat | Jeanne Lowe | 228 | 26.7 | +8.5 | |
Majority | 397 | 46.5 | -17.1 | ||
Turnout | 853 | 47.3 | |||
Conservative hold | Swing |
Party | Candidate | Votes | % | ± | |
---|---|---|---|---|---|
Conservative | Isobel Seccombe | 578 | 65.4 | +9.8 | |
Liberal Democrat | Adrian Brabyn | 306 | 34.6 | -9.8 | |
Majority | 272 | 30.8 | +19.6 | ||
Turnout | 884 | 49.7 | |||
Conservative hold | Swing |
Party | Candidate | Votes | % | ± | |
---|---|---|---|---|---|
Conservative | Eric Dally | 847 | 52.4 | ||
Liberal Democrat | Jean Booth | 770 | 47.6 | ||
Majority | 77 | 4.8 | |||
Turnout | 1,617 | 43.4 | |||
Conservative gain from Liberal Democrat | Swing | ||||
Party | Candidate | Votes | % | ± | |
---|---|---|---|---|---|
Conservative | Stephen Thirlwell | 1,052 | 70.3 | +12.4 | |
Liberal Democrat | Mark Edwards | 444 | 29.7 | -12.4 | |
Majority | 608 | 40.6 | +24.8 | ||
Turnout | 1,496 | 43.4 | +10.7 | ||
Conservative hold | Swing |
Party | Candidate | Votes | % | ± | |
---|---|---|---|---|---|
Liberal Democrat | Alan Higgs | 920 | 58.9 | +6.7 | |
Conservative | Richard Hurley | 643 | 41.1 | -6.7 | |
Majority | 277 | 17.7 | +13.2 | ||
Turnout | 1,563 | 47.2 | +6.7 | ||
Liberal Democrat hold | Swing |
Party | Candidate | Votes | % | ± | |
---|---|---|---|---|---|
Conservative | Trevor Russell | 897 | 53.6 | +10.7 | |
Liberal Democrat | Stephen Troup | 778 | 46.4 | -10.7 | |
Majority | 119 | 7.1 | |||
Turnout | 1,675 | 45.3 | +2.3 | ||
Conservative hold | Swing |
Party | Candidate | Votes | % | ± | |
---|---|---|---|---|---|
Conservative | John Appleton | 774 | 47.3 | +5.2 | |
Labour | James Taylor | 632 | 38.7 | -2.6 | |
Liberal Democrat | Stuart Ritchie | 229 | 14.0 | -2.6 | |
Majority | 142 | 8.7 | +7.9 | ||
Turnout | 1,635 | 33.2 | +1.8 | ||
Conservative gain from Labour | Swing | ||||
Party | Candidate | Votes | % | ± | |
---|---|---|---|---|---|
Conservative | Lynda Organ | 1,162 | 56.7 | +13.0 | |
Liberal Democrat | Joan McFarlane | 886 | 43.3 | +6.3 | |
Majority | 276 | 13.5 | +6.8 | ||
Turnout | 2,048 | 49.1 | +7.4 | ||
Conservative hold | Swing |
Party | Candidate | Votes | % | ± | |
---|---|---|---|---|---|
Conservative | Juliet Short | 939 | 52.3 | +27.9 | |
Liberal Democrat | Ronald Tredwell | 684 | 38.1 | +2.3 | |
Labour | Karen Parnell | 172 | 9.6 | +5.6 | |
Majority | 255 | 14.2 | |||
Turnout | 1,795 | 36.4 | +2.3 | ||
Conservative hold | Swing |
Party | Candidate | Votes | % | ± | |
---|---|---|---|---|---|
Conservative | Michael Perry | 1,169 | 49.9 | +18.6 | |
Liberal Democrat | William Dowling | 981 | 41.8 | +4.2 | |
Labour | Doreen Wright | 195 | 8.3 | +0.9 | |
Majority | 188 | 8.0 | |||
Turnout | 2,345 | 43.2 | +5.3 | ||
Conservative gain from Liberal Democrat | Swing | ||||
Party | Candidate | Votes | % | ± | |
---|---|---|---|---|---|
Liberal Democrat | Charles Bates | 756 | 62.9 | +2.3 | |
Conservative | Laura Main | 359 | 29.9 | +29.9 | |
Labour | Ewan Wainwright | 86 | 7.2 | +2.6 | |
Majority | 397 | 33.1 | +7.3 | ||
Turnout | 1,201 | 36.4 | -1.4 | ||
Liberal Democrat hold | Swing |
Party | Candidate | Votes | % | ± | |
---|---|---|---|---|---|
Liberal Democrat | Paul Beaman | 972 | 50.5 | -7.7 | |
Conservative | William McCarthy | 802 | 41.6 | -0.2 | |
Labour | Michael Gerrard | 152 | 7.9 | +7.9 | |
Majority | 170 | 8.8 | -7.6 | ||
Turnout | 1,926 | 42.2 | +12.0 | ||
Liberal Democrat gain from Conservative | Swing | ||||
Party | Candidate | Votes | % | ± | |
---|---|---|---|---|---|
Conservative | Mark Flower | 1,037 | 81.7 | ||
Liberal Democrat | Karyl Rees | 233 | 18.3 | ||
Majority | 804 | 63.3 | |||
Turnout | 1,270 | 41.9 | |||
Conservative hold | Swing |
Party | Candidate | Votes | % | ± | |
---|---|---|---|---|---|
Conservative | Anita MacAulay | 1,265 | 52.8 | +17.8 | |
Liberal Democrat | Priscilla Cook | 1,132 | 47.2 | +6.4 | |
Majority | 133 | 5.5 | |||
Turnout | 2,397 | 45.7 | +6.7 | ||
Conservative gain from Liberal Democrat | Swing | ||||
Stratford-on-Avon is a local government district of southern Warwickshire in England.
The 2002 Redditch Borough Council election of 2 May 2002 elected members of Redditch Borough Council in the West Midlands region, England. One third of the council stood for re-election and the Labour party lost overall control of the council to no overall control for the first time in many years.
The 2004 St Albans City and District Council election took place on 10 June 2004 to elect members of St Albans District Council in Hertfordshire, England. One third of the council was up for election and the council stayed under no overall control.
The 2002 Wyre Forest District Council election took place on 2 May 2002 to elect members of Wyre Forest District Council in Worcestershire, England. One third of the council was up for election and the Independent Kidderminster Hospital and Health Concern party gained overall control of the council from no overall control.
The 2002 Worcester City Council election took place on 2 May 2002 to elect members of Worcester District Council in Worcestershire, England. One third of the council was up for election and the council stayed under no overall control.
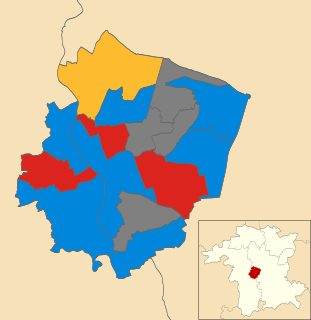
The 2007 Worcester City Council election took place on 3 May 2007 to elect members of Worcester District Council in Worcestershire, England. One third of the council was up for election and the Conservative party stayed in overall control of the council.
The 2004 Welwyn Hatfield District Council election took place on 10 June 2004 to elect members of Welwyn Hatfield District Council in Hertfordshire, England. One third of the council was up for election and the Conservative party stayed in overall control of the council.
The 1998 Stratford-on-Avon District Council election took place on 7 May 1998 to elect members of Stratford-on-Avon District Council in Warwickshire, England. One third of the council was up for election and the council stayed under no overall control.
The 1999 Stratford-on-Avon District Council election took place on 6 May 1999 to elect members of Stratford-on-Avon District Council in Warwickshire, England. One third of the council was up for election and the council stayed under no overall control.
The 2000 Stratford-on-Avon District Council election took place on 4 May 2000 to elect members of Stratford-on-Avon District Council in Warwickshire, England. One third of the council was up for election and the Conservative party gained overall control of the council from no overall control.
The 2002 Stratford-on-Avon District Council election took place on 2 May 2002 to elect members of Stratford-on-Avon District Council in Warwickshire, England. The whole council was up for election with boundary changes since the last election in 2000 reducing the number of seats by 2. The Conservative party stayed in overall control of the council.
The 2003 Stratford-on-Avon District Council election took place on 1 May 2003 to elect members of Stratford-on-Avon District Council in Warwickshire, England. One third of the council was up for election and the Conservative party gained overall control of the council from no overall control.
The 2006 Stratford-on-Avon District Council election took place on 4 May 2006 to elect members of Stratford-on-Avon District Council in Warwickshire, England. One third of the council was up for election and the Conservative party stayed in overall control of the council.
The 2007 Stratford-on-Avon District Council election took place on 3 May 2007 to elect members of Stratford-on-Avon District Council in Warwickshire, England. One third of the council was up for election and the Conservative party stayed in overall control of the council.
The 2008 Stratford-on-Avon District Council election took place on 1 May 2008 to elect members of Stratford-on-Avon District Council in Warwickshire, England. One third of the council was up for election and the Conservative party stayed in overall control of the council.
Local elections were held in the United Kingdom on 3 May 1979. The results provided some source of comfort to the Labour Party (UK), who recovered some lost ground from local election reversals in previous years, despite losing the general election to the Conservative Party on the same day.
The 2003 Solihull Metropolitan Borough Council election took place on 1 May 2003 to elect members of Solihull Metropolitan Borough Council in the West Midlands, England. One third of the council was up for election and the Conservative party stayed in overall control of the council.
The 2004 Solihull Metropolitan Borough Council election took place on 10 June 2004 to elect members of Solihull Metropolitan Borough Council in the West Midlands, England. The whole council was up for election with boundary changes since the last election in 2003. The Conservative party stayed in overall control of the council.
The 2006 Solihull Metropolitan Borough Council election took place on 4 May 2006 to elect members of Solihull Metropolitan Borough Council in the West Midlands, England. One third of the council was up for election and the Conservative party stayed in overall control of the council.
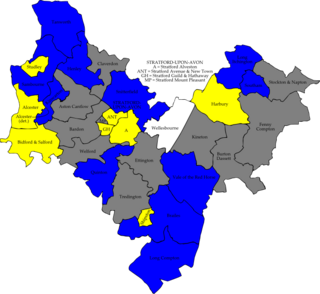
The 2010 Stratford-on-Avon District Council election took place on 6 May 2010 to elect members of Stratford-on-Avon District Council in Warwickshire, England. One third of the council was up for election and the Conservative party stayed in overall control of the council.