The 2003 Stratford-on-Avon District Council election took place on 1 May 2003 to elect members of Stratford-on-Avon District Council in Warwickshire, England. One third of the council was up for election and the Conservative party gained overall control of the council from no overall control. [1]
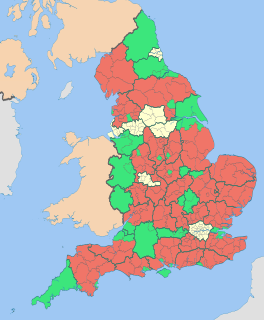
Non-metropolitan districts, or colloquially "shire districts", are a type of local government district in England. As created, they are sub-divisions of non-metropolitan counties in a two-tier arrangement.
Warwickshire is a landlocked county in the West Midlands region of England. The county town is Warwick, although the largest town is Nuneaton. The county is famous for being the birthplace of William Shakespeare.
England is a country that is part of the United Kingdom. It shares land borders with Wales to the west and Scotland to the north-northwest. The Irish Sea lies west of England and the Celtic Sea lies to the southwest. England is separated from continental Europe by the North Sea to the east and the English Channel to the south. The country covers five-eighths of the island of Great Britain, which lies in the North Atlantic, and includes over 100 smaller islands, such as the Isles of Scilly and the Isle of Wight.
After the election, the composition of the council was
The Conservative Party, officially the Conservative and Unionist Party, is a centre-right political party in the United Kingdom. Presently led by Theresa May, it has been the governing party since 2010. It presently has 314 Members of Parliament in the House of Commons, 249 members of the House of Lords, and 18 members of the European Parliament. It also has 31 Members of the Scottish Parliament, 12 members of the Welsh Assembly, eight members of the London Assembly and 9,008 local councillors. One of the major parties of UK politics, it has formed the government on 45 occasions, more than any other party.
The Liberal Democrats are a liberal, centrist political party in the United Kingdom. They presently have 11 Members of Parliament in the House of Commons, 96 members of the House of Lords, and one member of the European Parliament. They also have five Members of the Scottish Parliament and a member each in the Welsh Assembly and London Assembly. The party reached the height of its influence in the early 2010s, forming a junior partner in a coalition government from 2010 to 2015. It is presently led by Vince Cable.
The Labour Party is a centre-left political party in the United Kingdom which has been described as an alliance of social democrats, democratic socialists and trade unionists. The party's platform emphasises greater state intervention, social justice and strengthening workers' rights. Labour is a full member of the Party of European Socialists and Progressive Alliance, and holds observer status in the Socialist International. As of 2017, the party was considered the "largest party in Western Europe" in terms of party membership, with more than half a million members.
Before the election the Conservatives were one seats short of having a majority on the council with 26 seats, as compared to 22 for the Liberal Democrats, 2 Labour and 3 independents. [3] 16 seats were contested in the election with the Liberal Democrats defending the most seats. [4]
Council tax levels were the major issue in the election with the Liberal Democrats attacking plans for a 58% increase, [4] which they said was mostly due to waste and poor decisions by the council. [3] However the Conservatives defended the rise, blaming it on an insufficient grant from the national government [4] and on the previous Liberal Democrat administration for using cash balances to keep levels artificially low. [3] The election also saw four independent candidates standing in Stratford wards in opposition to the council tax rise. [3]
Stratford-upon-Avon, commonly known as just Stratford, is a market town and civil parish in the Stratford-on-Avon District, in the county of Warwickshire, England, on the River Avon, 91 miles (146 km) north west of London, 22 miles (35 km) south east of Birmingham, and 8 miles (13 km) south west of Warwick. The estimated population in 2007 was 25,505, increasing to 27,445 at the 2011 Census.
The results saw the Conservatives regain control of the council, after the election saw 5 seats changes hands. [5] They made a net gain of 1 seat at the expense of Labour who were reduced to only 1 seat on the council after losing in Southam ward. [6] The election in Stratford Avenue and New Town saw the closest result with independent Keith Lloyd, standing in protest at council tax levels, defeating Liberal Democrat Bill Lowe by 1 vote. [6] However the Liberal Democrats ended with the same number of seats, with their 2 gains including a surprise win in Stockton and Napton. [6] Turnout in the election varied from a low of 27% to a high of 51%, [7] but overall fell from 45% in 2002 to only 35%. [8] This was despite including 3,000 voters who had used a trial e-voting internet system. [7]
Southam is a small market town and civil parish in the Stratford-on-Avon district of Warwickshire, England. Southam is on the River Stowe, which flows from Napton-on-the-Hill and joins Warwickshire's River Itchen at Stoneythorpe, just outside the town. The town is about 7 1⁄2 miles (12 km) east of Leamington Spa, about 10 miles (16 km) from Rugby and Daventry, 13 miles (21 km) south of Coventry and 14 miles (23 km) north of Banbury.
Stockton is a village and civil parish, in the Stratford-on-Avon district of Warwickshire, England. In the 2001 census it had a population of 1,391, falling to 1,347 at the 2011 Census. The village is located just to the east of the A426 road two miles north-east of Southam, and eight miles south-west of Rugby.
Party | Seats | Gains | Losses | Net gain/loss | Seats % | Votes % | Votes | +/− | |
---|---|---|---|---|---|---|---|---|---|
Liberal Democrat | 9 | 2 | 2 | 0 | 56.3 | 45.5 | 9,856 | +3.7% | |
Conservative | 6 | 2 | 1 | +1 | 37.5 | 39.6 | 8,577 | -3.7% | |
Independent | 1 | 1 | 1 | 0 | 6.3 | 10.5 | 2,285 | +2.8% | |
Labour | 0 | 0 | 1 | -1 | 0 | 4.1 | 885 | -2.6% | |
Green | 0 | 0 | 0 | 0 | 0 | 0.3 | 66 | -0.2% |
Party | Candidate | Votes | % | ± | |
---|---|---|---|---|---|
Liberal Democrat | Pamela Price | 980 | 59.3 | ||
Conservative | Sylvia Hyde | 673 | 40.7 | ||
Majority | 307 | 18.6 | |||
Turnout | 1,653 | 37.1 | |||
Liberal Democrat hold | Swing |
Party | Candidate | Votes | % | ± | |
---|---|---|---|---|---|
Conservative | Brian Slaughter | 759 | 54.6 | ||
Liberal Democrat | John Sandle | 632 | 45.4 | ||
Majority | 127 | 9.1 | |||
Turnout | 1,391 | 27.5 | |||
Conservative hold | Swing |
Party | Candidate | Votes | % | ± | |
---|---|---|---|---|---|
Conservative | Chris Williams | 501 | 67.0 | +6.9 | |
Liberal Democrat | John Insoll | 247 | 33.0 | +33.0 | |
Majority | 254 | 34.0 | +11.8 | ||
Turnout | 748 | 40.7 | |||
Conservative hold | Swing |
Party | Candidate | Votes | % | ± | |
---|---|---|---|---|---|
Conservative | Ann Haddon | 652 | 57.9 | ||
Liberal Democrat | Mark Edwards | 474 | 42.1 | ||
Majority | 178 | 15.8 | |||
Turnout | 1,126 | 32.7 | |||
Conservative hold | Swing |
Party | Candidate | Votes | % | ± | |
---|---|---|---|---|---|
Liberal Democrat | Louise Giblin | 690 | 52.2 | ||
Conservative | Richard Hurley | 631 | 47.8 | ||
Majority | 59 | 4.5 | |||
Turnout | 1,321 | 40.5 | |||
Liberal Democrat hold | Swing |
Party | Candidate | Votes | % | ± | |
---|---|---|---|---|---|
Liberal Democrat | Bob White | 853 | 57.1 | ||
Conservative | Stephen Gray | 642 | 42.9 | ||
Majority | 211 | 14.1 | |||
Turnout | 1,495 | 43.0 | |||
Liberal Democrat hold | Swing |
Party | Candidate | Votes | % | ± | |
---|---|---|---|---|---|
Conservative | Leslie Hewer | 620 | 42.1 | ||
Labour | James Taylor | 608 | 41.3 | ||
Liberal Democrat | Charlie Williams | 244 | 16.6 | ||
Majority | 12 | 0.8 | |||
Turnout | 1,472 | 31.4 | |||
Conservative gain from Labour | Swing | ||||
Party | Candidate | Votes | % | ± | |
---|---|---|---|---|---|
Liberal Democrat | Nigel Rock | 419 | 62.7 | +36.4 | |
Conservative | Peter Garret | 249 | 37.3 | -6.3 | |
Majority | 170 | 25.4 | |||
Turnout | 668 | 37.5 | |||
Liberal Democrat gain from Conservative | Swing | ||||
Party | Candidate | Votes | % | ± | |
---|---|---|---|---|---|
Conservative | Vincent Seaman | 749 | 43.7 | ||
Liberal Democrat | Judith Riley | 634 | 37.0 | ||
Independent | Roy Lodge | 187 | 10.9 | ||
Independent | Leslie Rouch | 145 | 8.5 | ||
Majority | 115 | 6.7 | |||
Turnout | 1,715 | 41.7 | |||
Conservative gain from Liberal Democrat | Swing | ||||
Party | Candidate | Votes | % | ± | |
---|---|---|---|---|---|
Independent | Keith Lloyd | 612 | 35.8 | ||
Liberal Democrat | Bill Lowe | 611 | 35.8 | ||
Conservative | Robert Bessell | 417 | 24.4 | ||
Labour | Karen Parnell | 69 | 4.0 | ||
Majority | 1 | 0.1 | |||
Turnout | 1,709 | 34.1 | |||
Independent gain from Liberal Democrat | Swing | ||||
Party | Candidate | Votes | % | ± | |
---|---|---|---|---|---|
Liberal Democrat | Clive Thomas | 759 | 37.6 | ||
Conservative | Michael Perry | 631 | 31.3 | ||
Independent | Roger Hatch | 478 | 23.7 | ||
Labour | Michael Gerrard | 150 | 7.4 | ||
Majority | 128 | 6.3 | |||
Turnout | 2,018 | 37.9 | |||
Liberal Democrat hold | Swing |
Party | Candidate | Votes | % | ± | |
---|---|---|---|---|---|
Liberal Democrat | Peter Moorse | 762 | 60.6 | ||
Independent | Ted Lloyd | 438 | 34.8 | ||
Labour | Matthew Stephens | 58 | 4.6 | ||
Majority | 324 | 25.8 | |||
Turnout | 1,258 | 37.8 | |||
Liberal Democrat hold | Swing |
Party | Candidate | Votes | % | ± | |
---|---|---|---|---|---|
Liberal Democrat | Tony Cronin | 820 | 58.2 | ||
Conservative | Heather Wersocki | 589 | 41.8 | ||
Majority | 231 | 16.4 | |||
Turnout | 1,409 | 30.2 | |||
Liberal Democrat hold | Swing |
Party | Candidate | Votes | % | ± | |
---|---|---|---|---|---|
Conservative | Chris Saint | 556 | 68.6 | -3.3 | |
Liberal Democrat | Ben Brabyn | 255 | 31.4 | +3.3 | |
Majority | 301 | 37.1 | -6.7 | ||
Turnout | 811 | 43.2 | |||
Conservative hold | Swing |
Party | Candidate | Votes | % | ± | |
---|---|---|---|---|---|
Liberal Democrat | Peter Barnes | 647 | 76.7 | +1.9 | |
Conservative | Harry Cottam | 196 | 23.3 | -1.9 | |
Majority | 451 | 53.5 | +3.9 | ||
Turnout | 843 | 51.9 | |||
Liberal Democrat hold | Swing |
Party | Candidate | Votes | % | ± | |
---|---|---|---|---|---|
Liberal Democrat | David Close | 829 | 40.8 | ||
Conservative | Anita MacAulay | 712 | 35.0 | ||
Independent | Philip Coton | 425 | 20.9 | ||
Green | Michael Davies | 66 | 3.2 | ||
Majority | 117 | 5.8 | |||
Turnout | 2,032 | 39.0 | |||
Liberal Democrat gain from Independent | Swing | ||||
The 1998 Solihull Metropolitan Borough Council election took place on 7 May 1998 to elect members of Solihull Metropolitan Borough Council in the West Midlands, England. One third of the council was up for election and the council stayed under no overall control.
The 2003 Redditch Borough Council election took place on 1 May 2003 to elect members of Redditch Borough Council in the West Midlands region, England. One third of the council was up for election and the council stayed under no overall control.
The 2008 Wyre Forest District Council election took place on 1 May 2008 to elect members of Wyre Forest District Council in Worcestershire, England. One third of the council was up for election and the Conservative party gained overall control of the council from no overall control.
The 2000 Worcester City Council election took place on 4 May 2000 to elect members of Worcester District Council in Worcestershire, England. One third of the council was up for election and the Labour party lost overall control of the council to no overall control.
The 2003 Worcester City Council election took place on 1 May 2003 to elect members of Worcester District Council in Worcestershire, England. One third of the council was up for election and the Conservative party gained overall control of the council from no overall control.
The 1998 Stratford-on-Avon District Council election took place on 7 May 1998 to elect members of Stratford-on-Avon District Council in Warwickshire, England. One third of the council was up for election and the council stayed under no overall control.
The 1999 Stratford-on-Avon District Council election took place on 6 May 1999 to elect members of Stratford-on-Avon District Council in Warwickshire, England. One third of the council was up for election and the council stayed under no overall control.
The 2000 Stratford-on-Avon District Council election took place on 4 May 2000 to elect members of Stratford-on-Avon District Council in Warwickshire, England. One third of the council was up for election and the Conservative party gained overall control of the council from no overall control.
The 2002 Stratford-on-Avon District Council election took place on 2 May 2002 to elect members of Stratford-on-Avon District Council in Warwickshire, England. The whole council was up for election with boundary changes since the last election in 2000 reducing the number of seats by 2. The Conservative party stayed in overall control of the council.
The 2004 Stratford-on-Avon District Council election took place on 10 June 2004 to elect members of Stratford-on-Avon District Council in Warwickshire, England. One third of the council was up for election and the Conservative party stayed in overall control of the council.
The 2006 Stratford-on-Avon District Council election took place on 4 May 2006 to elect members of Stratford-on-Avon District Council in Warwickshire, England. One third of the council was up for election and the Conservative party stayed in overall control of the council.
The 2007 Stratford-on-Avon District Council election took place on 3 May 2007 to elect members of Stratford-on-Avon District Council in Warwickshire, England. One third of the council was up for election and the Conservative party stayed in overall control of the council.
The 2008 Stratford-on-Avon District Council election took place on 1 May 2008 to elect members of Stratford-on-Avon District Council in Warwickshire, England. One third of the council was up for election and the Conservative party stayed in overall control of the council.
The 2003 Windsor and Maidenhead Borough Council election took place on 1 May 2003 to elect members of Windsor and Maidenhead Unitary Council in Berkshire, England. The whole council was up for election with boundary changes since the last election in 2000 reducing the number of seats by 1. The Liberal Democrats gained overall control of the council from no overall control.
The 1999 Solihull Metropolitan Borough Council election took place on 6 May 1999 to elect members of Solihull Metropolitan Borough Council in the West Midlands, England. One third of the council was up for election and the council stayed under no overall control.
The 2003 Solihull Metropolitan Borough Council election took place on 1 May 2003 to elect members of Solihull Metropolitan Borough Council in the West Midlands, England. One third of the council was up for election and the Conservative party stayed in overall control of the council.
The 2004 Solihull Metropolitan Borough Council election took place on 10 June 2004 to elect members of Solihull Metropolitan Borough Council in the West Midlands, England. The whole council was up for election with boundary changes since the last election in 2003. The Conservative party stayed in overall control of the council.
The 2006 Solihull Metropolitan Borough Council election took place on 4 May 2006 to elect members of Solihull Metropolitan Borough Council in the West Midlands, England. One third of the council was up for election and the Conservative party stayed in overall control of the council.
The 2007 Solihull Metropolitan Borough Council election took place on 4 May 2007 to elect members of Solihull Metropolitan Borough Council in the West Midlands, England. One third of the council was up for election and the Conservative party lost overall control of the council to no overall control.
The 2008 Sunderland Council election took place on 1 May 2008 to elect members of Sunderland Metropolitan Borough Council in Tyne and Wear, England. One third of the council was up for election and the Labour party stayed in overall control of the council.