Wychavon District Council election, 2003

Last updated
Map of the results of the 2003 Wychavon District Council election. Conservatives in blue, Liberal Democrats in yellow and Labour in red. Wychavon UK local election 2003 map.svg
Map of the results of the 2003 Wychavon District Council election. Conservatives in blue, Liberal Democrats in yellow and Labour in red.

The 2003 Wychavon District Council election took place on 1 May 2003 to elect members of Wychavon District Council in Worcestershire, England. The whole council was up for election with boundary changes since the last election in 1999 reducing the number of seats by four. [1] The Conservative party stayed in overall control of the council. [2]

Wychavon Non-metropolitan district in England

Wychavon is a local government district in Worcestershire, England. Its council is based in the town of Pershore, and the other towns in the district are Droitwich Spa and Evesham. The district extends from the south-east corner of Worcestershire north and west. It borders all the other districts of Worcestershire, as well as the counties of Gloucestershire and Warwickshire.

Non-metropolitan district Type of local government district in England

Non-metropolitan districts, or colloquially "shire districts", are a type of local government district in England. As created, they are sub-divisions of non-metropolitan counties in a two-tier arrangement.

Worcestershire County of England

Worcestershire is a county in the West Midlands of England. Between 1974 and 1998, it was merged with the neighbouring county of Herefordshire as Hereford and Worcester.

Contents

Background

Before the election the Conservatives controlled the council with 33 councillors, while the Liberal Democrats had 10 seats, Labour had 3, there was 1 independent and 2 seats were vacant. [3] Boundary changes since 1999 reduced the number of wards from 36 to 32 and the number of councillors fell by four. [4] Although all of the seats on the council were up for election, in Norton and Whittington, and Pinvin, there was no election as there was only one candidate in each ward. [3]

A Councillor is a member of a local government council.

Liberal Democrats (UK) Political party in the United Kingdom

The Liberal Democrats are a liberal, centrist political party in the United Kingdom. They presently have 11 Members of Parliament in the House of Commons, 96 members of the House of Lords, and one member of the European Parliament. They also have five Members of the Scottish Parliament and a member each in the Welsh Assembly and London Assembly. The party reached the height of its influence in the early 2010s, forming a junior partner in a coalition government from 2010 to 2015. It is presently led by Vince Cable.

The Labour Party is a centre-left political party in the United Kingdom which has been described as an alliance of social democrats, democratic socialists and trade unionists. The party's platform emphasises greater state intervention, social justice and strengthening workers' rights. Labour is a full member of the Party of European Socialists and Progressive Alliance, and holds observer status in the Socialist International. As of 2017, the party was considered the "largest party in Western Europe" in terms of party membership, with more than half a million members.

One-third of the Conservative councillors stood down at the election, [3] as well as independent John Smith who had represented Pershore on Wychavon District Council from its first election in 1973. [5]

Pershore town in Worcestershire, England

Pershore is a market town in Worcestershire, England, on the banks of the River Avon. Pershore is in the Wychavon district and is part of the West Worcestershire parliamentary constituency. At the 2011 census the population was 7,125. The town is best known for Pershore Abbey, Pershore College, and the plums and pears grown locally.

Election result

The Conservatives remained in control of the council after winning 31 of the 45 seats on the council. [4] The Liberal Democrats remained the largest opposition with 12 seats, while Labour took two seats. [6] Overall turnout at the election was 37.94%, almost 4% higher than at the 1999 election. [7]

Voter turnout percentage of eligible voters who cast a ballot in an election

Voter turnout is the percentage of eligible voters who cast a ballot in an election. Eligibility varies by country, and the voting-eligible population should not be confused with the total adult population. Age and citizenship status are often among the criteria used to determine eligibility, but some countries further restrict eligibility based on sex, race, or religion.

Among the defeated candidates was the Labour leader on Worcestershire County Council, Peter Pinfield, who lost in Droitwich East. [4] Meanwhile, the Conservative leader of the council, Malcolm Meikle, held his seat by 39 votes and the Liberal Democrat group leader, Margaret Rowley was elected by 19 votes after recounts in both wards. [4] However the Conservatives did lose seats in Pershore, where the Liberal Democrats won all three seats for the ward. [7]

Worcestershire County Council local government body in England

Worcestershire County Council is the county council for the non-metropolitan county of Worcestershire in England. The most recent election to it were in 2017. Worcestershire County Council has its headquarters is County Hall in Worcester, which was also the headquarters for the preceding Hereford and Worcester County Council.

Wychavon local election result 2003 [2] [8]
PartySeatsGainsLossesNet gain/lossSeats %Votes %Votes+/−
  Conservative 31-268.953.623,316+8.0%
  Liberal Democrat 12+226.728.312,316+0.4%
  Labour 2-24.411.14,841-4.2%
  Independent 0-206.42,767-2.2%
  Green 0000.7285+0.0%

Ward results

Badsey [8]
PartyCandidateVotes%±
Liberal Democrat Sonya Ealey32150.7
Conservative Reginald Jakeman31249.3
Majority91.4
Turnout 63330.1
Bengeworth (2 seats) [8]
PartyCandidateVotes%±
Conservative Martin Jennings514
Conservative Emma Stokes421
Labour Stephen Selby319
Independent Albert Booth312
Turnout 1,56628.9
Bowbrook [8]
PartyCandidateVotes%±
Liberal Democrat Alexandra Rowley47151.0
Conservative Christopher Hartwright45249.0
Majority192.1
Turnout 92347.9
Bredon [8]
PartyCandidateVotes%±
Conservative Adrian Hardman48763.5
Liberal Democrat Jeanette Way21828.4
Labour Peter Kelson628.1
Majority26935.1
Turnout 76738.9
Bretforton and Offenham [8]
PartyCandidateVotes%±
Liberal Democrat George Bourne40967.0
Conservative Patrick Clifford20133.0
Majority20834.1
Turnout 61030.3
Broadway and Wickhamford (2 seats) [8]
PartyCandidateVotes%±
Conservative David Folkes964
Conservative David Noyes774
Liberal Democrat Carolyn Harford343
Turnout 2,08132.7
Dodderhill [8]
PartyCandidateVotes%±
Conservative Judith Pearce39369.1
Liberal Democrat Derek Prior17630.9
Majority21738.1
Turnout 56932.2
Drakes Broughton [8]
PartyCandidateVotes%±
Conservative Paul Middlebrough41758.8
Liberal Democrat Josephine Wilkinson29241.2
Majority12517.6
Turnout 70937.5
Droitwich Central [8]
PartyCandidateVotes%±
Liberal Democrat Graham Gopsill23837.4
Labour Eve Freer23536.9
Conservative Glenise Noyes16425.7
Majority30.5
Turnout 63730.2
Droitwich East (2 seats) [8]
PartyCandidateVotes%±
Conservative Michael Barratt788
Conservative Pamela Davey716
Labour Peter Pinfield691
Labour Sheila Neary667
Turnout 2,86235.3
Droitwich South East (2 seats) [8]
PartyCandidateVotes%±
Conservative Eileen Hope730
Conservative Donald Lawley645
Independent Ronald Waters487
Labour Bill Baker286
Labour Jon Baker264
Turnout 2,41233.8
Droitwich South West (2 seats) [8]
PartyCandidateVotes%±
Conservative Terence Spencer497
Conservative Maureen Lawley476
Liberal Democrat Wendy Carter391
Independent Claude Heeley358
Labour John Cook324
Liberal Democrat Pamela Jackson-Smith282
Labour Sheila Seabourne278
Turnout 2,60634.6
Droitwich West (2 seats) [8]
PartyCandidateVotes%±
Labour Roy Seabourne473
Labour John Wrenn442
Conservative Laurence Evans314
Conservative Alan Fisher306
Turnout 1,53521.1
Ecckington [8]
PartyCandidateVotes%±
Conservative Peter Wright50759.1
Liberal Democrat Roy Chiverton23427.3
Labour Priscilla Cameron11713.6
Majority27331.8
Turnout 85839.0
Elmley Castle and Somerville [8]
PartyCandidateVotes%±
Conservative Dorothy Mackison55862.3
Liberal Democrat Garth Raymer33837.7
Majority22024.6
Turnout 89645.1
Evesham North (2 seats) [8]
PartyCandidateVotes%±
Conservative Josephine Sandalls461
Conservative Roma Kirke436
Labour Robin Lunn302
Liberal Democrat Pauline Christie298
Independent Paul Rencher220
Turnout 1,71728.1
Evesham South (2 seats) [8]
PartyCandidateVotes%±
Conservative Ronald Cartwright549
Conservative Robert Banks504
Liberal Democrat Diana Brown354
Turnout 1,40722.9
Fladbury [8]
PartyCandidateVotes%±
Conservative Malcolm Meikle55849.3
Liberal Democrat Thomas McDonald52246.1
Labour Ross Hayman524.6
Majority363.2
Turnout 1,13252.0
Great Hampton [8]
PartyCandidateVotes%±
Conservative John Smith42068.4
Liberal Democrat Edward Martin19431.6
Majority22636.8
Turnout 61429.8
Hartlebury [8]
PartyCandidateVotes%±
Conservative Muriel Mathews43577.1
Labour Steven Westwood12922.9
Majority30654.3
Turnout 56426.0
Havington and Norton [8]
PartyCandidateVotes%±
Conservative Clive Holt42558.7
Liberal Democrat Noel Christie29941.3
Majority12617.4
Turnout 72435.4
Honeybourne and Pebworth [8]
PartyCandidateVotes%±
Liberal Democrat Thomas Bean29547.6
Independent Sharon Summers18029.0
Conservative Lesley Auden14523.4
Majority11518.5
Turnout 62032.6
Inkberrow (2 seats) [8]
PartyCandidateVotes%±
Conservative Audrey Steel1,262
Conservative David Lee1,093
Liberal Democrat Martin Davey632
Liberal Democrat Donald Aldridge518
Turnout 3,50541.3
Little Hampton (2 seats) [8]
PartyCandidateVotes%±
Conservative Andrew Dyke480
Liberal Democrat John Payne420
Conservative John Stych333
Turnout 1,23321.5
Lovett and North Claines (2 seats) [8]
PartyCandidateVotes%±
Conservative Paul Coley897
Conservative Andrew Christian-Brookes870
Liberal Democrat Anthony Miller556
Liberal Democrat Janet Saunders457
Turnout 2,78035.8
Norton and Whittington [8]
PartyCandidateVotes%±
Conservative Robert Adamsunopposed
Ombersley [8]
PartyCandidateVotes%±
Conservative Jean Dowty53980.6
Liberal Democrat Judith Cussen13019.4
Majority40961.1
Turnout 66936.5
Pershore (3 seats) [8]
PartyCandidateVotes%±
Liberal Democrat Gaynor Amphhlett898
Liberal Democrat John Grantham785
Liberal Democrat Charles Tucker731
Conservative Richard Hampton654
Conservative Valerie Wood607
Conservative Maurene Wilson529
Independent Trudy Burge455
Independent Raith Annis328
Green David Shaw285
Independent Malcolm Dalley216
Independent Kenneth Rowe211
Labour Susan Hayman155
Turnout 5,85436.3
Pinvin [8]
PartyCandidateVotes%±
Liberal Democrat Malcolm Argyleunopposed
South Bredon Hill [8]
PartyCandidateVotes%±
Liberal Democrat Adrian Darby55557.3
Conservative Beverley Hardman36838.0
Labour Fiona Cameron454.6
Majority18719.3
Turnout 96850.6
The Littletons [8]
PartyCandidateVotes%±
Conservative Mary Smith53260.0
Liberal Democrat Helen Martin35440.0
Majority17820.1
Turnout 88640.5
Upton Snodsbury [8]
PartyCandidateVotes%±
Liberal Democrat Elizabeth Tucker60550.9
Conservative Linda Robinson58349.1
Majority221.9
Turnout 1,18855.8

Related Research Articles

The 1999 Craven District Council election took place on 6 May 1999 to elect members of Craven District Council in North Yorkshire, England. One third of the council was up for election and the Conservative party gained overall control of the council from no overall control.

2004 Craven District Council election

The 2004 Craven District Council election took place on 10 June 2004 to elect members of Craven District Council in North Yorkshire, England. One third of the council was up for election and the council stayed under no overall control.

The 1999 Harlow District Council election took place on 6 May 1999 to elect members of Harlow District Council in Essex, England. One third of the council was up for election and the Labour party stayed in overall control of the council.

2003 Harlow District Council election

The 2003 Harlow District Council election took place on 1 May 2003 to elect members of Harlow District Council in Essex, England. One third of the council was up for election and the council stayed under no overall control.

2006 St Albans City and District Council election

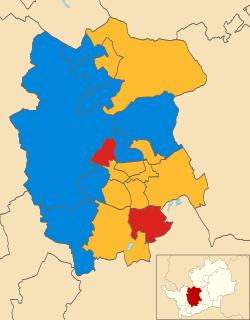
The 2006 St Albans City and District Council election took place on 4 May 2006 to elect members of St Albans District Council in Hertfordshire, England. One third of the council was up for election and the Liberal Democrats gained overall control of the council from no overall control.

2007 St Albans City and District Council election

The 2007 St Albans City and District Council election took place on 3 May 2007 to elect members of St Albans District Council in Hertfordshire, England. One third of the council was up for election and the Liberal Democrats lost overall control of the council to no overall control.

2002 Wyre Forest District Council election

The 2002 Wyre Forest District Council election took place on 2 May 2002 to elect members of Wyre Forest District Council in Worcestershire, England. One third of the council was up for election and the Independent Kidderminster Hospital and Health Concern party gained overall control of the council from no overall control.

2004 Wyre Forest District Council election

The 2004 Wyre Forest District Council election took place on 10 June 2004 to elect members of Wyre Forest District Council in Worcestershire, England. The whole council was up for election with boundary changes since the last election in 2003. The council stayed under no overall control, but with the Conservatives taking over as the largest party on the council from the Health Concern party.

2006 Wyre Forest District Council election

The 2006 Wyre Forest District Council election took place on 4 May 2006 to elect members of Wyre Forest District Council in Worcestershire, England. One third of the council was up for election and the council stayed under no overall control.

2003 Rother District Council election

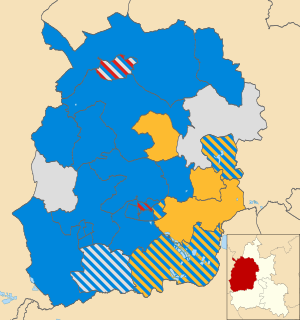
The 2003 Rother District Council election took place on 1 May 2003 to elect members of Rother District Council in East Sussex, England. The whole council was up for election after boundary changes reduced the number of seats by 7. The Conservative party stayed in overall control of the council.

The 1999 Wychavon District Council election took place on 6 May 1999 to elect members of Wychavon District Council in Worcestershire, England. The whole council was up for election and the Conservative party gained overall control of the council from no overall control.

2007 Wychavon District Council election

The 2007 Wychavon District Council election took place on 3 May 2007 to elect members of Wychavon District Council in Worcestershire, England. The whole council was up for election and the Conservative party stayed in overall control of the council.

2011 Wychavon District Council election

The 2011 Wychavon District Council election took place on 5 May 2011 to elect members of Wychavon District Council in Worcestershire, England. The whole council was up for election and the Conservative party stayed in overall control of the council.

2003 South Kesteven District Council election

The 2003 South Kesteven District Council election took place on 1 May 2003 to elect members of South Kesteven District Council in Lincolnshire, England. The whole council was up for election and the Conservative party gained control of the council from no overall control.

2015 Wychavon District Council election

The 2015 Wychavon District Council election took place on 7 May 2015 to elect members of Wychavon District Council in Worcestershire, England. The whole council was up for election and the Conservative party stayed in overall control of the council.

2002 West Oxfordshire District Council election

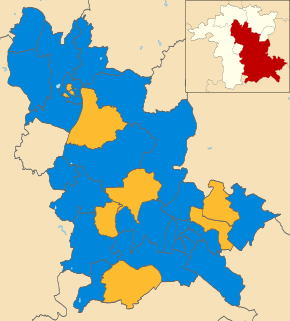
The 2002 West Oxfordshire District Council election took place on 2 May 2002 to elect members of West Oxfordshire District Council in Oxfordshire, England. The whole council was up for election with boundary changes since the last election in 2000. The Conservative party stayed in overall control of the council.

2003 West Oxfordshire District Council election

The 2003 West Oxfordshire District Council election took place on 1 May 2003 to elect members of West Oxfordshire District Council in Oxfordshire, England. One third of the council was up for election and the Conservative party stayed in overall control of the council.

2004 West Oxfordshire District Council election

The 2004 West Oxfordshire District Council election took place on 10 June 2004 to elect members of West Oxfordshire District Council in Oxfordshire, England. One third of the council was up for election and the Conservative party stayed in overall control of the council.

2006 West Oxfordshire District Council election

The 2006 West Oxfordshire District Council election took place on 4 May 2006 to elect members of West Oxfordshire District Council in Oxfordshire, England. One third of the council was up for election and the Conservative party stayed in overall control of the council.

2007 West Oxfordshire District Council election

The 2007 West Oxfordshire District Council election took place on 3 May 2007 to elect members of West Oxfordshire District Council in Oxfordshire, England. One third of the council was up for election and the Conservative party stayed in overall control of the council.

References

  1. "Local elections". BBC News Online . Retrieved 27 April 2015.
  2. 1 2 "English councils - Non-metropolitan districts". The Times . NewsBank. 3 May 2003. p. 47.
  3. 1 2 3 "Tories under siege at polls". Worcestershire, West Midlands, Herefordshire, and Shropshire Counties Publications. NewsBank. 11 April 2003.
  4. 1 2 3 4 "Victory fails to bring control". Worcestershire, West Midlands, Herefordshire, and Shropshire Counties Publications. NewsBank. 2 May 2003.
  5. "'Mr Pershore' John standing down after 56 year's service". Worcestershire, West Midlands, Herefordshire, and Shropshire Counties Publications. NewsBank. 10 April 2003.
  6. "Local election results - Wychavon". Worcestershire, West Midlands, Herefordshire, and Shropshire Counties Publications. NewsBank. 2 May 2003.
  7. 1 2 "Tory joy at the local elections". Worcestershire, West Midlands, Herefordshire, and Shropshire Counties Publications. NewsBank. 8 May 2003.
  8. 1 2 3 4 5 6 7 8 9 10 11 12 13 14 15 16 17 18 19 20 21 22 23 24 25 26 27 28 29 30 31 32 33 "District Council election" (PDF). Wychavon District Council. Retrieved 27 April 2015.