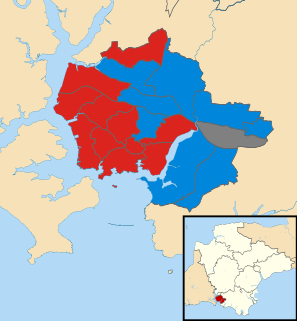
The 2007 Worcester City Council election took place on 3 May 2007 to elect members of Worcester District Council in Worcestershire, England. One third of the council was up for election and the Conservative party stayed in overall control of the council. [1]
Worcester is a city in Worcestershire, England, 31 miles (50 km) southwest of Birmingham, 101 miles (163 km) west-northwest of London, 27 miles (43 km) north of Gloucester and 23 miles (37 km) northeast of Hereford. The population is approximately 100,000. The River Severn flanks the western side of the city centre, which is overlooked by Worcester Cathedral.
Non-metropolitan districts, or colloquially "shire districts", are a type of local government district in England. As created, they are sub-divisions of non-metropolitan counties in a two-tier arrangement.
Worcestershire is a county in the West Midlands of England. Between 1974 and 1998, it was merged with the neighbouring county of Herefordshire as Hereford and Worcester.
After the election, the composition of the council was
The Conservative Party, officially the Conservative and Unionist Party, is a centre-right political party in the United Kingdom. Presently led by Theresa May, it has been the governing party since 2010. It presently has 314 Members of Parliament in the House of Commons, 249 members of the House of Lords, and 18 members of the European Parliament. It also has 31 Members of the Scottish Parliament, 12 members of the Welsh Assembly, eight members of the London Assembly and 9,008 local councillors. One of the major parties of UK politics, it has formed the government on 45 occasions, more than any other party.
The Labour Party is a centre-left political party in the United Kingdom which has been described as an alliance of social democrats, democratic socialists and trade unionists. The party's platform emphasises greater state intervention, social justice and strengthening workers' rights. Labour is a full member of the Party of European Socialists and Progressive Alliance, and holds observer status in the Socialist International. As of 2017, the party was considered the "largest party in Western Europe" in terms of party membership, with more than half a million members.
The Liberal Democrats are a liberal, centrist political party in the United Kingdom. They presently have 11 Members of Parliament in the House of Commons, 96 members of the House of Lords, and one member of the European Parliament. They also have five Members of the Scottish Parliament and a member each in the Welsh Assembly and London Assembly. The party reached the height of its influence in the early 2010s, forming a junior partner in a coalition government from 2010 to 2015. It is presently led by Vince Cable.
Before the election the Conservatives controlled the council with 18 seats, while Labour had 11 and the Liberal Democrats and independents had 3 seats each. [3] 44 candidates stood in the election for the 11 seats which were being contested. [4]
The campaign saw controversy over the Conservative candidate in Arboretum ward, Melanie Heider, after it came out that she was a member of the United Kingdom Independence Party (UKIP) as well as the Conservatives. [5] [6] When this became public it was announced that she had resigned her membership of UKIP, but Labour called on her to be sacked as a candidate. [5] [7]
The results saw the Conservatives keep their majority on the council after holding all 7 seats which they had been defending. [8] Meanwhile, Labour gained one seat in Nunnery ward from an independent to have 12 councillors after the election. [8] [9]
A Councillor is a member of a local government council.
Party | Seats | Gains | Losses | Net gain/loss | Seats % | Votes % | Votes | +/− | |
---|---|---|---|---|---|---|---|---|---|
Conservative | 7 | 0 | 0 | 0 | 63.6 | 42.9 | 9,249 | +3.2% | |
Labour | 3 | 1 | 0 | +1 | 27.3 | 25.3 | 5,457 | -3.8% | |
Liberal Democrat | 1 | 0 | 0 | 0 | 9.1 | 13.0 | 2,811 | +0.0% | |
Green | 0 | 0 | 0 | 0 | 0 | 9.7 | 2,103 | -1.9% | |
Independent | 0 | 0 | 1 | -1 | 0 | 4.8 | 1,031 | +1.6% | |
BNP | 0 | 0 | 0 | 0 | 0 | 3.7 | 798 | +0.2% | |
UKIP | 0 | 0 | 0 | 0 | 0 | 0.6 | 128 | +0.6% |
Party | Candidate | Votes | % | ± | |
---|---|---|---|---|---|
Labour | Marc Bayliss | 814 | 43.2 | ||
Conservative | Melanie Heider | 554 | 29.4 | ||
Liberal Democrat | Ken Carpenter | 246 | 13.0 | ||
Green | Martin Sullivan | 144 | 7.6 | ||
UKIP | Jason Phillips | 128 | 6.8 | ||
Majority | 260 | 13.8 | |||
Turnout | 1,886 | 42.0 | |||
Labour hold | Swing |
Party | Candidate | Votes | % | ± | |
---|---|---|---|---|---|
Conservative | David Clark | 1,309 | 56.4 | +4.5 | |
Labour | Jenny Barnes | 478 | 20.6 | -3.0 | |
Liberal Democrat | Vaughan Hencher | 320 | 13.8 | +0.2 | |
Green | Roger Cook | 212 | 9.1 | -1.8 | |
Majority | 831 | 35.8 | +7.5 | ||
Turnout | 2,319 | 37.3 | -0.1 | ||
Conservative hold | Swing |
Party | Candidate | Votes | % | ± | |
---|---|---|---|---|---|
Conservative | Allah Ditta | 1,203 | 51.0 | +2.7 | |
Labour | Christopher Winwood | 510 | 21.6 | -4.0 | |
Green | Robert Wilkins | 333 | 14.1 | +2.1 | |
Liberal Democrat | Iain MacBriar | 314 | 13.3 | -0.8 | |
Majority | 693 | 29.4 | +6.7 | ||
Turnout | 2,360 | 35.2 | +0.4 | ||
Conservative hold | Swing |
Party | Candidate | Votes | % | ± | |
---|---|---|---|---|---|
Liberal Democrat | Liz Smith | 1,739 | 54.7 | +2.8 | |
Conservative | Nicholas Turner | 985 | 31.0 | -2.6 | |
Labour | Joy Squires | 246 | 7.7 | -0.3 | |
Green | Peter Robinson | 210 | 6.6 | +0.0 | |
Majority | 754 | 23.7 | +5.4 | ||
Turnout | 3,180 | 49.0 | -0.3 | ||
Liberal Democrat hold | Swing |
Party | Candidate | Votes | % | ± | |
---|---|---|---|---|---|
Labour | Simon Cronin | 804 | 35.2 | +2.7 | |
Independent | Keith Burton | 700 | 30.7 | +6.7 | |
Conservative | Lorraine Taylor | 355 | 15.6 | -1.1 | |
BNP | Michael Peat | 289 | 12.7 | -6.5 | |
Green | Alexander Gwinn | 134 | 5.9 | -1.7 | |
Majority | 104 | 4.5 | -4.0 | ||
Turnout | 2,282 | 38.4 | +2.4 | ||
Labour gain from Independent | Swing | ||||
Party | Candidate | Votes | % | ± | |
---|---|---|---|---|---|
Conservative | Ian Imray | 879 | 49.4 | ||
Labour | Richard Udall | 409 | 23.0 | ||
BNP | Peter Beechey | 281 | 15.8 | ||
Green | Ruth Stafford | 209 | 11.8 | ||
Majority | 470 | 26.4 | |||
Turnout | 1,778 | 39.5 | |||
Conservative hold | Swing |
Party | Candidate | Votes | % | ± | |
---|---|---|---|---|---|
Labour | David Candler | 879 | 42.3 | -7.0 | |
Conservative | Robert Campbell | 446 | 21.5 | -8.7 | |
Independent | Colin Layland | 331 | 15.9 | +15.9 | |
BNP | James Warner | 228 | 11.0 | +11.0 | |
Green | Clive Matthews | 193 | 9.3 | -11.2 | |
Majority | 433 | 20.8 | +1.7 | ||
Turnout | 2,077 | 34.5 | +4.4 | ||
Labour hold | Swing |
Party | Candidate | Votes | % | ± | |
---|---|---|---|---|---|
Conservative | Roger Knight | 1,018 | 69.2 | +10.2 | |
Labour | George Squires | 262 | 17.8 | +2.7 | |
Green | Katherine Harris | 192 | 13.0 | +4.4 | |
Majority | 756 | 51.4 | +9.7 | ||
Turnout | 1,472 | 35.0 | +1.0 | ||
Conservative hold | Swing |
Party | Candidate | Votes | % | ± | |
---|---|---|---|---|---|
Conservative | Gareth Jones | 917 | 60.0 | ||
Labour | Wes Spiller | 295 | 19.3 | ||
Liberal Democrat | Paul Griffiths | 192 | 12.6 | ||
Green | Penelope Asquith | 125 | 8.2 | ||
Majority | 622 | 40.7 | |||
Turnout | 1,529 | 37.4 | |||
Conservative hold | Swing |
Party | Candidate | Votes | % | ± | |
---|---|---|---|---|---|
Conservative | Douglas Wilkinson | 762 | 52.7 | +6.2 | |
Labour | Andrew Watson | 493 | 34.1 | -9.0 | |
Green | Linda Smith | 192 | 13.3 | +2.9 | |
Majority | 269 | 18.6 | +15.2 | ||
Turnout | 1,446 | 36.1 | -3.0 | ||
Conservative hold | Swing |
Party | Candidate | Votes | % | ± | |
---|---|---|---|---|---|
Conservative | Lucy Hodgson | 821 | 65.8 | +1.4 | |
Labour | David Insull | 267 | 21.4 | -3.1 | |
Green | Olaf Twiehaus | 159 | 12.8 | +1.7 | |
Majority | 554 | 44.4 | +4.5 | ||
Turnout | 1,247 | 31.1 | -3.1 | ||
Conservative hold | Swing |
The 1998 Solihull Metropolitan Borough Council election took place on 7 May 1998 to elect members of Solihull Metropolitan Borough Council in the West Midlands, England. One third of the council was up for election and the council stayed under no overall control.
The 2002 Redditch Borough Council election of 2 May 2002 elected members of Redditch Borough Council in the West Midlands region, England. One third of the council stood for re-election and the Labour party lost overall control of the council to no overall control for the first time in many years.
The 1998 Wyre Forest District Council election took place on 7 May 1998 to elect members of Wyre Forest District Council in Worcestershire, England. One third of the council was up for election and the Labour party stayed in overall control of the council.
The 2008 Wyre Forest District Council election took place on 1 May 2008 to elect members of Wyre Forest District Council in Worcestershire, England. One third of the council was up for election and the Conservative party gained overall control of the council from no overall control.
The 1998 Worcester City Council election took place on 7 May 1998 to elect members of Worcester District Council in Worcestershire, England. One third of the council was up for election and the Labour party stayed in overall control of the council.
The 1999 Worcester City Council election took place on 6 May 1999 to elect members of Worcester District Council in Worcestershire, England. One third of the council was up for election and the Labour party stayed in overall control of the council.
The 2000 Worcester City Council election took place on 4 May 2000 to elect members of Worcester District Council in Worcestershire, England. One third of the council was up for election and the Labour party lost overall control of the council to no overall control.
The 2002 Worcester City Council election took place on 2 May 2002 to elect members of Worcester District Council in Worcestershire, England. One third of the council was up for election and the council stayed under no overall control.
The 2003 Worcester City Council election took place on 1 May 2003 to elect members of Worcester District Council in Worcestershire, England. One third of the council was up for election and the Conservative party gained overall control of the council from no overall control.
The 2006 Worcester City Council election took place on 4 May 2006 to elect members of Worcester District Council in Worcestershire, England. One third of the council was up for election and the Conservative party stayed in overall control of the council.
The 2008 Worcester City Council election took place on 1 May 2008 to elect members of Worcester District Council in Worcestershire, England. One third of the council was up for election and the council stayed under no overall control.
The 2008 Woking Council election took place on 1 May 2008 to elect members of Woking Borough Council in Surrey, England. One third of the council was up for election and the Conservative party stayed in overall control of the council.
The 2004 Stratford-on-Avon District Council election took place on 10 June 2004 to elect members of Stratford-on-Avon District Council in Warwickshire, England. One third of the council was up for election and the Conservative party stayed in overall control of the council.
The 1999 Solihull Metropolitan Borough Council election took place on 6 May 1999 to elect members of Solihull Metropolitan Borough Council in the West Midlands, England. One third of the council was up for election and the council stayed under no overall control.
The 2004 Solihull Metropolitan Borough Council election took place on 10 June 2004 to elect members of Solihull Metropolitan Borough Council in the West Midlands, England. The whole council was up for election with boundary changes since the last election in 2003. The Conservative party stayed in overall control of the council.
The 2006 Solihull Metropolitan Borough Council election took place on 4 May 2006 to elect members of Solihull Metropolitan Borough Council in the West Midlands, England. One third of the council was up for election and the Conservative party stayed in overall control of the council.
The 2007 Solihull Metropolitan Borough Council election took place on 4 May 2007 to elect members of Solihull Metropolitan Borough Council in the West Midlands, England. One third of the council was up for election and the Conservative party lost overall control of the council to no overall control.
The 2015 Wychavon District Council election took place on 7 May 2015 to elect members of Wychavon District Council in Worcestershire, England. The whole council was up for election and the Conservative party stayed in overall control of the council.
The 2018 Plymouth City Council election took place on 3 May 2018 to elect members of Plymouth City Council in England. The election was won by the Labour Party, who gained enough seats to achieve an overall majority and took control of the council.
The 2018 Sunderland City Council election took place on 3 May 2018 to elect members of Sunderland City Council in England. The election took place on the same day as other local elections.