Worcestershire County Council election, 2013

Last updated

Worcestershire County Council election, 2013
Worcestershire flag.svg
  2009 2 May 2013 2017  

All 57 council division seats
29 seats needed for a majority

 First partySecond party
 
Party Conservative Labour
Seats won3012
Seat changeDecrease2.svg 12Increase2.svg 9

 Third partyFourth party
 
Party UKIP Liberal Democrat
Seats won43
Seat changeIncrease2.svg 4Decrease2.svg 5

Worcestershire UK local election 2013 map.svg
Map showing the results of the 2013 Worcestershire County Council election. Striped divisions have mixed representation.

Council control before election

Conservative

Council control after election

Conservative

An election to Worcestershire County Council took place on 2 May 2013 as part of the United Kingdom local elections, 2013. 57 councillors were elected from 53 electoral divisions, which returned either one or two county councillors each by first-past-the-post voting for a four-year term of office. The divisions were the same as those used at the previous election in 2009. The election saw the Conservative Party retain overall control of the council with a significantly reduced majority of just 2 seats.

Worcestershire County Council local government body in England

Worcestershire County Council is the county council for the non-metropolitan county of Worcestershire in England. The most recent election to it were in 2017. Worcestershire County Council has its headquarters is County Hall in Worcester, which was also the headquarters for the preceding Hereford and Worcester County Council.

First-past-the-post voting voting system in which voters select one candidate, and the candidate who receives more votes than any other candidate wins

A first-past-the-post electoral system is one in which voters indicate on a ballot the candidate of their choice, and the candidate who receives the most votes wins. This is sometimes described as winner takes all. First-past-the-post voting is a plurality voting method. FPTP is a common, but not universal, feature of electoral systems with single-member electoral divisions, and is practiced in close to one third of countries. Notable examples include Canada, India, the United Kingdom, and the United States, as well as most of their current or former colonies and protectorates.

Contents

All locally registered electors (British, Commonwealth and European Union citizens) who were aged 18 or over on Thursday 2 May 2013 were entitled to vote in the local elections. Those who were temporarily away from their ordinary address (for example, away working, on holiday, in student accommodation or in hospital) were also entitled to vote in the local elections, [1] although those who had moved abroad and registered as overseas electors cannot vote in the local elections. It is possible to register to vote at more than one address (such as a university student who had a term-time address and lives at home during holidays) at the discretion of the local Electoral Register Office, but it remains an offence to vote more than once in the same local government election. [2]

In general, a Commonwealth citizen is a citizen of a member state of the Commonwealth of Nations. This designation is given legal effect in the nationality laws of some Commonwealth countries, and Commonwealth citizens may enjoy some privileges in the United Kingdom and, less commonly, other member states. Each Commonwealth country determines what special rights, if any, are accorded to citizens of other Commonwealth countries. The status is most significant in British law and has little effect in many other Commonwealth countries, such as Australia.

European Union Economic and poitical union of states located in Europe

The European Union (EU) is a political and economic union of 28 member states that are located primarily in Europe. It has an area of 4,475,757 km2 (1,728,099 sq mi) and an estimated population of about 513 million. The EU has developed an internal single market through a standardised system of laws that apply in all member states in those matters, and only those matters, where members have agreed to act as one. EU policies aim to ensure the free movement of people, goods, services and capital within the internal market, enact legislation in justice and home affairs and maintain common policies on trade, agriculture, fisheries and regional development. For travel within the Schengen Area, passport controls have been abolished. A monetary union was established in 1999 and came into full force in 2002 and is composed of 19 EU member states which use the euro currency.

Summary

The Conservative Party retained control of the council with a majority of two seats. The Labour Party, who had in 2009 won a total of 3 seats, became the official opposition with a total of 12 seats.

Conservative Party (UK) Political party in the United Kingdom

The Conservative Party, officially the Conservative and Unionist Party, is a centre-right political party in the United Kingdom. Presently led by Theresa May, it has been the governing party since 2010. It presently has 314 Members of Parliament in the House of Commons, 249 members of the House of Lords, and 18 members of the European Parliament. It also has 31 Members of the Scottish Parliament, 12 members of the Welsh Assembly, eight members of the London Assembly and 9,008 local councillors. One of the major parties of UK politics, it has formed the government on 45 occasions, more than any other party.

The Labour Party is a centre-left political party in the United Kingdom which has been described as an alliance of social democrats, democratic socialists and trade unionists. The party's platform emphasises greater state intervention, social justice and strengthening workers' rights. Labour is a full member of the Party of European Socialists and Progressive Alliance, and holds observer status in the Socialist International. As of 2017, the party was considered the "largest party in Western Europe" in terms of party membership, with more than half a million members.

UKIP became the third largest party, gaining 4 seats. The Liberal Democrats, who formed the official opposition prior to the election, won three seats, a net loss of five.

UK Independence Party British political party

The UK Independence Party is a hard Eurosceptic, right-wing political party in the United Kingdom. It currently has one representative in the House of Lords and seven Members of the European Parliament (MEPs). It has four Assembly Members (AMs) in the National Assembly for Wales and one member in the London Assembly. The party reached its greatest level of success in the mid-2010s, when it gained two Members of Parliament and was the largest UK party in the European Parliament.

Liberal Democrats (UK) Political party in the United Kingdom

The Liberal Democrats are a liberal, centrist political party in the United Kingdom. They presently have 11 Members of Parliament in the House of Commons, 96 members of the House of Lords, and one member of the European Parliament. They also have five Members of the Scottish Parliament and a member each in the Welsh Assembly and London Assembly. The party reached the height of its influence in the early 2010s, forming a junior partner in a coalition government from 2010 to 2015. It is presently led by Vince Cable.

The Independent Kidderminster Hospital and Health Concern and the Green Party both won two seats, while the Wythall Residents Association and continuation Liberal Party won one seat each.

Green Party of England and Wales Political party in England and Wales

The Green Party of England and Wales is a green, left-wing political party in England and Wales. Headquartered in London, since September 2018, its Co-Leaders are Siân Berry and Jonathan Bartley. The Green Party has one Member of Parliament in the House of Commons, one representative in the House of Lords, and three Members of the European Parliament. It has various councillors in UK local government and two members of the London Assembly.

Wythall village in United Kingdom

Wythall is a village and civil parish in the Bromsgrove District, in the north-east corner of the county of Worcestershire, England. Wythall parish borders Solihull and Birmingham, and had a population of 11,377 in the UK census of 2001.

Liberal Party (UK, 1989) political party of the United Kingdom, from 1989

The Liberal Party is a British political party that was founded in 1989 by members of the original Liberal Party opposed to its merger with the Social Democratic Party (SDP) to form the Liberal Democrats. The party holds seven local council seats.

Results

Worcestershire County Council Election Overall Result 2013
PartySeatsGainsLossesNet gain/lossSeats %Votes %Votes+/−
  Conservative 30
  Labour 12
  UKIP 4
  Liberal Democrat 3
  Health Concern 2
  Green 2
  Liberal 1
 Wythall Residents Association1
  Independent 2
  TUSC 0

Results by electoral division

Bromsgrove

Malvern Hills

Redditch Borough

Arrow Valley East (2 seats)
PartyCandidateVotes%
Conservative Juliet Brunner1,17612.4
Conservative Gay Hopkins98910.4
Labour Joseph Baker1,54316.2
Labour Philip Mould1,42615.0
Liberal Democrat Simon Oliver1711.8
Liberal Democrat David Gee1982.1
Green Emma Bradley1882.0
Green Lee Bradley1281.3
UKIP Martin Jenkins1,79218.9
UKIP Patricia Stickley1,51115.9
BNP Ashley Bradley1641.7
Independent Paul Swansborough2132.2
Turnout
Arrow Valley West (2 seats)
PartyCandidateVotes%
Conservative Tom Baker-Price98513.2
Conservative Kathy Haslam87711.8
Labour Andrew Fry1,75223.5
Labour Pattie Hill1,60421.5
Liberal Democrat Anthony Pitt2152.9
Liberal Democrat Ian Webster1972.6
Green Kevin White2633.5
Green Rylma White1692.3
UKIP Scott Preston1,39518.7
Turnout
Redditch North (2 seats)
PartyCandidateVotes%
Conservative David Thain1,10913.0
Conservative Brandon Clayton1,21914.3
Labour Robin Lunn1,59518.7
Labour Graham Vickery1,59818.8
Liberal Democrat Diane Thomas1451.7
Liberal Democrat John Stanley1331.6
Green Louise Deveney2212.6
Green Bev Minto1431.7
UKIP Chris Harrison1,18313.9
UKIP Matthew Headford1,16413.7
Turnout
Redditch South (2 seats)
PartyCandidateVotes%
Conservative Phillip Gretton1,66317.2
Conservative Jane Potter1,59416.5
Labour John Witherspoon1,20012.4
Labour Everton Ebanks1,31213.6
Liberal Democrat Rita Hindle2182.3
Liberal Democrat Edward Kilworth1521.6
Green Rosemary Kerry2662.8
Green Alistair Waugh1841.9
UKIP Stuart Cross1,65217.1
UKIP Paul White1,40214.5
Turnout

Worcester City

Wychavon

Bowbrook
PartyCandidateVotes%
Conservative Tony Miller
Labour Sheila Seabourne
Liberal Democrat John Littlechild
UKIP Yuleen Jewell
Turnout
Bredon
PartyCandidateVotes%
Conservative Adrian Hardman
Labour John Egan
Liberal Democrat Charles Tucker
UKIP Harvey Vivian
Turnout
Broadway
PartyCandidateVotes%
Conservative Liz Eyre
Labour Gaynor Pritchard
Liberal Democrat Diana Brown
Turnout
Droitwich East
PartyCandidateVotes%
Conservative Pam Davey
Labour Edgar Harwood
Liberal Democrat Margaret Rowley
Green Rob Burkett
Independent Nicole Carrol
Turnout
Droitwich West
PartyCandidateVotes%
Conservative Lynne Duffy
Labour Jenny Barnes
Liberal Democrat David Rowe
UKIP Neil Whelan
Turnout
Evehsam North West
PartyCandidateVotes%
Conservative John Smith
Labour Steven Moralee
Liberal Democrat Timothy Haines
UKIP Ellis Tustin
Turnout
Evesham South
PartyCandidateVotes%
Conservative Bob Banks
Labour Alan Mason
Liberal Democrat Julie Haines
BNP Liam Hartland
Turnout
Harvington
PartyCandidateVotes%
Conservative Clive Holt
Labour Michael Worral
Turnout
Littletons
PartyCandidateVotes%
Conservative Alastair Adams
Labour Christine McDonald
Liberal Democrat Keith Wright
Turnout
Ombersley
PartyCandidateVotes%
Conservative Maurice Broomfield
Labour Maurice Harford
Liberal Democrat Peter Evans
UKIP Doug Ingram
Green Stephen Brown
Turnout
Pershore
PartyCandidateVotes%
Conservative George Mackison
Labour Ian Facer
Liberal Democrat Liz Tucker
UKIP Mark Starr
Turnout
Upton Snodsbury
PartyCandidateVotes%
Conservative Rob Adams
Labour Monica Fry
Liberal Democrat Greg Thomas
UKIP Richard Keel
Green Stephen Brohan
Turnout

Wyre Forest

Bewdley
PartyCandidateVotes%
Conservative John-Paul Campion
Labour George Court
Health Concern Derek Killingworth
UKIP Neil Jukes
Green Phil Oliver
Turnout
Chaddesley
PartyCandidateVotes%
Conservative Stephen Clee
Labour Gareth Webster
Health Concern Harry Grove
UKIP Bill Hopkins
Independent Helen Dyke
Turnout
Cookley, Wolverley, Wribbenhall
PartyCandidateVotes%
Conservative Gordon Yarranton
Labour Chris Nicholls
Health Concern Linda Candlin
Liberal Rachel Akathiotis
UKIP Peter Willoughby
Green Kate Spohrer
Turnout

Related Research Articles

2009 Suffolk County Council election

Elections to Suffolk County Council were held on 4 June 2009 as part of the 2009 United Kingdom local elections on the same day as the elections to the European Parliament. 75 councillors were elected from 63 electoral divisions, which returned either one or two county councillors each by first-past-the-post voting for a four-year term of office. The electoral divisions were the same as those used at the previous election in 2004.

2009 Cambridgeshire County Council election

An election to Cambridgeshire County Council took place on 4 June 2009 as part of the United Kingdom local elections, 2009. The election was delayed from 7 May to coincide with elections to the European Parliament. 69 councillors were elected from 60 electoral divisions, which returned either one or two county councillors each by first-past-the-post voting. The Conservative Party retained their majority on the council, while the Green Party and UKIP gained their first seats.

2009 Essex County Council election

An election to Essex County Council took place on 4 June 2009 as part of the United Kingdom local elections, 2009. The elections had been delayed from 7 May, to coincide with elections to the European Parliament. 75 councillors were elected from various electoral divisions, which returned either one or two county councillors each by first-past-the-post voting for a four-year term of office. The electoral divisions were the same as those used at the previous election in 2005.

2009 Hampshire County Council election

An election to Hampshire County Council took place on 4 June 2009 as part of the United Kingdom local elections, 2009, having been delayed from 7 May, to coincide with elections to the European Parliament. 78 councillors were elected from 75 electoral divisions, which returned either one or two county councillors each by first-past-the-post voting for a four-year term of office. The electoral divisions were the same as those used at the previous election in 2005. Elections in Portsmouth and Southampton do not coincide with this set, being unitary authorities outside the area covered by the County Council.

2009 Oxfordshire County Council election

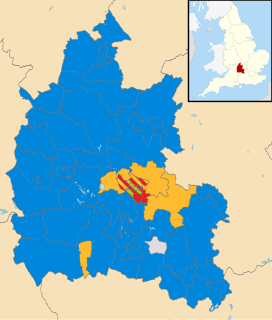
An election to Oxfordshire County Council took place on 4 June 2009 as part of the United Kingdom local elections, 2009, having been delayed from 7 May, to coincide with elections to the European Parliament. 73 councillors were elected from various electoral divisions, which returned either one, two or three county councillors each by first-past-the-post voting for a four-year term of office. The electoral divisions were the same as those used at the previous election in 2005.

2009 Somerset County Council election

An election to Somerset County Council took place on 4 June 2009 as part of the United Kingdom local elections, 2009, having been delayed from 7 May, to coincide with elections to the European Parliament. The result brought to an end 16 years of Liberal Democrat rule to a Conservative controlled administration. 58 councillors were elected from various electoral divisions, which returned one county councillor each. Members were elected by the first-past-the-post voting system for a four-year term of office. This was the last election before the number of seats was cut to 55 for the 2013 election. With a total of 58 seats being reduced to 55 for the next election.

2009 Staffordshire County Council election

Elections to Staffordshire County Council took place on 4 June 2009 as part of the United Kingdom local elections, 2009, having been delayed from 7 May, in order to coincide with elections to the European Parliament. 62 councillors were elected from the various electoral divisions, which returned either one or two county councillors each by first-past-the-post voting for a four-year term of office. The electoral divisions were the same as those used at the previous election in 2005. The council continues to be administered on the Leader and Cabinet model.

The 2012 City of Lincoln Council election took place on 3 May 2012 to elect one-third of the members of City of Lincoln Council in Lincolnshire, England, for a 4-year term of office. This was on the same day as other United Kingdom local elections, 2012.

2013 Cumbria County Council election

An election to Cumbria County Council took place on 2 May013 as part of the United Kingdom local elections, 2013. All 84 councillors were elected from electoral divisions which returned one county councillor each by first-past-the-post voting for a four-year term of office. Following an electoral review carried out by the Local Government Boundary Commission for England, newly drawn electoral divisions were used without change in the number of county councillors.

2013 Leicestershire County Council election

An election to Leicestershire County Council took place on 2 May 2013 as part of the United Kingdom local elections, 2013. 55 councillors were elected from 52 electoral divisions, which returned either one or two county councillors each by first-past-the-post voting for a four-year term of office. The Conservatives held control of the council with a reduced majority of 5 seats. Despite a strong challenge from UKIP, the party only gained 2 seats whilst the Liberal Democrats lost one seat and Labour recouped some of their 2009 losses, gaining 6 seats.

2013 West Sussex County Council election

The West Sussex County Council election, 2013 took place on 2 May 2013, as part of the United Kingdom local elections, 2013. All 71 electoral divisions were up for election, which returned one county councillor each by first-past-the-post voting for a four-year term of office. At this election, the Conservative Party was seeking to retain overall control of the council, and the Liberal Democrats to maintain their position as the main opposition party.

2013 East Sussex County Council election

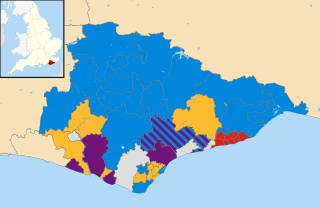
The East Sussex County Council election, 2013 took place on 2 May 2013 as part of the United Kingdom local elections, 2013. All 49 councillors of East Sussex County Council were elected from 44 electoral divisions, which return either one or two councillors each by first-past-the-post voting for a four-year term of office. The electoral divisions were the same as those used at the previous election in 2009. No elections were held in Brighton and Hove, which is a unitary authority outside the area covered by the County Council.

2013 Hampshire County Council election

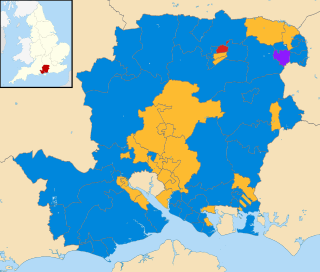
An election to Hampshire County Council took place on 2 May 2013 as part of the United Kingdom local elections, 2013. 78 councillors were elected from 75 electoral divisions, which returned either one or two county councillors each by first-past-the-post voting for a four-year term of office. The electoral divisions were the same as those of the previous election in 2009. No elections were held in Portsmouth and Southampton, which are unitary authorities outside the area covered by the County Council. The election saw the Conservative Party retain overall control of the council, with a reduced majority of five councillors.

2013 Lincolnshire County Council election

An election to Lincolnshire County Council took place on 2 May 2013 as part of the United Kingdom local elections, 2013. 77 electoral divisions returned one county councillor each by first-past-the-post voting for a four-year term of office. The electoral divisions were the same as those used at the previous election in 2009. No elections were held in North Lincolnshire or North East Lincolnshire, which are unitary authorities outside the area covered by the County Council.

2013 Hertfordshire County Council election

An election to Hertfordshire County Council took place on 2 May 2013 as part of the United Kingdom local elections, 2013. 77 electoral divisions elected one county councillor each by first-past-the-post voting for a four-year term of office. The electoral divisions were the same as those used at the previous election in 2009.

2013 Essex County Council election

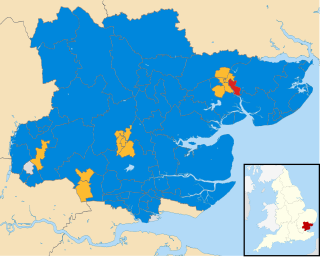
An election to Essex County Council took place on 2 May 2013 as part of the United Kingdom local elections, 2013. 75 councillors were elected from 70 electoral divisions, which returned either one or two county councillors each by first-past-the-post voting for a four-year term of office. The electoral divisions were the same as those used at the previous election in 2009. No elections were held in Thurrock or Southend-on-Sea, which are unitary authorities outside the area covered by the County Council.

2013 Staffordshire County Council election

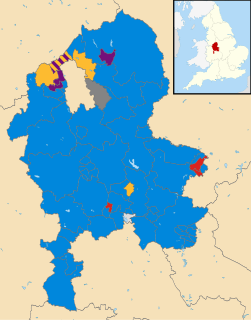
An election to Staffordshire County Council took place on 2 May 2013 as part of the United Kingdom local elections, 2013. 62 electoral divisions returned one county councillor each by first-past-the-post voting for a four-year term of office. Following a boundary review, new electoral division boundaries were established for this election. No elections were held in Stoke-on-Trent, which is a unitary authority outside the area covered by the County Council. The council continues to be administered on the Leader and Cabinet model.

2013 Suffolk County Council election

Elections to Suffolk County Council took place on 2 May 2013 as part of the United Kingdom local elections, 2013. 75 councillors were elected from 63 electoral divisions, which returned either one or two county councillors each by first-past-the-post voting for a four-year term of office. The electoral divisions were the same as those used at the previous election in 2009.

2013 Northamptonshire County Council election

An election to Northamptonshire County Council took place on 2 May 2013 as part of the United Kingdom local elections, 2013. Following a boundary review, the number of county councillors was reduced from 73 to 57 from this election. All members were elected by first-past-the-post voting from single-member electoral divisions for a four-year term of office. The Conservative Party held on to their overall majority, having held overall control of the council since 2005.

2017 Gloucestershire County Council election

The 2017 Gloucestershire County Council election took place on 4 May 2017 as part of the 2017 local elections in the United Kingdom. All 53 councillors were elected from electoral divisions which returned one county councillor each by first-past-the-post voting for a four-year term of office. Control of the council went from a Conservative Party minority to a majority administration.

References

  1. "The Representation of the People (Form of Canvass) (England and Wales) Regulations 2006, Schedule Part 1". Legislation.gov.uk. 13 October 2011. Retrieved 18 April 2012.
  2. "I have two homes. Can I register at both addresses?". The Electoral Commission. Retrieved 5 January 2011.