Cornwall Council election, 2013

Last updated

Cornwall Council election, 2013

Flag of Cornwall.svg


  2009 2 May 2013 2017  

All 123 seats to Cornwall Council
62 seats needed for a majority

 First partySecond partyThird party
  No image wide.svg No image wide.svg No image wide.svg
Party Independent Liberal Democrat Conservative
Last election32 seats, 23.1%38 seats, 28.2%50 seats, 33.8%
Seats won373631
Seat changeIncrease2.svg4Decrease2.svg2Decrease2.svg19
Popular vote30,89332,35534,191
Percentage21.9%23.0%24.3%
SwingDecrease2.svg1.2%Decrease2.svg5.2%Decrease2.svg9.5%

 Fourth partyFifth partySixth party
  No image wide.svg No image wide.svg No image wide.svg
Party Labour UKIP Mebyon Kernow
Last election0 seats, 3.4%0 seats, 3.8%3 seats, 4.3%
Seats won864
Seat changeIncrease2.svg8Increase2.svg6Increase2.svg1
Popular vote11,38321,3066,824
Percentage8.1%15.1%4.8%
SwingIncrease2.svg4.7%Increase2.svg11.3%Increase2.svg0.5%

Cornwall UK local election 2013 map.svg

Map showing the results of the 2013 Cornwall Council elections results by electoral division. Blue showing Conservative, Red showing Labour, Yellow showing Liberal Democrats, Purple showing UKIP, Grey showing Independents, "Old Gold" showing Mebyon Kernow and Green showing the Green Party.

Council control before election

No Overall Control

Council control after election

No Overall Control

The Cornwall Council election, 2013, was an election for all 123 seats on the council. Cornwall Council is a unitary authority that covers the majority of the ceremonial county of Cornwall, with the exception of the Isles of Scilly which have an independent local authority. The elections took place concurrently with other local elections across England and Wales.

Cornwall Council British administrative body

Cornwall Council is the unitary authority for the county of Cornwall in the United Kingdom, not including the Isles of Scilly, which has its own council. The council, and its predecessor Cornwall County Council, has a tradition of large groups of independent councillors, having been controlled by independents in the 1970s and 1980s. Since the 2013 elections, it is run by an Independent-Liberal Democrat coalition.

A unitary authority is a type of local authority that has a single tier and is responsible for all local government functions within its area or performs additional functions which elsewhere in the relevant country are usually performed by national government or a higher level of sub-national government.

Ceremonial counties of England Collective name for areas, in England, to which a Lord Lieutenant is appointed

The ceremonial counties, also referred to as the lieutenancy areas of England, are areas of England to which a Lord Lieutenant is appointed. Legally the areas in England, as well as in Wales and Scotland, are defined by the Lieutenancies Act 1997 as counties and areas for the purposes of the lieutenancies in Great Britain, in contrast to the areas used for local government. They are also informally known as geographic counties, as often representing more permanent features of English geography, and to distinguish them from counties of England which have a present-day administrative function.

Contents

Background

The elections for Cornwall Council were the second since its creation in 2009. Cornwall had previously been administered as a non-metropolitan county, with local government powers split between Cornwall County Council and the six non-metropolitan districts of Caradon, Carrick, Kerrier, North Cornwall, Penwith and Restormel. These were abolished as part of the 2009 structural changes to local government in England, which created a singular unitary authority. [1] The elections in 2009 resulted in no group gaining a majority. [2] The Conservative and Independent councillors formed a coalition to control the Council, choosing the Conservative Alec Robertson as the leader. [3]

Non-metropolitan county county-level entity in England that is not a metropolitan county

A non-metropolitan county, or colloquially, shire county, is a county-level entity in England that is not a metropolitan county. The counties typically have populations of 300,000 to 1.4 million. The term shire county is, however, an unofficial usage. Many of the non-metropolitan counties bear historic names and most end in the suffix "-shire" such as Wiltshire or Staffordshire. Of the remainder, some counties had the -shire ending and have lost it over time; such as Devon and Somerset. "Shire county" is, strictly, a dual-language tautology since the French-derived "county" means the same as the older Anglo-Saxon word "shire".

Non-metropolitan district Type of local government district in England

Non-metropolitan districts, or colloquially "shire districts", are a type of local government district in England. As created, they are sub-divisions of non-metropolitan counties in a two-tier arrangement.

Caradon

Caradon was a local government district in Cornwall, United Kingdom. It contained five towns: Callington, Liskeard, Looe, Saltash and Torpoint, and over 80 villages and hamlets within 41 civil parishes. Its District Council was based in Liskeard 50.453°N 4.465°W.

The Boundary Commission had undertaken a review of the Council's electoral divisions, which resulted in a number of changes to their boundaries and a reduction from 123 to 122 wards. One ward, Bude, would elect two councillors while the rest were represented by a single-member, leaving the number of councillors unchanged. All wards were contested in the election, with a total of 480 candidates standing across the county. [4] [5] The Conservatives had the most candidates with 103, followed by the Liberal Democrats with 91 and the United Kingdom Independence Party with 77 candidates. Labour fielded 68, Cornish party Mebyon Kernow had 27, the Green Party 23 and the Liberal Party stood one person. Ninety independents were also standing, with some wards having multiple independent candidates. [6]

The Local Government Boundary Commission for England (LGBCE) is a parliamentary body established by statute to conduct boundary, electoral and structural reviews of local government areas in England. The LGBCE is independent of government and political parties, and is directly accountable to the Speaker's Committee of the House of Commons.

Bude town in Cornwall, England

Bude is a small seaside resort town in north Cornwall, England, UK, in the civil parish of Bude-Stratton and at the mouth of the River Neet. It was sometimes formerly known as Bude Haven. It lies southwest of Stratton, south of Flexbury and Poughill, and north of Widemouth Bay and is located along the A3073 road off the A39. Bude is twinned with Ergué-Gabéric in Brittany, France. Bude's coast faces Bude Bay in the Celtic Sea, part of the Atlantic Ocean. The population of the civil parish can be found under Bude-Stratton.

Liberal Democrats (UK) Political party in the United Kingdom

The Liberal Democrats are a liberal political party in the United Kingdom. They presently have 11 Members of Parliament in the House of Commons, 96 members of the House of Lords, and one member of the European Parliament. They also have five Members of the Scottish Parliament and a member each in the Welsh Assembly and London Assembly. The party reached the height of its influence in the early 2010s, forming a junior partner in a coalition government from 2010 to 2015. It is presently led by Vince Cable.

Elections to town and parish councils across Cornwall were also scheduled to take place on 2 May. [7] However, not all council elections were contested, as the number of candidates was not greater than the seats available. Four parish councils with insufficient candidates would not have enough councillors to function after the elections. Councils that have vacancies after the elections would attempt to co-opt additional councillors. [8]

Co-option has two common meanings. It may refer to the process of adding members to an elite group at the discretion of members of the body, usually to manage opposition and so maintain the stability of the group. Outsiders are ‘co-opted’ by being given a degree of power on the grounds of their élite status, specialist knowledge, or potential ability to threaten essential commitments or goals.

Campaign

The campaign was set against the backdrop of the Great Recession of the late 2000s, under a Labour government, and the subsequent public sector budget cuts of the Conservative-Liberal Democrat coalition government. There were also many issues that were pertinent to local voters in Cornwall, including the building of new houses, wind turbines, transportation infrastructure, jobs losses at the authority and the recent Council Tax freeze. [9] [10]

Wind turbine device that converts wind energy into mechanical and electric energy

A wind turbine, or alternatively referred to as a wind energy converter, is a device that converts the wind's kinetic energy into electrical energy.

Council Tax

Council Tax is a local taxation system used in England, Scotland and Wales. It is a tax on domestic property which was introduced in 1993 by the Local Government Finance Act 1992, replacing the short lived Community Charge, which in turn replaced the domestic rates. Each property is assigned one of, eight bands in England and Scotland, or nine bands in Wales based on property value, and the tax is set as a fixed amount for each band. The more valuable the property, the higher the tax, except for properties valued above £320,000. Some property is exempt from the tax, some people are exempt from the tax, while some get a discount.

The Conservative Party, speculated to be facing losses, hoped to attract voters through their previous record as the major party in the outgoing Conservative-Independent council administration. [10]

The Liberal Democrats, trying to become the largest party within the council, focused its campaign on cutting economic waste and increasing investment in transport infrastructure. [10] [11]

Mebyon Kernow highlighted the fact that they were an alternative to the parties and groupings that had made up previous UK government or Cornwall Council administrations. [10]

UKIP, wanting to be seen as increasingly relevant to domestic politics, not just within Europe campaigned on issues of opposing the wind farm project and youth unemployment, but still highlighting its anti-EU stance. [12]

The Labour Party focused its campaign on the fact that, at the time, there was worry as to whether the UK government's Help to Buy scheme could be used to fund the buying of second homes in the county, [13] but was later announced to be untrue. [14] The party also pledged to keep Council Tax rates low. [15]

The Green Party campaigned on raising concerns over a proposed incinerator and overdeveloping land. [16]

Eligibility

All locally registered electors (British, Irish, Commonwealth and European Union citizens) who were aged 18 or over on Thursday 2 May 2013 were entitled to vote in the local elections. Those who were temporarily away from their ordinary address (for example, away working, on holiday, in student accommodation or in hospital) were also entitled to vote in the local elections, [17] although those who had moved abroad and registered as overseas electors cannot vote in the local elections. It is possible to register to vote at more than one address (such as a university student who had a term-time address and lives at home during holidays) at the discretion of the local Electoral Register Office, but it remains an offence to vote more than once in the same local government election. [18]

Composition before election

Elected in 2009Before election
PartySeatsPartySeats
Conservative 50 Conservative 46
Liberal Democrat 38 Liberal Democrat 37
Independent 32 Independent 28
Mebyon Kernow 3 Mebyon Kernow 6
Independent (non affiliated)0 Independent (non affiliated)2
Labour 0 Labour 1
Vacant 0 Vacant 3

Election result

Cornwall Council election, 2013 [19] [A] [B]
PartySeatsGainsLossesNet gain/lossSeats %Votes %Votes+/−
  Independent 37149Increase2.svg530.121.9%30,893Decrease2.svg1.2%
  Liberal Democrat 36810Decrease2.svg229.223.0%32,355Decrease2.svg5.2%
  Conservative 31419Decrease2.svg1925.224.3%34,191Decrease2.svg9.5%
  Labour 880Increase2.svg86.58.1%11,383Increase2.svg4.7%
  UKIP 660Increase2.svg64.915.1%21,306Increase2.svg11.3%
  Mebyon Kernow 412Increase2.svg13.254.8%6,824Increase2.svg0.5%
  Green 110Increase2.svg10.82.6%3,667Increase2.svg0.7%
  Liberal 000000.1%143Decrease2.svg0.5%
A The changes in party councillors in this table differs from that listed by the BBC because it is based purely on changes from the previous election, [20] not taking into account mid-term party defections or by-elections
A The Independent grouping consists of those that were declared as "Independent" on the ballot paper, as well as those with no specification. [21]

Outcome

Following the election the council remained in no overall control with the Independent politicians becoming the largest grouping on the council through a modest gain of councillors from the previous election. The Liberal Democrats remained the second largest party after losing 2 councillors and the Conservatives slipped to third after losing over a third of their councillors. [22] The Labour Party, UKIP, Mebyon Kernow and the Green Party all gained seats, with UKIP and the Greens entering Cornwall Council for the first time. [22] [23] Mebyon Kernow had had 6 seats prior to the election, having added 3 to their 2009 total, through defection and by-election. Following the election they held 4.

Within two weeks of the election the Conservative councillor for Ladock, St Clement and St Erme, Mike Eathorne-Gibbons, defected to the Independent grouping. Eathorne-Gibbons had been tipped to be the next leader of the Conservative group in the Council. [24] [25]

The Liberal Democrats reached out to all the other parties elected to Council, wanting to form a cross-party administration. [26] The Conservatives decided not to join the alliance, after a lack of communication, therefore the Independents and Liberal Democrats formed a coalition administration with John Pollard of the Independents being elected leader of the council and the Liberal Democrats Jeremy Rowe as deputy leader. [27] [28] The Green councillor and the Independent councillor for Probus, Tregony and Grampound, Bob Egerton, formed a non-aligned independent group. [29] The independent councillor for Wadebridge East, Collin Brewer, was not permitted to join the Independent grouping for his previous negative comments regarding disabled children. [30] Brewer later resigned from Cornwall Council and the Liberal Democrat, Steve Knightley, won the subsequent by-election. [31]

Electoral division results

The electoral division results listed below [32] are based on the changes from the 2009 elections, [33] not taking into account any mid-term by-elections or party defections.

Altarnun
PartyCandidateVotes%±
Conservative Vivian Hall38937.5-3.1
UKIP John Knights30929.8N/A
Liberal Democrat Sasha Gillard-Loft22922.1-1.7
Labour Geoff Hale11110.7N/A
Majority807.7+2.6
Turnout 1,03839.6-9.6
Conservative hold Swing
Bodmin St Leonard [BC 1]
PartyCandidateVotes%±
Liberal Democrat Pat Rogerson51762.1+12.3
UKIP Chris Wallis19923.9N/A
Labour David Acton738.8N/A
Conservative Peter Scoffham435.2-22.9
Majority31838.2+16.5
Turnout 83223.5-5.0
Liberal Democrat hold Swing
Bodmin St Mary's [BC 2]
PartyCandidateVotes%±
Liberal Democrat Ann Kerridge60256.4-8.3
UKIP Pete Walters21219.9N/A
Mebyon Kernow Roger Lashbrook17616.5N/A
Labour Janet Hulme777.2N/A
Majority39036.5+7.2
Turnout 1,06727.4-2.8
Liberal Democrat hold Swing
Bodmin St Petroc [BC 3]
PartyCandidateVotes%±
Liberal Democrat Steve Rogerson64956.1+7.7
UKIP John Masters18816.2N/A
Independent Lance Kennedy18115.6N/A
Mebyon Kernow John Gibbs13912.0N/A
Majority46139.8+36.6
Turnout 1,15729.6-3.1
Liberal Democrat gain from Conservative Swing
Breage, Germoe and Sithney [BC 4]
PartyCandidateVotes%±
Conservative John Keeling*56255.1N/A
UKIP Michael Mahon45844.9N/A
Majority10410.2
Turnout 1,02028.2
Conservative gain from Independent Swing
  • John Keeling was previously the Independent councillor for Breage
Bude [BC 5]
PartyCandidateVotes%±
Liberal Democrat David Parsons1,413
Liberal Democrat Nigel Pearce1,281
Conservative Louise Emo460
Turnout 3,28052.4
Liberal Democrat win (new seat)
Bugle
PartyCandidateVotes%±
Liberal Democrat Simon Rix31633.4-18.2
Conservative Rachel Beadle22623.9+0.8
Independent Steve Hopper15216.1N/A
Mebyon Kernow Jerry Jefferies13914.7-4.8
Labour Co-op David Doyle11412.0+6.2
Majority909.5-18.9
Turnout 94725.2-6.1
Liberal Democrat hold Swing
Callington
PartyCandidateVotes%±
Mebyon Kernow Andrew Long71260.6+6.1
UKIP Dave Williams32227.4N/A
Conservative Sally Ann Nicholson1079.1-18.0
Liberal Democrat Muriel June Merrett-Jones342.9-15.5
Majority39033.2+5.9
Turnout 1,17531.4-7.4
Mebyon Kernow hold Swing
Camborne Pendarves
PartyCandidateVotes%±
UKIP Harry Blakeley34031.8
Conservative David Atherfold31929.8
Mebyon Kernow John Gillingham21119.7
Labour Trevor Chalker20018.7
Majority212.0
Turnout 1,07032.1
UKIP win (new seat)
Camborne Roskear
PartyCandidateVotes%±
Conservative Paul White47539.1
Labour Co-op Jude Robinson43535.8
UKIP Tess Hulland23719.5
Mebyon Kernow John Rowe685.6
Majority403.3
Turnout 1,21535.1
Conservative win (new seat)
Camborne Trelowarren
PartyCandidateVotes%±
Conservative Jon Stoneman24330.3
UKIP Roger Laity22528.0
Labour Adam Crickett19724.5
Mebyon Kernow Zoe Fox10413.0
Green David Everett344.2
Majority182.2
Turnout 80323.6
Conservative win (new seat)
Camborne Treslothan
PartyCandidateVotes%±
Labour Robert Webber17819.8
UKIP Roy Appleton17119.0
Independent Nicholas Heather15116.8
Mebyon Kernow Alan Sanders14616.2
Conservative Morwenna Williams13615.1
Liberal Democrat Anna Pascoe616.8
Green Jacqueline Merrick586.4
Majority70.8
Turnout 90128.1
Labour win (new seat)
Camborne Treswithian
PartyCandidateVotes%±
UKIP Viv Lewis23226.6
Labour Steve Richards22025.2
Conservative Jeff Collins21624.8
Mebyon Kernow Mike Champion20423.4
Majority121.4
Turnout 87228.5
UKIP win (new seat)
Camelford
PartyCandidateVotes%±
Liberal Democrat Rob Rotchell45950.4+14.0
Conservative Keith Goodenough45249.6+6.5
Majority70.8
Turnout 91128.8
Liberal Democrat gain from Conservative Swing +3.8
Carharrack, Gwennap and St Day
PartyCandidateVotes%±
Independent Mark Kaczmarek79162.4
UKIP David Parker23418.5
Green Geoff Garbett13110.3
Labour Rosanna Phillips1118.8
Majority55744.0
Turnout 1,26732.7
Independent win (new seat)
Chacewater, Kenwyn and Baldhu [BC 6]
PartyCandidateVotes%±
Conservative John Dyer53452.3
Independent Ross Treseder26425.9
UKIP Michael Warren14614.3
Labour Peggy Wicks777.5
Majority27026.4
Turnout 1,02133.7
Conservative hold Swing
Constantine, Mawnan and Budock [BC 7]
PartyCandidateVotes%±
Conservative Neil Hatton85657.3
UKIP Lomond Handley43429.1
Labour Susan Webber20313.6
Majority42228.3
Turnout 1,49338.6
Conservative hold Swing
Crowan and Wendron [BC 8]
PartyCandidateVotes%±
Mebyon Kernow Loveday Jenkin*75154.9
Conservative Linda Taylor29021.2
Independent David Knight22716.6
Labour Jackie Harding1007.3
Majority46133.7
Turnout 1,36832.1
Mebyon Kernow gain from Independent Swing
  • Loveday Jenkin had won a by-election for Wendron during the previous Council
Falmouth Arwenack [BC 9]
PartyCandidateVotes%±
Conservative Geoffrey Evans62468.9
Labour Robin Johnson18019.9
Liberal Democrat Catherine Thornhill10211.3
Majority44449.0
Turnout 90630.9
Conservative hold Swing
Falmouth Boslowick
PartyCandidateVotes%±
Conservative Alan Jewell28923.0
Independent Steve Eva27421.9
Liberal Democrat Roger Bonney26220.9
UKIP Mairi Hayworth23718.9
Labour Nicholas Jemmett19215.3
Majority151.2
Turnout 1,25433.5
Conservative gain from Independent Swing
Falmouth Penwerris
PartyCandidateVotes%±
Labour Co-op Hanna Toms36136.2
Independent Grenville Chappel28328.4
Independent John Body18318.4
UKIP Amanda Wymer16917.0
Majority787.8
Turnout 99627.5
Labour Co-op gain from Independent Swing
Falmouth Smithick [BC 10]
PartyCandidateVotes%±
Labour Co-op Candy Atherton 31633.4
Independent Diana Merrett15616.5
Liberal Democrat Kenny Edwards15416.3
Conservative Liz Ashcroft13013.8
Independent Christopher Smith11512.2
Independent Tony Canton747.8
Majority16016.9
Turnout 94527.3
Labour Co-op gain from Independent Swing
Falmouth Trescobeas
PartyCandidateVotes%±
Independent David Saunby46238.4
Labour Co-op Brod Ross28523.7
UKIP Carole Douglas15412.8
Independent Vicky Eva13511.2
Conservative Peter Williams947.8
Green Euan McPhee433.6
Liberal Democrat Rhun Davies302.5
Majority17714.7
Turnout 1,20332.6
Independent hold Swing
Feock and Playing Place [BC 11]
PartyCandidateVotes%±
Conservative Steve Chamberlain80144.0
Independent Bob Richards70038.4
Liberal Democrat Christine Ryall18310.0
Labour Jayne Kirkham1387.6
Majority1015.5
Turnout 1,82246.9
Conservative hold Swing
Four Lanes
PartyCandidateVotes%±
UKIP Derek John Elliott23928.5
Conservative Peter Sheppard17320.6
Labour Matthew Brown16920.1
Liberal Paul Holmes14317.0
Mebyon Kernow Chris Lawrence11513.7
Majority667.9
Turnout 83924.5
UKIP win (new seat)
Fowey and Tywardreath
PartyCandidateVotes%±
Liberal Democrat David Hughes49037.8
Mebyon Kernow Fiona Carlyon47736.8
Conservative Adrian Howard Wildish32925.4
Majority131.0
Turnout 1,29638.1
Liberal Democrat win (new seat)
Grenville and Stratton [BC 12]
PartyCandidateVotes%±
Liberal Democrat Paula Dolphin86467.8-4.6
Conservative Shorne Tilbey41032.2+4.6
Majority45435.6
Turnout 1,27436.6
Liberal Democrat hold Swing -4.6
Gulval and Heamoor
PartyCandidateVotes%±
Liberal Democrat Mario Fonk88966.5
UKIP Rose Smith31723.7
Conservative Pamela Yeates1309.7
Majority57242.8
Turnout 1,33638.9
Liberal Democrat hold Swing
Gunnislake and Calstock [BC 13]
PartyCandidateVotes%±
Labour Dorothy Kirk47734.4
Conservative Russell Bartlett41830.1
UKIP Sam Gardner34124.6
Liberal Democrat Martin Emery15211.0
Majority594.3
Turnout 1,38837.6
Labour gain from Conservative Swing
Gwinear-Gwithian and St Erth
PartyCandidateVotes%±
Conservative Lionel Pascoe41430.1
UKIP Peter Channon31122.6
Independent Angelo Spencer-Smith24818.0
Independent Michael Roberts18313.3
Labour Michael Smith1188.6
Liberal Democrat Yvonne Bates614.4
Green Theresa Byrne423.1
Majority1037.5
Turnout 1,37737.2
Conservative hold Swing
Hayle North
PartyCandidateVotes%±
Independent John Pollard71665.4
UKIP Lynda Chidell26023.8
Labour Anthony Phillips11810.8
Majority45641.7
Turnout 1,09429.3
Independent hold Swing
Hayle South
PartyCandidateVotes%±
Independent John Coombe50344.7
UKIP Clive Polkinghorne32829.1
Labour Anne-Marie Rance18116.1
Independent Graham Coad11410.1
Majority17515.5
Turnout 1,12633.9
Independent hold Swing
Helston North
PartyCandidateVotes%±
Independent Phil Martin59044.2
Conservative Alec Robertson49437.0
UKIP Leonie Gough18413.8
Liberal Democrat Mollie Scrase685.1
Majority967.2
Turnout 1,33635.6
Independent gain from Conservative Swing
Helston South [BC 14]
PartyCandidateVotes%±
Independent Judith Haycock42739.3
Liberal Democrat John Martin21519.8
UKIP Scott Blandford21019.3
Conservative Tanya Dyer14113.0
Independent James Buchanan948.6
Majority21219.5
Turnout 1,08727.2
Independent hold Swing
Illogan
PartyCandidateVotes%±
Conservative Terry Wilkins33128.8
Mebyon Kernow Stephen Richardson29025.2
UKIP Don Armstrong25922.5
Liberal Democrat David Raymond Ekinsmyth15713.7
Labour Linda Moore1139.8
Majority413.6
Turnout 1,15030.4
Conservative hold Swing
Ladock, St Clement and St Erme
PartyCandidateVotes%±
Conservative Mike Eathorne-Gibbons66657.4
Green Jo Poland23420.2
Liberal Democrat Ian Jones17114.7
Labour Stuart Venison897.7
Majority43237.2
Turnout 1,16032.6
Conservative hold Swing
Lanivet and Blisland [BC 15]
PartyCandidateVotes%±
Liberal Democrat Chris Batters53247.5
UKIP Tom Hobbs40336.0
Green Steve Haynes18516.5
Majority12911.5
Turnout 1,12034.1
Liberal Democrat gain from Conservative Swing
Lanner and Stithians
PartyCandidateVotes%±
Independent John Thomas44133.3
Independent Neil Plummer39930.1
Independent James Biscoe19514.7
UKIP Bob Mims14010.6
Labour Laura Eyre856.4
Independent Peter Tisdale665.0
Majority423.2
Turnout 1,32634.2
Independent win (new seat)
Launceston Central
PartyCandidateVotes%±
Liberal Democrat Alex Folkes55170.8
Conservative Philip Tucker13417.2
Labour Kris Roberts9312.0
Majority41753.6
Turnout 77825.9
Liberal Democrat hold Swing
Launceston North and North Petherwin [BC 16]
PartyCandidateVotes%±
Liberal Democrat Adam Paynter76951.6
UKIP Graham Ford36424.4
Conservative Bill Sowerby20613.8
Independent Max Richard Hailey795.3
Independent Krystyna Zdan-Michajlowicz734.9
Majority40527.2
Turnout 1,49139.3
Liberal Democrat hold Swing
Launceston South
PartyCandidateVotes%±
Liberal Democrat Jade Lynne Farrington45245.5
UKIP James Alan Wonnacott23924.1
Independent John Charles Conway21121.2
Labour Susan Roberts Alfar919.2
Majority21321.5
Turnout 99334.4
Liberal Democrat hold Swing
Lelant and Carbis Bay
PartyCandidateVotes%±
Conservative Liz Penhaligon39334.7
UKIP Sandy Martin25622.6
Green Maxine Armstrong15613.8
Independent Richard Glanville11410.1
Liberal Democrat Howard Hollingsbee1129.9
Labour Graham Webster1029.0
Majority13712.1
Turnout 1,13335.6
Conservative hold Swing
Liskeard East [BC 17]
PartyCandidateVotes%±
Independent Sally Jane Hawken33433.5
Liberal Democrat Tony Powell28328.4
UKIP Oliver John Challis23523.6
Conservative John Gerrard Stevenson14514.5
Majority515.1
Turnout 99726.1
Independent gain from Liberal Democrat Swing
Liskeard North
PartyCandidateVotes%±
Independent Roger Graeme Holmes15129.0
Liberal Democrat Jan Powell*14527.8
Conservative Thusha Balalojanan11522.1
UKIP Jenifer Grace Lucas11021.1
Majority61.2
Turnout 52136.1
Independent gain from Conservative Swing
  • Previous councillor Jan Powell had defected from the Conservatives to join the Liberal Democrats in June 2011 [35]
Liskeard West and Dobwalls [BC 18]
PartyCandidateVotes%±
Liberal Democrat Michael George79668.0
UKIP Patricia Kareen Mary Marris37532.0
Majority42136.0
Turnout 1,17134.7
Liberal Democrat hold Swing
Looe East
PartyCandidateVotes%±
Independent Armand Toms*68758.6
Conservative James Stephen Gowing22519.2
UKIP Les Richmond18315.6
Green Rick Harmes474.0
Liberal Democrat Sandra Margaret Preston302.6
Majority46239.4
Turnout 1,17242.2
Independent gain from Conservative Swing
  • Previous councillor Armand Toms defected from the Conservatives to join the Independents in March 2013 [36]
Looe West, Lansallos and Lanteglos [BC 19]
PartyCandidateVotes%±
Liberal Democrat Edwina Hannaford96351.0
Conservative Brian Galipeau52327.7
UKIP Tony Winter40221.3
Majority44023.3
Turnout 1,88848.2
Liberal Democrat hold Swing
Lostwithiel
PartyCandidateVotes%±
Conservative Benedicte Poula Gwyneth Bay44235.6
UKIP Nigel Andrew Challis35428.5
Independent Graham Thomas Jarrett33426.9
Liberal Democrat Marian Oldor Candy1139.1
Majority887.1
Turnout 1,24336.6
Conservative hold Swing
Ludgvan
PartyCandidateVotes%±
Conservative Roy Mann47740.2
UKIP Robert Smith42635.9
Green Ian Flindall28323.9
Majority514.3
Turnout 1,18634.7
Conservative gain from Independent Swing
Lynher [BC 20]
PartyCandidateVotes%±
UKIP Stephanie McWilliam46935.0
Conservative Finbar John Heely39129.2
Liberal Democrat Christine Joy Hordley38829.0
Independent Alan William Neal916.8
Majority785.8
Turnout 1,33937.8
UKIP gain from Liberal Democrat Swing
Mabe, Perranarworthal and St Gluvias [BC 21]
PartyCandidateVotes%±
UKIP Michael Keogh41328.6
Conservative Chris Ridgers41028.4
Liberal Democrat John Ault33122.9
Independent Christopher Jackson16011.1
Labour Betty Ross1298.9
Majority30.2
Turnout 1,44339.7
UKIP gain from Conservative Swing
Marazion and Perranuthoe [BC 22]
PartyCandidateVotes%±
Conservative Sue Nicholas57841.9
UKIP Glyn Owen51137.1
Green Peter Williams28921.0
Majority674.9
Turnout 1,37837.0
Conservative hold Swing
Menheniot
PartyCandidateVotes%±
Conservative Bernie Ellis54938.0
UKIP David Clue45031.2
Liberal Democrat Charles Robert Boney35224.4
Green Richard John Sedgley936.4
Majority996.9
Turnout 1,44445.7
Conservative hold Swing
Mevagissey
PartyCandidateVotes%±
Labour Michael Bunney39129.7
UKIP Michael Williams36427.6
Conservative James Michael Mustoe31624.0
Liberal Democrat Ella Jill Westland18414.0
Green Katherine Moseley624.7
Majority282.1
Turnout 1,31640.5
Labour gain from Conservative Swing
Mount Charles
PartyCandidateVotes%±
Independent Gary James King31237.0
Conservative Anne Rachel Double22126.2
Independent Shirley Polmounter15318.1
Labour Paul David Roberts10212.1
Liberal Democrat Eileen Rix566.6
Majority9110.8
Turnout 84423.9
Independent gain from Liberal Democrat Swing
Mount Hawke and Portreath
PartyCandidateVotes%±
Liberal Democrat Joyce Duffin80866.7
UKIP Eileen Lewis28123.2
Labour Phillip Knight12310.1
Majority52743.5
Turnout 1,21233.4
Liberal Democrat hold Swing
Mullion and Grade-Ruan
PartyCandidateVotes%±
Independent Carolyn Rule57748.0
UKIP Nina Sutherland34128.3
Conservative Alfred Mesropians28523.7
Majority23619.7
Turnout 1,20335.9
Independent gain from Conservative Swing
Newlyn and Goonhavern
PartyCandidateVotes%±
Conservative Lisa Shuttlewood55546.2
Mebyon Kernow Rod Toms52944.0
Labour Meg Tremayne1189.8
Majority262.2
Turnout 1,20231.1
Conservative hold Swing
Newlyn and Mousehole
PartyCandidateVotes%±
Conservative Roger Harding69547.9
UKIP Tracy Smith26518.3
Green George Ford15911.0
Labour Nicholas Round15911.0
Independent Nigel Davis926
Liberal Democrat Caroline White826.3
Majority43029.4
Turnout 1,45240.4
Conservative hold Swing
Newquay Central
PartyCandidateVotes%±
Liberal Democrat Geoff Brown26752.3
Independent Steven Charles Slade24447.7
Majority234.5
Turnout 51117.6
Liberal Democrat hold Swing
Newquay Pentire
PartyCandidateVotes%±
Liberal Democrat Joanna Nora Kenny51664.8
Conservative Lyndon Spencer Harrison28035.2
Majority23629.6
Turnout 79625.6
Liberal Democrat hold Swing
Newquay Treloggan
PartyCandidateVotes%±
Liberal Democrat Dave Sleeman38454.0
Conservative Kevin Towill32746.0
Majority578.0
Turnout 71122.0
Liberal Democrat hold Swing
Newquay Tretherras
PartyCandidateVotes%±
Conservative Patrick Lambshead29235.6
Liberal Democrat George Edwards26932.8
UKIP Doris Latham26031.7
Majority232.8
Turnout 82126.9
Conservative hold Swing
Newquay Treviglas
PartyCandidateVotes%±
UKIP Mark Hicks26630.3
Conservative Andy Hannan23727.0
Liberal Democrat Sandy Carter21824.9
Labour Joan Bowden15617.8
Majority293.3
Turnout 87727.5
UKIP gain from Independent Swing
Padstow
PartyCandidateVotes%±
Liberal Democrat Richard Buscombe67653.4
Conservative Stephen Rushworth58946.6
Majority876.9
Turnout 1,26538.5
Liberal Democrat gain from Conservative Swing
Par and St Blazey Gate
PartyCandidateVotes%±
Liberal Democrat Douglas Scrafton35539.6
Conservative Richard Pears27931.1
Independent Alison Jane Watkins26329.3
Majority768.5
Turnout 89728.9
Liberal Democrat win (new seat)
Penryn East and Mylor
PartyCandidateVotes%±
Conservative Tony Martin34323.3
Independent John Symons32722.2
Liberal Democrat Judith Whiteley32021.7
UKIP Paula Clements26818.2
Labour Miriam Venner1248.4
Mebyon Kernow David Garwood926.2
Majority161.1
Turnout 1,47435.6
Conservative hold Swing
Penryn West
PartyCandidateVotes%±
Independent Mary May39942.6
Liberal Democrat Cait Hutchings26127.9
UKIP Martin Orders18319.6
Labour Jim Lloyd-Davies939.9
Majority13814.7
Turnout 93626.2
Independent hold Swing
Penwithick and Boscoppa [BC 23]
PartyCandidateVotes%±
Mebyon Kernow Matthew John Luke35643.6
Liberal Democrat Christopher Rowe29536.2
Conservative Jamie Hanlon16520.2
Majority617.5
Turnout 81623.7
Mebyon Kernow gain from Liberal Democrat Swing
Penzance Central
PartyCandidateVotes%±
Labour Cornelius Olivier39831.4
Liberal Democrat Penny Young35427.9
UKIP Peter Mates17814.0
Independent John Moreland15812.5
Conservative Michael Rabbitte12710.0
Mebyon Kernow Phillip Rendle534.2
Majority443.5
Turnout 1,26838.6
Labour gain from Liberal Democrat Swing
Penzance East
PartyCandidateVotes%±
Labour Tim Dwelly37830.6
Liberal Democrat Ruth Lewarne35829.0
UKIP Mick Faulkner19415.7
Conservative Angela Elliott12410.0
Mebyon Kernow Rob Simmons917.4
Green Michelle Paine897.2
Majority201.6
Turnout 1,23435.9
Labour gain from Liberal Democrat Swing
Penzance Promenade
PartyCandidateVotes%±
Independent Jim McKenna48433.4
Liberal Democrat Daniel Garside36825.4
Labour John Kirman28319.5
UKIP Elizabeth Shore19813.6
Conservative David Miles1188.1
Majority1168.0
Turnout 1,45145.7
Independent hold Swing
Perranporth
PartyCandidateVotes%±
Independent Michael Callan83264.9
Mebyon Kernow Paul Dunbar17113.3
Conservative Lisa Marshall14311.2
Independent Mark Langdon755.9
Labour Simon Coley614.8
Majority66151.6
Turnout 1,28233.9
Independent hold Swing
Pool and Tehidy
PartyCandidateVotes%±
Labour Malcom Moyle34441.4
Conservative Clive Bramley24429.4
UKIP Brenda Blakeley24229.2
Majority10012.0
Turnout 83025.6
Labour win (new seat)
Porthleven and Helston West [BC 24]
PartyCandidateVotes%±
Independent Andrew Wallis70665.0
Conservative Liz Lane18917.4
UKIP Stephen Gough15614.4
Liberal Democrat Richard Goedegebuur353.2
Majority51747.6
Turnout 1,08631.9
Independent hold Swing
Poundstock
PartyCandidateVotes%±
Liberal Democrat Nicky Chopak48737.1
Conservative Andrew Vernon Ades44934.2
Mebyon Kernow Paul Sousek20615.7
Independent Rupert Powell17113.0
Majority382.9
Turnout 1,31335.9
Liberal Democrat gain from Conservative Swing
Probus, Tregony and Grampound [BC 25]
PartyCandidateVotes%±
Independent Bob Egerton90366.1
UKIP Steve Kendall28320.7
Conservative Sean Marshall13810.1
Labour Norman Roach423.1
Majority62045.4
Turnout 1,36642.4
Independent hold Swing
Rame Peninsular [BC 26]
PartyCandidateVotes%±
Independent George Trubody53628.1
Conservative Chris Wilton53328.0
UKIP Peter John McLaren52427.5
Liberal Democrat Becky Lingard31216.4
Majority30.2
Turnout 1,90548.8
Independent gain from Conservative Swing
Redruth Central
PartyCandidateVotes%±
Conservative Mike Eddowes25740.3
UKIP Wally Duncan22134.6
Labour Raymond Webber16025.1
Majority365.6
Turnout 63820.9
Conservative hold Swing
Redruth North
PartyCandidateVotes%±
Independent Lisa Dolley44341.2
Labour Robert Barnes36534.0
UKIP Ann Wood26624.8
Majority787.3
Turnout 1,07422.9
Independent hold Swing
Redruth South
PartyCandidateVotes%±
Independent Ian Thomas34241.4
Labour Will Tremayne31137.7
UKIP Ray Wyse17320.9
Majority313.8
Turnout 82627.0
Independent hold Swing
Roche
PartyCandidateVotes%±
Independent John Wood44852.6
Mebyon Kernow Brian John Higman33639.5
Conservative Derek Robert Walker677.9
Majority11213.2
Turnout 85127.8
Independent hold Swing
Roseland
PartyCandidateVotes%±
Independent Julian German97667.5
Conservative Frederick Greenslade25217.4
UKIP Elizabeth Coleman17512.1
Labour Callum Macleod422.9
Majority72450.1
Turnout 1,44547.8
Independent hold Swing
Saltash East [BC 27]
PartyCandidateVotes%±
Independent Derek Alan Holley87080.5
Conservative David Ward13912.9
Liberal Democrat James Alexander Shepherd726.7
Majority73167.6
Turnout 1,08132.2
Independent hold Swing
Saltash North [BC 28]
PartyCandidateVotes%±
Independent Joe Ellison37245.6
Liberal Democrat Denise Watkins27033.1
Independent John Joseph Brady17421.3
Majority10212.5
Turnout 81625.3
Independent gain from Liberal Democrat Swing
Saltash South [BC 29]
PartyCandidateVotes%±
Liberal Democrat Hilary Anne Frank68570.3
Conservative Beryl Rosekilly28929.7
Majority39640.7
Turnout 97429.6
Liberal Democrat hold Swing
Saltash West [BC 30]
PartyCandidateVotes%±
Liberal Democrat Bob Austin62862.5
Conservative Gloria Mary Challen37737.5
Majority25125.0
Turnout 1,00529.1
Liberal Democrat hold Swing
St Agnes
PartyCandidateVotes%±
Liberal Democrat Pete Mitchell61352.9
Conservative Dawn Brown39834.4
Labour Robert Harrison14712.7
Majority21518.6
Turnout 1,15831.4
Liberal Democrat hold Swing
St Austell Bay
PartyCandidateVotes%±
Conservative Tom French58246.3
Independent Anne Langley54643.4
Labour Maggi Pitches12910.3
Majority362.9
Turnout 1,25734.1
Conservative hold Swing
St Austell Bethel
PartyCandidateVotes%±
Liberal Democrat Malcolm Alan Brown27627.0
Independent Graham Eric Walker*26425.8
Conservative Bob Davidson19419.0
UKIP Ian Proctor17316.9
Labour Co-op Brendan Parkinson11511.3
Majority121.2
Turnout 1,02227.5
Liberal Democrat hold Swing
  • Previous councillor Graham Eric Walker had defected from the Liberal Democrats to join the Independents in May 2012 [37]
St Austell Gover
PartyCandidateVotes%±
Independent Sandra Elizabeth Heyward47553.3
Conservative Jenny Stewart29032.5
Labour Ann Mary Phillips12614.1
Majority18520.8
Turnout 89126.1
Independent gain from Conservative Swing
St Austell Poltair
PartyCandidateVotes%±
Liberal Democrat Jackie Bull32535.6
Conservative Adam William Harris23225.4
Mebyon Kernow Derek Charles Collins18720.5
Labour Co-op Andrea Hilary Lanxon16818.4
Majority9310.2
Turnout 91227.6
Liberal Democrat gain from Conservative Swing
St Blazey [BC 31]
PartyCandidateVotes%±
Liberal Democrat Roy Taylor31040.1
Labour Stuart David Wheeler18624.1
Independent Liam John Bellamy17222.3
Conservative Peter Sinclair10513.6
Majority12416.0
Turnout 77324.0
Liberal Democrat hold Swing
St Buryan
PartyCandidateVotes%±
Conservative Bill Maddern60840.5
Independent Norman Bliss42928.5
Labour Juliet Eavis20613.7
Green Peter Hardy15010.0
Liberal Democrat Frank Blewett1107.3
Majority17911.9
Turnout 1,50340.9
Conservative hold Swing
St Cleer
PartyCandidateVotes%±
Liberal Democrat Derris Rosslyn Watson46332.2
UKIP David Garth Lucas34824.2
Independent Len Clark34123.7
Conservative Lisa Jane Sargeant28820.0
Majority1158.0
Turnout 1,44039.6
Liberal Democrat hold Swing
St Columb Major [BC 32]
PartyCandidateVotes%±
Independent Pat Harvey58655.3
Conservative John Bell20419.2
Liberal Democrat Alvin Augustus Martin19318.2
Labour Debbie Hopkins777.3
Majority38236.0
Turnout 1,06028.3
Independent hold Swing
St Dennis and Nanpean [BC 33]
PartyCandidateVotes%±
Independent Fred Greenslade51872.4
Independent Kim Wonnacott15421.5
Conservative Barbara Hannan436.0
Majority36450.9
Turnout 71521.0
Independent hold Swing
St Dominick, Harrowbarrow and Kelly Bray [BC 34]
PartyCandidateVotes%±
Conservative Jim Flashman47736.2
UKIP Dave Lawson37128.1
Independent Phillip Edward Lawrence Harriman19314.6
Mebyon Kernow Maria Coakley13910.5
Liberal Democrat Charles Andrew Merrett Jones13810.5
Majority1068.0
Turnout 1,31838.0
Conservative hold Swing
St Enoder
PartyCandidateVotes%±
Mebyon Kernow Dick Cole 83486.9
Independent Elizabeth Hawken12613.1
Majority70873.8
Turnout 96027.0
Mebyon Kernow hold Swing
St Germans and Landulph [BC 35]
PartyCandidateVotes%±
Conservative Daniel Richard Pugh42531.5
UKIP Joseph Anthony Cummins38428.4
Liberal Democrat Jesse Foot37027.4
Independent Mervyn Richard Ellis17112.7
Majority413.0
Turnout 1,35038.9
Conservative hold Swing
St Issey and St Tudy [BC 36]
PartyCandidateVotes%±
Liberal Democrat Jeremy Charles Rowe60153.3
Independent Emma Karenza Hambly52646.7
Majority756.7
Turnout 1,12732.9
Liberal Democrat hold Swing
St Ives East [BC 37]
PartyCandidateVotes%±
Green Tim Andrewes47137.3
Conservative Joan Symons33926.8
Independent Morag Robertson18214.4
UKIP Roy Britton17013.5
Labour Terry Murray705.5
Liberal Democrat Madie Parkinson-Evans312.5
Majority13210.5
Turnout 1,26341.2
Green gain from Conservative Swing
St Ives West [BC 38]
PartyCandidateVotes%±
Independent Andrew Mitchell30827.9
Green Ron Tulley30127.3
UKIP Stuart Guppy19417.6
Conservative Joan Tanner12411.2
Labour Malcolm Hurst11110.1
Liberal Democrat Lester Scott666.0
Majority70.6
Turnout 1,10434.1
Independent gain from Conservative Swing
St Just In Penwith
PartyCandidateVotes%±
Liberal Democrat Sue James57436.6
Independent Kevin McFadden33221.2
UKIP Adrian Smith30419.4
Labour Kirsty Pritchard25116.0
Conservative David Lenaghan1066.8
Majority24215.4
Turnout 1,56741.2
Liberal Democrat gain from Independent Swing
St Keverne and Meneage
PartyCandidateVotes%±
Conservative Walter Sanger63140.5
Green Dominic Brandreth50232.2
UKIP Brian Bailey35522.8
Labour Ann Round694.4
Majority1298.3
Turnout 1,55738.3
Conservative gain from Independent Swing
St Mawgan and Colan [BC 39]
PartyCandidateVotes%±
Conservative John Fitter58876.1
Mebyon Kernow Rob Poole18523.9
Majority40352.1
Turnout 77328.3
Conservative hold Swing
St Mewan
PartyCandidateVotes%±
Independent Malcolm Harvey Harris36736.6
Conservative John Edward Charles Kneller32332.2
Liberal Democrat Janet Hazel Lockyer31231.1
Majority444.4
Turnout 1,00232.7
Independent gain from Liberal Democrat Swing
St Minver and St Endellion [BC 40]
PartyCandidateVotes%±
Independent Andy Penny45542.1
Conservative Brian Allan Gisbourne43940.6
Liberal Democrat Ed Headley-Hughes18617.2
Majority161.5
Turnout 1,08042.0
Independent gain from Conservative Swing
St Stephen-In-Brannel [BC 41]
PartyCandidateVotes%±
Independent Des Curnow63665.8
UKIP Keith Hickman33134.2
Majority30531.5
Turnout 96725.6
Independent hold Swing
St Teath and St Breward [BC 42]
PartyCandidateVotes%±
Independent John Lugg62851.5
Liberal Democrat Eddie Jones38831.8
Conservative Henry Hine20416.7
Majority24019.7
Turnout 1,22037.7
Independent hold Swing
Stokeclimsland
PartyCandidateVotes%±
Independent Neil Hillson Burden81062.0
UKIP Antonia Mary Damaris Willis27220.8
Conservative John Phillips1249.5
Liberal Democrat Wayne Gostling1007.7
Majority53841.2
Turnout 1,30642.6
Independent hold Swing
Threemilestone and Gloweth
PartyCandidateVotes%±
Independent Tim Deeble25126.2
Independent John Humar20721.6
Conservative Adam Desmonde18219.0
Liberal Democrat Moyra Nolan14915.6
Labour Phillip Fenton697.2
Independent Ken Hart646.7
Independent Chris Pascoe363.8
Majority444.6
Turnout 95829.8
Independent gain from Liberal Democrat Swing
Tintagel
PartyCandidateVotes%±
Liberal Democrat Glenton Bruce Brown66457.1
UKIP Susan Jane Bowen31326.9
Conservative Paul William Charlesworth18515.9
Majority35130.2
Turnout 1,16236.1
Liberal Democrat hold Swing
Torpoint East
PartyCandidateVotes%±
Liberal Democrat Brian Hobbs46645.2
Conservative John Crago30029.1
UKIP Rob White26525.7
Majority16616.1
Turnout 1,03133.2
Liberal Democrat hold Swing
Torpoint West
PartyCandidateVotes%±
Conservative Mike Pearn64983.3
Liberal Democrat Adam David Evan Killeya13016.7
Majority51966.6
Turnout 77924.9
Conservative hold Swing
Trelawny
PartyCandidateVotes%±
Liberal Democrat Jim Candy69543.4
Conservative Peter Hunt51332.1
UKIP Anthony Hamilton Marris39224.5
Majority18211.4
Turnout 1,60041.8
Liberal Democrat gain from Conservative Swing
Truro Boscawen [BC 43]
PartyCandidateVotes%±
Independent Bert Biscoe 68052.6
Conservative Noel Krishnan22617.5
Green Lindsay Southcombe13510.4
Liberal Democrat Maurice Vella1279.8
Labour Susan Street1259.7
Majority45435.1
Turnout 1,29330.9
Independent hold Swing
Truro Redannick [BC 44]
PartyCandidateVotes%±
Liberal Democrat Rob Nolan70252.9
Conservative Lorrie Eathorne-Gibbons31523.8
Mebyon Kernow Lance Dyer1138.5
Labour Pamela Atherton1098.2
Green Howard Newlove876.6
Majority38729.2
Turnout 1,32636.7
Liberal Democrat hold Swing
Truro Tregolls
PartyCandidateVotes%±
Independent Loic Rich46140.9
Liberal Democrat Ros Cox21719.3
Conservative Judy Cresswell18216.2
UKIP James Minahan16915.0
Labour Margaret George686.0
Green Godfrey Allen292.6
Majority24421.7
Turnout 1,12631.1
Independent gain from Liberal Democrat Swing
Truro Trehaverne
PartyCandidateVotes%±
Conservative Fiona Ferguson56544.7
Independent Charlotte Mackenzie27922.1
UKIP Michael Inglefield17413.8
Green Steve Angove876.9
Labour Richard Lees846.7
Liberal Democrat Peter Congdon745.9
Majority28622.6
Turnout 1,26333.7
Conservative hold Swing
Wadebridge East
PartyCandidateVotes%±
Independent Collin William Brewer33525.2
Liberal Democrat Steve Knightley33124.9
UKIP Roderick Harrison20815.6
Labour Adrian Darrell Jones16112.1
Conservative Brian Aubone Bennetts15011.3
Independent Sarah Hannah Maguire14611.0
Majority40.3
Turnout 1,33142.0
Independent hold Swing
Wadebridge West
PartyCandidateVotes%±
Conservative Scott Mann 83065.5
Liberal Democrat Elliot Anthony Osborne30824.3
Labour Co-op John David Whitby12910.2
Majority52241.2
Turnout 1,26741.2
Conservative hold Swing

Electoral division changes

  1. Electoral division Bodmin St Leonard renamed from Bodmin Central [34]
  2. Electoral division Bodmin St Mary's renamed from Bodmin West [34]
  3. Electoral division Bodmin St Petroc renamed from Bodmin East [34]
  4. Electoral division Breage, Germoe and Sithney renamed from Breage [34]
  5. Electoral division Bude formed from Bude North and Stratton and Bude South [34]
  6. Electoral division Chacewater, Kenwyn and Baldhu renamed from Chacewater and Kenwyn [34]
  7. Electoral division Constantine, Mawnan and Budock renamed from Constantine [34]
  8. Electoral division Crowan and Wendron created from the addition of Crowan parish to Wendron [34]
  9. Electoral division Falmouth Arwenack renamed from Falmouth Gyllyngvase (Not to be confused with Falmouth Arwenack division from 2009) [34]
  10. Electoral division Falmouth Smithick renamed from Falmouth Arwenack [34]
  11. Electoral division Feock and Playing Place renamed from Feock and Kea [34]
  12. Electoral division Grenville and Stratton renamed from Bude North and Stratton [34]
  13. Electoral division Gunnislake and Calstock renamed from Gunnislake [34]
  14. Electoral division Helston South created from the majority of Helston Central [34]
  15. Electoral division Lanivet and Blisland renamed from Lanivet [34]
  16. Electoral division Launceston North and North Petherwin renamed from Launceston North [34]
  17. Electoral division Liskeard East renamed from Liskeard Central [34]
  18. Electoral division Liskeard West and Dobwalls renamed from Liskeard South and Dobwalls [34]
  19. Electoral division Looe West, Lansallos and Lanteglos renamed from Looe West and Lansallos after the addition of Lanteglos parish [34]
  20. Electoral division Lynher renamed from St Ive [34]
  21. Electoral division Mabe, Perranarworthal and St Gluvias renamed from Mabe [34]
  22. Electoral division Marazion and Perranuthoe renamed from Marazion [34]
  23. Electoral division Penwithick and Boscoppa renamed from Penwithick [34]
  24. Electoral division Porthleven and Helston West renamed from Porthleven and Helston South [34]
  25. Electoral division Probus, Tregony and Grampound renamed from Probus [34]
  26. Electoral division Rame Peninsular renamed from Rame [34]
  27. Electoral division Saltash East renamed from Saltash Pill [34]
  28. Electoral division Saltash North renamed from Saltash St Stephens* [34]
  29. Electoral division Saltash South renamed from Saltash Essa* [34]
  30. Electoral division Saltash West renamed from Saltash Burraton [34]
  31. Electoral division St Blazey renamed from St Blaise [34]
  32. Electoral division St Columb Major renamed from St Columb [34]
  33. Electoral division St Dennis and Nanpean renamed from St Dennis [34]
  34. Electoral division St Dominick, Harrowbarrow and Kelly Bray renamed from Kelly Bray [34]
  35. Electoral division St Germans and Landulph renamed from St Germans [34]
  36. Electoral division St Issey and St Tudy renamed from St Issey [34]
  37. Electoral division St Ives East renamed from St Ives North [34]
  38. Electoral division St Ives West renamed from St Ives South [34]
  39. Electoral division St Mawgan and Colan renamed from Colan and Mawgan [34]
  40. Electoral division St Minver and St Endellion renamed from St Endellion [34]
  41. Electoral division St Stephen-In-Brannel renamed from St Stephen [34]
  42. Electoral division St Teath and St Breward renamed from St Teath [34]
  43. Electoral division Truro Boscawen renamed from Truro Moresk (Not to be confused with Truro Boscawen division from 2009) [34]
  44. Electoral division Truro Redannick renamed from Truro Boscawen [34]

Related Research Articles

Liberal Party (UK, 1989) political party of the United Kingdom, from 1989

The Liberal Party is a British political party that was founded in 1989 by members of the original Liberal Party opposed to its merger with the Social Democratic Party (SDP) to form the Liberal Democrats. The party holds seven local council seats.

South East Cornwall (UK Parliament constituency) Parliamentary constituency in the United Kingdom

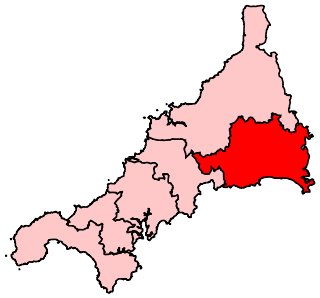
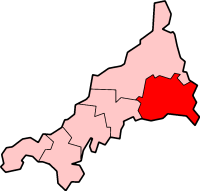
South East Cornwall is a constituency represented in the House of Commons of the UK Parliament since 2010 by Sheryll Murray, a Conservative.

2005 United Kingdom local elections

Elections for local government were held in the England and Northern Ireland on 5 May 2005 along with the 2005 general election across the entire United Kingdom. In addition, the Isle of Wight held a local referendum on the issue of a directly elected mayor.

Guildford Council in Surrey, England is elected every four years.

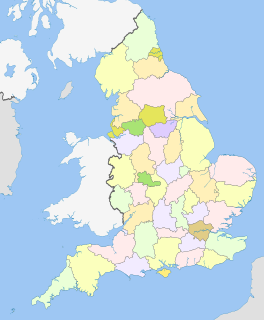
Cornwall Council in England, UK, was established in 2009 and is elected every four years. From 1973 to 2005 elections were for Cornwall County Council, with the first election for the new unitary Cornwall Council held in June 2009. This election saw 123 members elected, replacing the previous 82 councillors on Cornwall County Council and the 249 on the six district and borough councils. In June 2013 the Local Government Boundary Commission for England announced a public consultation on its proposal that Cornwall Council should have 87 councillors in future.

Sefton Council Local government body in England

Sefton Council is the governing body for the Metropolitan Borough of Sefton in Merseyside, north-western England. The council was under no overall control from the 1980s until 2012 when the Labour Party took control. It is a constituent council of Liverpool City Region Combined Authority.

Politics of Cornwall

Cornwall is administered as a county of South West England whose politics are influenced by a number of issues that make it distinct from the general political scene in the wider United Kingdom, and the political trends of neighbouring counties. Its position on the geographical periphery of the island of Great Britain is also a factor.

2006 St Albans City and District Council election

The 2006 St Albans City and District Council election took place on 4 May 2006 to elect members of St Albans District Council in Hertfordshire, England. One third of the council was up for election and the Liberal Democrats gained overall control of the council from no overall control.

2013 United Kingdom local elections

The 2013 United Kingdom local elections took place on Thursday 2 May 2013. Elections were held in 35 English councils: all 27 non-metropolitan county councils and eight unitary authorities, and in one Welsh unitary authority. Direct mayoral elections took place in Doncaster and North Tyneside. These elections last took place on the 4 June 2009 at the same time as the 2009 European Parliament Elections, except for County Durham, Northumberland and the Anglesey where elections last took place in 2008.

2013 West Sussex County Council election

The West Sussex County Council election, 2013 took place on 2 May 2013, as part of the United Kingdom local elections, 2013. All 71 electoral divisions were up for election, which returned one county councillor each by first-past-the-post voting for a four-year term of office. At this election, the Conservative Party was seeking to retain overall control of the council, and the Liberal Democrats to maintain their position as the main opposition party.

2012 Pendle Borough Council election

The 2012 Pendle Borough Council election took place on 3 May 2012 to elect members of Pendle Borough Council in Lancashire, England. One third of the council was up for election and the council stayed under no overall control.

2008 Huntingdonshire District Council election

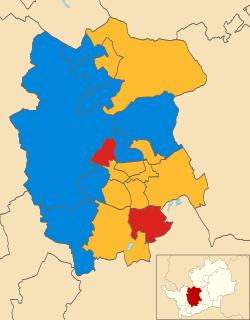
The 2008 Huntingdonshire District Council election took place on 1 May 2008 to elect members of Huntingdonshire District Council in Cambridgeshire, England. One third of the council was up for election and the Conservative party stayed in overall control of the council.

2014 Huntingdonshire District Council election

The 2014 Huntingdonshire District Council election took place on 22 May 2014 to elect members of Huntingdonshire District Council in Cambridgeshire, England. One third of the council was up for election and the Conservative party stayed in overall control of the council.

2014 Brent London Borough Council election

The 2014 Brent London Borough Council election took place on 22 May 2014 to elect members of Brent London Borough Council in London, England. The whole council was up for election and the Labour Party stayed in overall control of the council.

2003 Christchurch Borough Council election

The 2003 Christchurch Borough Council election took place on 1 May 2003 to elect members of Christchurch Borough Council in Dorset, England. The whole council was up for election after boundary changes reduced the number of seats by one. The Conservative party stayed in overall control of the council.

2017 United Kingdom local elections

The 2017 United Kingdom local elections were held on Thursday 4 May 2017. Local elections were held across Great Britain, with elections to 35 English local authorities and all councils in Scotland and Wales.

2017 Cornwall Council election

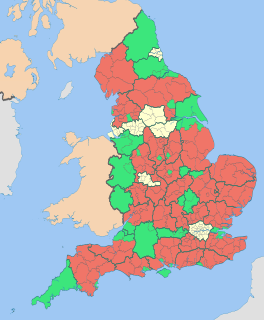
The 2017 Cornwall Council election was held on 4 May 2017 as part of the 2017 local elections in the United Kingdom. 122 councillors were elected from the 121 electoral divisions of Cornwall Council, which returned either one or two councillors each by first-past-the-post voting for a four-year term of office. Although originally scheduled to take place on the same day, the election in the Bodmin St Petroc ward was countermanded following the death of Liberal Democrat candidate Steve Rogerson and was held on 8 June.

2017 Argyll and Bute Council election

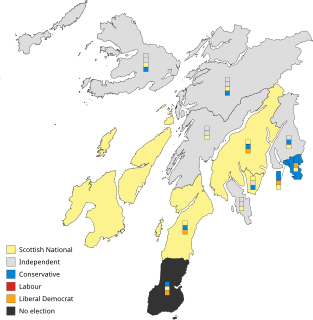
The 2017 Argyll and Bute Council elections took place on 4 May 2017 alongside local elections across Scotland. This was the third local election to take place using the Single Transferable Vote electoral system.

References

  1. "Unitary status agreed for council". BBC News Online . 5 December 2007. Retrieved 5 May 2013.
  2. "Election 09 LIVE BLOG". Thisiscornwall.com. Local World. 29 April 2011. Retrieved 6 May 2013.
  3. "Split vote sees Cornwall's Tory council leader clings on to position". Thisiscornwall.com. Local World. 5 June 2009. Retrieved 6 May 2013.
  4. "Cornwall Council election sees 480 candidates". BBC News Online . 9 April 2013. Retrieved 6 May 2013.
  5. Wallis, Andrew (16 April 2013). "Cornwall Council Candidates by political groups". Cllr Andrew Wallis' blog. Retrieved 6 May 2013.
  6. "List of candidates for Cornwall Council election released". Falmouth Packet. Newsquest Media. 5 April 2013. Retrieved 8 May 2013.
  7. "Cornwall Council and Parish and Town Council Elections 2013". Cornwall Council. Retrieved 10 May 2013.
  8. Meyjes, Toby (17 April 2013). "Election apathy leaves Cornwall parish and town councils struggling to fill seats". ThisisCornwall.com. Local World. Retrieved 10 May 2013.
  9. "Over to you fair Cornwall - it's time to get out and vote". Falmouth Packet. 1 May 2013. Retrieved 14 March 2014.
  10. 1 2 3 4 "Cornwall Council elections preview". ThisisCornwall.com. Local World. 2 May 2013. Retrieved 14 March 2014.
  11. "Lib Dems launch election campaign". ThisisCornwall.com. Local World. 21 March 2013. Retrieved 17 March 2014.
  12. "UKIP leader hopes for cluster of councillors". ThisisCornwall.com. Local World. 11 April 2013. Retrieved 14 March 2014.
  13. "'Second home subsidy' tops Labour's Cornwall campaign". ThisisCornwall.com. Local World. 27 March 2013. Retrieved 17 March 2014.
  14. "Help to Buy not for second homes, says George Osborne". BBC News Online. 23 July 2013. Retrieved 17 March 2014.
  15. "Labour's manifesto for council poll is launched". ThisisCornwall.com. Local World. 28 March 2013. Retrieved 17 March 2014.
  16. "Green Party leader meets Truro's mayor". ThisisCornwall.com. Local World. 7 March 2013. Retrieved 14 March 2014.
  17. "The Representation of the People (Form of Canvass) (England and Wales) Regulations 2006, Schedule Part 1". Legislation.gov.uk. 13 October 2011. Retrieved 18 April 2012.
  18. "I have two homes. Can I register at both addresses?". The Electoral Commission. Retrieved 5 January 2011.
  19. "Cornwall Council elections - Thursday, 2nd May, 2013". Cornwall Council . Retrieved 17 March 2014.
  20. "Cornwall Council elections - Thursday, 4th June, 2009". Cornwall Council . Retrieved 17 March 2014.
  21. "Results for Cornwall". Vote 2013. BBC News Online . Retrieved 25 March 2014.
  22. 1 2 "Jolt given to coalition's parties in Cornwall". ThisisCornwall.com. Local World. 9 May 2013. Retrieved 25 March 2014.
  23. "Cornwall's First Green Councillor Elected". West Cornwall Green Party. 3 May 2013. Retrieved 25 March 2014.
  24. "Tory quits and makes Cornwall independents and Lib Dems equal". BBC News Online. 14 May 2013. Retrieved 26 April 2014.
  25. "Top conservative Mike Eathorne-Gibbons jumps ship to Independent group in shock Cornwall Council defection". West Briton. Local World. 13 May 2013. Retrieved 26 April 2014.
  26. "Lib Dems call for cross-group Cornwall Council administration". BBC News Online. 9 May 2013. Retrieved 26 April 2014.
  27. "Cornwall independents and Lib Dems 'to form coalition'". BBC News Online. 17 May 2013. Retrieved 26 April 2014.
  28. "John Pollard appointed leader of Cornwall Council". BBC News Online. 21 May 2013. Retrieved 26 April 2014.
  29. "Councillors by Party". Cornwall Council . Retrieved 26 April 2014.
  30. Wood, Jo (5 April 2013). "Disabled children "should be put down" ex-councillor Collin Brewer will stand for May elections". West Briton. Local World. Retrieved 26 April 2014.
  31. "Lib Dems take former Collin Brewer seat in Wadebridge East". BBC News Online. 6 September 2013. Retrieved 26 April 2014.
  32. "Cornwall Council elections - Thursday, 2nd May, 2013". Election results by electoral divisions. Cornwall Council . Retrieved 30 December 2013.
  33. "Cornwall Council elections - Thursday, 4th June, 2009". Election results by electoral divisions. Cornwall Council . Retrieved 30 December 2013.
  34. 1 2 3 4 5 6 7 8 9 10 11 12 13 14 15 16 17 18 19 20 21 22 23 24 25 26 27 28 29 30 31 32 33 34 35 36 37 38 39 40 41 42 43 44 "Future electoral arrangements for Cornwall Council" (pdf). Boundary Committee for England. December 2009. Retrieved 30 December 2013.
  35. Smith, Graham (17 June 2011). "Jan Powell quits Tories and joins Lib Dems". bbc.co.uk. Retrieved 26 January 2014.
  36. "Cornwall Council cabinet member Armand Toms quits Conservatives". BBC News Online. 14 March 2013. Retrieved 26 January 2014.
  37. "A highly respected Lib Dem Cllr has left the party in 'disillusion' at the Con/Dem coalition's education policies". Cornwall Community News. 16 May 2012. Retrieved 13 January 2014.