East Sussex County Council election, 2013

Last updated

East Sussex County Council election, 2013
Flag of England.svg
  2009 2 May 2013 2017  

All 49 seats to East Sussex County Council
25 seats needed for a majority

 First partySecond party
 
Party Conservative Liberal Democrat
Seats won2010
Seat changeDecrease2.svg9Decrease2.svg3

 Third partyFourth party
 
Party UKIP Labour
Seats won77
Seat changeIncrease2.svg7Increase2.svg3

East Sussex UK local election 2013 map.svg
Map showing the results of the 2013 East Sussex County Council election. Striped electoral divisions have mixed representation.

Council control before election

Conservative

Council control after election

No Overall Control

The East Sussex County Council election, 2013 took place on 2 May 2013 as part of the United Kingdom local elections, 2013. All 49 councillors of East Sussex County Council were elected from 44 electoral divisions, which return either one or two councillors each by first-past-the-post voting for a four-year term of office. [1] The electoral divisions were the same as those used at the previous election in 2009. No elections were held in Brighton and Hove, which is a unitary authority outside the area covered by the County Council.

East Sussex County Council British administrative body

East Sussex County Council is the local authority for the non-metropolitan county of East Sussex.

First-past-the-post voting voting system in which voters select one candidate, and the candidate who receives more votes than any other candidate wins

A first-past-the-post electoral system is one in which voters indicate on a ballot the candidate of their choice, and the candidate who receives the most votes wins. This is sometimes described as winner takes all. First-past-the-post voting is a plurality voting method. FPTP is a common, but not universal, feature of electoral systems with single-member electoral divisions, and is practiced in close to one third of countries. Notable examples include Canada, India, the United Kingdom, and the United States, as well as most of their current or former colonies and protectorates.

Contents

All locally registered electors (British, Irish, Commonwealth and European Union citizens) who were aged 18 or over on Thursday 2 May 2013 were entitled to vote in the local elections. Those who were temporarily away from their ordinary address (for example, away working, on holiday, in student accommodation or in hospital) were also entitled to vote in the local elections, [2] although those who had moved abroad and registered as overseas electors cannot vote in the local elections. It is possible to register to vote at more than one address (such as a university student who had a term-time address and lives at home during holidays) at the discretion of the local Electoral Register Office, but it remains an offence to vote more than once in the same local government election. [3]

In general, a Commonwealth citizen is a citizen of a member state of the Commonwealth of Nations. This designation is given legal effect in the nationality laws of some Commonwealth countries, and Commonwealth citizens may enjoy some privileges in the United Kingdom and, less commonly, other member states. Each Commonwealth country determines what special rights, if any, are accorded to citizens of other Commonwealth countries. The status is most significant in British law and has little effect in many other Commonwealth countries, such as Canada.

European Union Economic and political union of European states

The European Union (EU) is a political and economic union of 28 member states that are located primarily in Europe. It has an area of 4,475,757 km2 (1,728,099 sq mi) and an estimated population of about 513 million. The EU has developed an internal single market through a standardised system of laws that apply in all member states in those matters, and only those matters, where members have agreed to act as one. EU policies aim to ensure the free movement of people, goods, services and capital within the internal market, enact legislation in justice and home affairs and maintain common policies on trade, agriculture, fisheries and regional development. For travel within the Schengen Area, passport controls have been abolished. A monetary union was established in 1999 and came into full force in 2002 and is composed of 19 EU member states which use the euro currency.

Summary

At this election, the Conservative Party was seeking to retain overall control of the council, previously having a majority of four seats, and the Liberal Democrats to maintain or better their position of 13 seats.

Conservative Party (UK) Political party in the United Kingdom

The Conservative Party, officially the Conservative and Unionist Party, is a centre-right political party in the United Kingdom. The governing party since 2010, it is the largest in the House of Commons, with 314 Members of Parliament, and also has 249 members of the House of Lords, 18 members of the European Parliament, 31 Members of the Scottish Parliament, 12 members of the Welsh Assembly, eight members of the London Assembly and 9,008 local councillors.

Liberal Democrats (UK) Political party in the United Kingdom

The Liberal Democrats are a liberal political party in the United Kingdom. They presently have 11 Members of Parliament in the House of Commons, 96 members of the House of Lords, and one member of the European Parliament. They also have five Members of the Scottish Parliament and a member each in the Welsh Assembly and London Assembly. The party reached the height of its influence in the early 2010s, forming a junior partner in a coalition government from 2010 to 2015. It is presently led by Vince Cable.

The Conservatives were reduced to 20 seats on the 49-member council, producing no overall control. [4] UKIP made strong gains, winning 7 seats (their first ever seats on the council), and Labour also gained seats (its gain of three seats being wholly at the expense of Conservatives).[ citation needed ] The number of Independent members increased to 5. Overall, the Liberal Democrats lost three councillors.

In the context of local authorities in the United Kingdom, the term no overall control refers to a situation in which no single political group achieves a majority of seats; and is analogous to a hung parliament. Of the 310 councils who had members up for election in the 2007 local elections, 85 resulted in a NOC administration.

UK Independence Party British political party

The UK Independence Party is a hard Eurosceptic, right-wing political party in the United Kingdom. It currently has one representative in the House of Lords and seven Members of the European Parliament (MEPs). It has four Assembly Members (AMs) in the National Assembly for Wales and one member in the London Assembly. The party reached its greatest level of success in the mid-2010s, when it gained two Members of Parliament and was the largest UK party in the European Parliament.

The Labour Party is a centre-left political party in the United Kingdom which has been described as an alliance of social democrats, democratic socialists and trade unionists. The party's platform emphasises greater state intervention, social justice and strengthening workers' rights.

Since the election the Conservatives have decided to form a minority administration. [5]

Election results

East Sussex County Council election, 2013
PartySeatsGainsLossesNet gain/lossSeats %Votes %Votes+/−
  Conservative 200101040.831.650,325-8.3
  Liberal Democrat 1002220.414.823,538-15.9
  UKIP 7+714.327.343,458+19.7
  Labour 7+314.314.422,962+6.3
  Independent 3±06.15.28,346-1.6
 No description2+24.13.75,859N/A
  Green 0±00.03.04,824-2.2

Results by electoral division

East Sussex includes five districts: Eastbourne borough, Hastings borough, Lewes district, Rother district and Wealden district, and the results are grouped by those districts.

Eastbourne

Devonshire
PartyCandidateVotes%±
Liberal Democrat Steve Wallis89339.3
UKIP Bob Lacey63828.1
Labour Gerry Stonestreet37316.4
Conservative Colin Murdoch32214.2
Independent Keith Gell482.1
Majority
Turnout 2,27427.0
Liberal Democrat hold Swing
Hampden Park
PartyCandidateVotes%±
Liberal Democrat Mike Blanch85939.8
UKIP Paul Brown60928.2
Conservative Simon Howe41519.2
Labour Paul Richards27712.8
Majority
Turnout 2,16029.1
Liberal Democrat hold Swing
Langney
PartyCandidateVotes%±
Liberal Democrat Alan Shuttleworth1,09048.6
UKIP Diane Kefallinos55724.8
Labour Lee Comfort29913.3
Conservative Gordon Jenkins29913.3
Majority
Turnout 2,24528.5
Liberal Democrat hold Swing
Meads
PartyCandidateVotes%±
Conservative Barry Taylor1,26141.0
UKIP Alan Thornton85527.8
Liberal Democrat Linda Beckmann51016.6
Labour Dennis Scard 2799.1
Green Dorothy Forsyth1695.5
Majority
Turnout 3,07438.1
Conservative hold Swing
Old Town
PartyCandidateVotes%±
Liberal Democrat John Ungar1,45742.9
Conservative Anne Angel1,05431.0
UKIP David Greaves61318.0
Labour Sarah Richards2758.1
Majority
Turnout 3,39940.6
Liberal Democrat hold Swing
Ratton
PartyCandidateVotes%±
Conservative Colin Belsey1,22440.7
UKIP Roger Stagnell88129.3
Liberal Democrat Neil Stanley55918.6
Labour Anne Grigg2217.4
Green Ann Sterenberg1214.0
Majority
Turnout 3,00638.7
Conservative hold Swing
St Anthony's
PartyCandidateVotes%±
Liberal Democrat David Tutt1,30448.6
UKIP Christine Woodley75728.2
Conservative Patrick Warner34913.0
Labour Ian Culshaw1997.4
Green Hugh Norris762.8
Majority
Turnout 2,68531.8
Liberal Democrat hold Swing
Sovereign
PartyCandidateVotes%±
Conservative David Elkin1,08639.2
UKIP Robert Harper93033.6
Liberal Democrat Steve Holt53119.2
Labour Richard Goude2228.0
Majority
Turnout 2,76929.9
Conservative hold Swing
Upperton
PartyCandidateVotes%±
Liberal Democrat Pat Rodohan1,22540.4
Conservative Tom Liddiard98132.4
UKIP Amanda Sheehan59119.5
Labour Matthew Quanstrom2357.8
Majority
Turnout 3,03237.5
Liberal Democrat hold Swing

Hastings

Ashdown and Conquest
PartyCandidateVotes%±
Conservative Peter Pragnell1,06140.0
UKIP Doug Thorogood84631.9
Labour Stuart Murphy61923.3
Liberal Democrat Paul Burton1284.8
Majority
Turnout 2,65430.5
Conservative hold Swing
Baird and Ore
PartyCandidateVotes%±
Labour Michael Wincott87239.2
Conservative Liam Atkins67030.1
UKIP Paul Willard53524.1
Green Will Davis783.5
Liberal Democrat Kate Tudgay683.1
Majority
Turnout 2,22330.4
Labour gain from Conservative Swing
Braybrooke and Castle
PartyCandidateVotes%±
Labour Godfrey Daniel1,39656.0
UKIP Jay Lavender39916.0
Conservative Matthew Lock32913.2
Green Maya Evans25510.2
Liberal Democrat Stewart Rayment1134.5
Majority
Turnout 2,49230.3
Labour hold Swing
Central St Leonards and Gensing
PartyCandidateVotes%±
Labour Trevor Webb1,02047.2
UKIP Michael McIver45220.9
Conservative John Waterfall34916.1
Green Maresa Bossano22810.5
Liberal Democrat Graham Hopgood1135.2
Majority
Turnout 2,16225.5
Labour hold Swing
Hollington and Wishing Tree
PartyCandidateVotes%±
Labour Phil Scott1,15253.1
UKIP Ken Pankhurst59627.5
Conservative Nigel Barry32214.8
Liberal Democrat Vanessa Burton994.6
Majority
Turnout 2.16926.0
Labour hold Swing
Maze Hill and West St Leonards
PartyCandidateVotes%±
Labour Kim Forward86135.6
Conservative Rob Lee79632.9
UKIP Markham Jary53222.0
Green Sarah Evans1305.4
Liberal Democrat Sue Tait1004.1
Majority
Turnout 2,41929.9
Labour gain from Conservative Swing
Old Hastings and Tressell
PartyCandidateVotes%±
Labour Jeremy Birch1,07649.2
UKIP Peter Wallace49222.5
Conservative Sally-Ann Hart34215.6
Green Sally Phillips1828.3
Liberal Democrat Christopher Dodwell974.4
Majority
Turnout 2,18927.8
Labour hold Swing
St Helens and Silverhill
PartyCandidateVotes%±
Labour John Hodges1,20640.8
Conservative Matthew Lock99033.5
UKIP Kara Willard55018.6
Green David Carey-Stuart1073.6
Liberal Democrat Paul Smith1033.5
Majority
Turnout 2,95639.2
Labour gain from Conservative Swing

Lewes

Chailey
PartyCandidateVotes%±
Conservative Jim Sheppard1,62145.8
Liberal Democrat Sarah Osborne81223.0
UKIP Tam Large66218.7
Green Alex Luetchford2226.3
Labour George Adsett-Knutsen2196.2
Majority
Turnout 3,53636.2
Conservative hold Swing
Lewes
PartyCandidateVotes%±
Independent Ruth O'Keeffe2,38559.5
Green Alfie Stirling59214.8
Labour Gaby Weiner3428.5
Liberal Democrat Joyce Bell3057.6
UKIP Donna Edmunds2315.8
Conservative Roy Burman1523.8
Majority
Turnout 4,00745.2
Independent hold Swing
Newhaven and Ouse Valley West
PartyCandidateVotes%±
Liberal Democrat Carla Butler78431.3
UKIP George Cork72428.9
Conservative Tony Bradbury54021.6
Labour Jan Woodling31712.7
Green Ashley Price1405.6
Majority
Turnout 2,50530.2
Liberal Democrat hold Swing
Ouse Valley East
PartyCandidateVotes%±
UKIP Peter Charlton93431.6
Conservative Robbie Robertson66322.5
Liberal Democrat Steve Saunders53218.0
Independent Roger Foxwell48616.5
Labour Trevor Hopper1866.3
Green Johnny Denis1515.1
Majority
Turnout 2,95238.5
UKIP gain from Liberal Democrat Swing
Peacehaven and Telscombe Towns (2 seats)
PartyCandidateVotes%±
UKIP Ian Buchanan2,23619.8
UKIP Phil Howson2,23219.8
Conservative John Livings2,14819.0
Conservative Andy Smith2,02718.0
Labour John Carden1,1199.9
Labour Christine Robinson1,1169.9
Green Adrian Ross2071.8
Green Keith Rapley1991.8
Turnout 5,64233.6
UKIP gain from Conservative Swing
Ringmer and Lewes Bridge
PartyCandidateVotes%±
Liberal Democrat Rosalyn St Pierre1,10332.3
Conservative Richard Turner70820.7
UKIP Ian Wilson57416.8
Independent Matt Kent40711.9
Labour Louis Blair3269.5
Green Susan Murray2988.7
Majority
Turnout 3,41637.7
Liberal Democrat hold Swing
Seaford Blatchington
PartyCandidateVotes%±
Liberal Democrat Carolyn Lambert90032.1
UKIP Jeffrey Titford87331.2
Conservative Paul Franklin70225.1
Labour Agnes Wheeler1946.9
Green Roger Murray1334.7
Majority
Turnout 2,80235.3
Liberal Democrat hold Swing
Seaford Sutton
PartyCandidateVotes%±
UKIP Frank Carstairs1,18939.7
Conservative Sam Adeniji92730.9
Liberal Democrat Eleas Hussain55718.6
Labour Peter Hambly1916.4
Green Patti Broome1334.4
Majority
Turnout 2,99739.9
UKIP gain from Liberal Democrat Swing

Rother

Battle and Crowhurst
PartyCandidateVotes%±
Liberal Democrat Kathryn Field1,13143.3
Conservative Pam Doodes62123.8
UKIP Tom Foy60623.2
Labour Tim MacPherson2529.7
Majority
Turnout 2,61034.9
Liberal Democrat hold Swing
Bexhill East
PartyCandidateVotes%±
Independent Charles Clark87935.1
UKIP Geoffrey Bastin61924.8
Conservative Martin Kenward47218.9
Labour Philipa Coughlan27210.9
Liberal Democrat Vivienne Bond25910.4
Majority
Turnout 2,50132.8
Independent gain from Conservative Swing
Bexhill King Offa (2)
PartyCandidateVotes%±
Conservative Michael Ensor1,69331.8
UKIP Michael Phillips1,62930.6
UKIP Yvonne Clout1,52928.7
Conservative Joy Hughes1,44527.1
Labour Alan Bearne1,02119.2
Labour Paul Courtel95217,9
Independent Yolanda Laybourne89516.8
Independent Andrew Crotty72313.6
Liberal Democrat Stuart Wood4979.3
Liberal Democrat Tracy Dixon2705.1
Turnout 5,32728.0
Conservative hold Swing
UKIP gain from Conservative Swing
Bexhill West
PartyCandidateVotes%±
Independent Stuart Earl1,33442.6
Conservative Nichollas Hollingsworth81226.0
UKIP Alf Lovell72023.0
Labour Yvonne Cleland1695.4
Liberal Democrat John Zipperlen933.0
Majority
Turnout 3,12839.9
Independent gain from Conservative Swing
Brede Valley and Marsham
PartyCandidateVotes%±
Conservative Carl Maynard1,19544.6
UKIP Cliff Stokes83731.3
Labour Jonathan Lee50318.8
Liberal Democrat Chris Lewcock1425.3
Majority
Turnout 2,67736.3
Conservative hold Swing
Northern Rother
PartyCandidateVotes%±
Conservative Angharad Davies1,22242.7
UKIP Trevor Gooding82428.8
Liberal Democrat Sue Prochak81828.6
Majority
Turnout 2,86434.7
Conservative hold Swing
Rother North West
PartyCandidateVotes%±
Conservative John Barnes1,15847.0
UKIP Tony Smith67727.5
Liberal Democrat Steve Barrass29111.8
Green Don Nicholls1706.9
Labour Christoper Husbands1666.7
Majority
Turnout 2,46232.8
Conservative hold Swing
Rye and Eastern Rother
PartyCandidateVotes%±
Conservative Keith Glazier96336.1
UKIP Michael McKenzie88433.2
Labour Nick Warren64724.3
Liberal Democrat Peter Hillier-Palmer1716.4
Majority
Turnout 2,66536.2
Conservative hold Swing

Wealden

Alfriston, East Hoathly & Hellingly
PartyCandidateVotes%±
Conservative Nick Bennett1,27238.8
UKIP Dan Docker1,13134.5
Liberal Democrat Andy Watkins55216.8
Labour Tom Serpell32710.0
Majority
Turnout 3,28234.2
Conservative hold Swing
Buxted Maresfield
PartyCandidateVotes%±
Conservative Roy Galley1,47851.4
UKIP Tony Robards84529.4
Liberal Democrat Martha Whittle30910.7
Labour Bruce Meredeen2438.5
Majority
Turnout 2,87532.8
Conservative hold Swing
Crowborough (2 seats)
PartyCandidateVotes%±
Conservative Richard Stogdon1,86641.9
Conservative Sylvia Tidy1,72338.6
Independent Stephen Isted1,18926.7
UKIP Anna-Marie Crampton1,15726.0
UKIP Sonia Finch1,12725.3
Labour Brendan Clegg46910.6
Labour Dave Neeves3938.8
Liberal Democrat Beverley Johnstone3407.6
Liberal Democrat David Shaw3277.3
Green Scott Mason3257.3
Turnout 4,45826.8
Conservative hold Swing
Forest Row
PartyCandidateVotes%±
Conservative Francis Whetstone1,09539.8
UKIP Peter Griffiths79528.9
Green Keith Obbard43315.7
Liberal Democrat Chris Rycroft2699.8
Labour Kevin O'Sullivan1585.7
Majority
Turnout 2,75030.4
Conservative hold Swing
Framfield and Horam
PartyCandidateVotes%±
Conservative Chris Dowling1,41548.8
UKIP Graham Shevill93532.2
Labour Lis Rumbold2769.5
Liberal Democrat Michael Harker2759.5
Majority
Turnout 2,90132.2
Conservative hold Swing
Hailsham and Herstmonceux (2 seats)
PartyCandidateVotes%±
UKIP Laurence Keeley1,89240.4
Conservative Bill Bentley1,85939.7
UKIP David Younge1,76937.7
Conservative Roger Thomas1,51532.3
Liberal Democrat Paul Holbrook66014.1
Labour Steve Cross65614.0
Labour Roger McCarthy53211.3
Liberal Democrat Graham Morgan49310.5
Turnout 4,68827.2
UKIP gain from Conservative Swing
Conservative hold Swing
Heathfield
PartyCandidateVotes%±
Conservative Rupert Simmons1,25349.7
UKIP Julie Docker79831.6
Labour Craig Austen-White26510.5
Liberal Democrat Jim Benson2068.2
Majority
Turnout 2,52230.7
Conservative hold Swing
Pevensey and Westham
PartyCandidateVotes%±
UKIP Mike Pursglove1,09643.9
Conservative Tony Freebody99139.7
Labour Robert Slater27210.9
Liberal Democrat Rachel Hills1365.5
Majority
Turnout 2,49532.7
UKIP gain from Conservative Swing
Polegate, Willingdon and East Dean (2 seats)
PartyCandidateVotes%±
No descriptionStephen Shing3,06654.0
No descriptionDaniel Shing2,79349.2
UKIP Bernie Goodwin1,28922.7
Conservative Douglas Murray1,09919.4
UKIP Maureen Goodwin1,04718.4
Conservative Simon Popek87515.4
Liberal Democrat Don Broadbent59510.5
Liberal Democrat Rob Slater3566.3
Labour Alex Mthobi2304.1
Turnout 5,67539.2
No description hold Swing
Uckfield
PartyCandidateVotes%±
Conservative Claire Dowling92832.3
Liberal Democrat Paul Sparks88030.7
UKIP Mike Mayo76426.6
Labour Chris Horlock29810.4
Majority
Turnout 2,87032.3
Conservative hold Swing
Wadhurst
PartyCandidateVotes%±
Conservative Bob Standley2,03766.9
Green Jonathan Kent47515.6
Labour Felicity Harvest2698.8
Liberal Democrat Gavin Barrass2668.7
Majority
Turnout 3,04732.1
Conservative hold Swing

Related Research Articles

2009 Suffolk County Council election

Elections to Suffolk County Council were held on 4 June 2009 as part of the 2009 United Kingdom local elections on the same day as the elections to the European Parliament. 75 councillors were elected from 63 electoral divisions, which returned either one or two county councillors each by first-past-the-post voting for a four-year term of office. The electoral divisions were the same as those used at the previous election in 2004.

2009 Hertfordshire County Council election

An election to Hertfordshire County Council took place on 4 June 2009 the date of the United Kingdom local elections, 2009. The whole elected council was up for election. The councillors were elected from the 77 wards, which return one each by first-past-the-post voting for a four-year term of office. The wards were the same as those used at the previous election in 2005.

2009 Hampshire County Council election

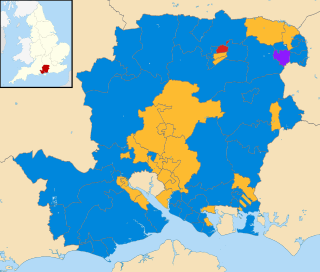
An election to Hampshire County Council took place on 4 June 2009 as part of the United Kingdom local elections, 2009, having been delayed from 7 May, to coincide with elections to the European Parliament. 78 councillors were elected from 75 electoral divisions, which returned either one or two county councillors each by first-past-the-post voting for a four-year term of office. The electoral divisions were the same as those used at the previous election in 2005. Elections in Portsmouth and Southampton do not coincide with this set, being unitary authorities outside the area covered by the County Council.

2014 United Kingdom local elections

The 2014 United Kingdom local elections were held on 22 May 2014. Usually these elections are held on the first Thursday in May but were postponed to coincide with the 2014 European Parliament Elections. Direct elections were held for all 32 London boroughs, all 36 metropolitan boroughs, 74 district/borough councils, 20 unitary authorities and various mayoral posts in England and elections to the new councils in Northern Ireland.

2013 Derbyshire County Council election

An election to Derbyshire County Council took place on 2 May 2013 as part of the United Kingdom local elections, 2013. Following the final draft of the 2012 electoral review, 64 councillors were elected from 61 electoral divisions which returned either one or two county councillors each by first-past-the-post voting for a four-year term of office. No elections were held in the City of Derby, which is a unitary authority outside the area covered by the County Council. The Labour Party won back control of the council by a landslide victory, taking forty-two of the authority's sixty-four seats.

2013 Leicestershire County Council election

An election to Leicestershire County Council took place on 2 May 2013 as part of the United Kingdom local elections, 2013. 55 councillors were elected from 52 electoral divisions, which returned either one or two county councillors each by first-past-the-post voting for a four-year term of office. The Conservatives held control of the council with a reduced majority of 5 seats. Despite a strong challenge from UKIP, the party only gained 2 seats whilst the Liberal Democrats lost one seat and Labour recouped some of their 2009 losses, gaining 6 seats.

2013 West Sussex County Council election

The West Sussex County Council election, 2013 took place on 2 May 2013, as part of the United Kingdom local elections, 2013. All 71 electoral divisions were up for election, which returned one county councillor each by first-past-the-post voting for a four-year term of office. At this election, the Conservative Party was seeking to retain overall control of the council, and the Liberal Democrats to maintain their position as the main opposition party.

2013 Hampshire County Council election

An election to Hampshire County Council took place on 2 May 2013 as part of the United Kingdom local elections, 2013. 78 councillors were elected from 75 electoral divisions, which returned either one or two county councillors each by first-past-the-post voting for a four-year term of office. The electoral divisions were the same as those of the previous election in 2009. No elections were held in Portsmouth and Southampton, which are unitary authorities outside the area covered by the County Council. The election saw the Conservative Party retain overall control of the council, with a reduced majority of five councillors.

2013 Kent County Council election

The Kent County Council election, 2013 was an election to all 84 seats on Kent County Council held on Thursday 2 May as part of the United Kingdom local elections, 2013. 84 councillors were elected from 72 electoral divisions, which returned either one or two county councillors each by first-past-the-post voting for a four-year term of office. The electoral divisions were the same as those used at the previous election in 2009. No elections were held in Medway, which is a unitary authority outside the area covered by the County Council. The election saw the Conservative Party narrowly retain overall control of the council.

2013 Cambridgeshire County Council election

An election to Cambridgeshire County Council took place on 2 May 2013 as part of the United Kingdom local elections, 2013. 69 councillors were elected from 60 electoral divisions, which returned either one or two county councillors each by first-past-the-post voting for a four-year term of office. The electoral divisions were the same as those used at the previous election in 2009. No elections were held in Peterborough, which is a unitary authority outside the area covered by the County Council. The election saw the Conservative Party lose overall control of the council.

2013 Worcestershire County Council election

An election to Worcestershire County Council took place on 2 May 2013 as part of the United Kingdom local elections, 2013. 57 councillors were elected from 53 electoral divisions, which returned either one or two county councillors each by first-past-the-post voting for a four-year term of office. The divisions were the same as those used at the previous election in 2009. The election saw the Conservative Party retain overall control of the council with a significantly reduced majority of just 2 seats.

2013 Lincolnshire County Council election

An election to Lincolnshire County Council took place on 2 May 2013 as part of the United Kingdom local elections, 2013. 77 electoral divisions returned one county councillor each by first-past-the-post voting for a four-year term of office. The electoral divisions were the same as those used at the previous election in 2009. No elections were held in North Lincolnshire or North East Lincolnshire, which are unitary authorities outside the area covered by the County Council.

2013 Hertfordshire County Council election

An election to Hertfordshire County Council took place on 2 May 2013 as part of the United Kingdom local elections, 2013. 77 electoral divisions elected one county councillor each by first-past-the-post voting for a four-year term of office. The electoral divisions were the same as those used at the previous election in 2009.

2013 Essex County Council election

An election to Essex County Council took place on 2 May 2013 as part of the United Kingdom local elections, 2013. 75 councillors were elected from 70 electoral divisions, which returned either one or two county councillors each by first-past-the-post voting for a four-year term of office. The electoral divisions were the same as those used at the previous election in 2009. No elections were held in Thurrock or Southend-on-Sea, which are unitary authorities outside the area covered by the County Council.

2013 Staffordshire County Council election

An election to Staffordshire County Council took place on 2 May 2013 as part of the United Kingdom local elections, 2013. 62 electoral divisions returned one county councillor each by first-past-the-post voting for a four-year term of office. Following a boundary review, new electoral division boundaries were established for this election. No elections were held in Stoke-on-Trent, which is a unitary authority outside the area covered by the County Council. The council continues to be administered on the Leader and Cabinet model.

2013 Northamptonshire County Council election

An election to Northamptonshire County Council took place on 2 May 2013 as part of the United Kingdom local elections, 2013. Following a boundary review, the number of county councillors was reduced from 73 to 57 from this election. All members were elected by first-past-the-post voting from single-member electoral divisions for a four-year term of office. The Conservative Party held on to their overall majority, having held overall control of the council since 2005.

2017 Scottish local elections

The 2017 Scottish local elections were held on Thursday 4 May, in all 32 local authorities. The SNP retained its position as the largest party in terms of votes and councillors, despite suffering minor losses. The Conservatives made gains and displaced Labour as the second largest party, while the Liberal Democrats suffered a net loss of councillors despite increasing their share of the vote. Minor parties and independents polled well; and independent councillors retained majority control over the 3 island councils. For the first time since the local government reforms in 1995, all councils fell under no overall control.

2015 United Kingdom local elections

The 2015 United Kingdom local elections were held on Thursday 7 May 2015, the same day as the general election for the House of Commons of the United Kingdom.

2017 United Kingdom local elections

The 2017 United Kingdom local elections were held on Thursday 4 May 2017. Local elections were held across Great Britain, with elections to 35 English local authorities and all councils in Scotland and Wales.

2017 Gloucestershire County Council election

The 2017 Gloucestershire County Council election took place on 4 May 2017 as part of the 2017 local elections in the United Kingdom. All 53 councillors were elected from electoral divisions which returned one county councillor each by first-past-the-post voting for a four-year term of office. Control of the council went from a Conservative Party minority to a majority administration.

References

  1. "County Council Elections". East Sussex County Council. 2013-03-30. Retrieved 2013-03-30.
  2. "The Representation of the People (Form of Canvass) (England and Wales) Regulations 2006, Schedule Part 1". Legislation.gov.uk. 13 October 2011. Retrieved 18 April 2012.
  3. "I have two homes. Can I register at both addresses?". The Electoral Commission. Retrieved 5 January 2011.
  4. "Tories lose control of East Sussex County Council". BBC News web site. BBC . Retrieved 4 May 2013.
  5. "Tories to form minority administration on East Sussex County Council". BBC. 2013-05-11. Retrieved 2013-05-17.