The 2004 Eastbourne Borough Council election took place on 10 June 2004 to elect members of Eastbourne Borough Council in East Sussex, England. One third of the council was up for election and the Conservative party gained overall control of the council from the Liberal Democrats. [1]
Eastbourne is a town, seaside resort and borough in the non-metropolitan county of East Sussex on the south coast of England, 19 miles (31 km) east of Brighton. Eastbourne is immediately to the east of Beachy Head, the highest chalk sea cliff in Great Britain and part of the larger Eastbourne Downland Estate.
Borough status in the United Kingdom is granted by royal charter to local government districts in England, Wales and Northern Ireland. The status is purely honorary, and does not give any additional powers to the council or inhabitants of the district. In Scotland, similarly chartered communities were known as royal burghs, although the status is no longer granted.
East Sussex is a county in South East England. It is bordered by the counties of Kent to the north and east, Surrey to the north west and West Sussex to the west, and to the south by the English Channel.
After the election, the composition of the council was
10 seats were contested at the election, with 2 seats being available in Old Town ward after Liberal Democrat councillor Bert Leggett stood down. [3]
A Councillor is a member of a local government council.
During the campaign both the national Liberal Democrat leader Charles Kennedy and Conservative leader Michael Howard came to Eastbourne to support their parties. [3] [4]
Charles Peter Kennedy was a Scottish Liberal Democrat politician who was Leader of the Liberal Democrats from 1999 to 2006, and a Member of Parliament (MP) from 1983 to 2015, latterly for the Ross, Skye and Lochaber constituency.
Michael Howard, Baron Howard of Lympne, is a British politician who served as Leader of the Conservative Party and Leader of the Opposition from November 2003 to December 2005. He previously held cabinet positions in the governments of Margaret Thatcher and John Major, including Secretary of State for Employment, Secretary of State for the Environment and Home Secretary.
The Conservatives gained a seat from the Liberal Democrats to take a one-seat majority on the council with 14 councillors, compared to 13 for the Liberal Democrats. [5] The Conservative gain came in Old Town ward, where Conservative Simon Herbert gained one of the two seats from the Liberal Democrats with 1,926 votes, while Liberal Democrat Maurice Skilton held the other seat with 1,854 votes. [3] Overall turnout at the election was 40.97%, up from 33.6% at the 2003 election. [6]
Voter turnout is the percentage of eligible voters who cast a ballot in an election. Eligibility varies by country, and the voting-eligible population should not be confused with the total adult population. Age and citizenship status are often among the criteria used to determine eligibility, but some countries further restrict eligibility based on sex, race, or religion.
Party | Seats | Gains | Losses | Net gain/loss | Seats % | Votes % | Votes | +/− | |
---|---|---|---|---|---|---|---|---|---|
Conservative | 5 | 1 | 0 | +1 | 50.0 | 50.3 | 15,709 | +0.8% | |
Liberal Democrat | 5 | 0 | 1 | -1 | 50.0 | 36.0 | 11,230 | -3.2% | |
Green | 0 | 0 | 0 | 0 | 0 | 7.9 | 2,464 | +3.8% | |
Labour | 0 | 0 | 0 | 0 | 0 | 5.9 | 1,827 | -0.8% | |
Party | Candidate | Votes | % | ± | |
---|---|---|---|---|---|
Liberal Democrat | Margaret Bannister | 1,177 | 44.7 | -13.4 | |
Conservative | Kenneth Graham | 1,040 | 39.5 | +5.2 | |
Green | Clive Gross | 239 | 9.1 | +1.5 | |
Labour | Richard Goude | 178 | 6.8 | +6.8 | |
Majority | 137 | 5.2 | -18.5 | ||
Turnout | 2,634 | 35.3 | +8.2 | ||
Liberal Democrat hold | Swing | ||||
Party | Candidate | Votes | % | ± | |
---|---|---|---|---|---|
Liberal Democrat | Michael Thompson | 988 | 44.9 | -5.0 | |
Conservative | Edward Abella | 636 | 28.9 | +7.3 | |
Labour | David Brinson | 356 | 16.2 | -6.7 | |
Green | Leslie Dalton | 222 | 10.1 | +4.5 | |
Majority | 352 | 16.0 | -10.9 | ||
Turnout | 2,202 | 31.6 | +5.5 | ||
Liberal Democrat hold | Swing | ||||
Party | Candidate | Votes | % | ± | |
---|---|---|---|---|---|
Liberal Democrat | Irene Sims | 1,210 | 49.8 | +2.9 | |
Conservative | Thomas Walters | 921 | 37.9 | -3.0 | |
Labour | Steven Scott | 164 | 6.7 | -2.0 | |
Green | Christine Quarrington | 137 | 5.6 | +2.1 | |
Majority | 289 | 11.9 | +5.9 | ||
Turnout | 2,432 | 34.1 | +10.2 | ||
Liberal Democrat hold | Swing | ||||
Party | Candidate | Votes | % | ± | |
---|---|---|---|---|---|
Conservative | Barry Taylor | 2,672 | 71.2 | -0.1 | |
Liberal Democrat | Steven Wallis | 589 | 15.7 | -1.1 | |
Green | Kate Arnold | 271 | 7.2 | +2.2 | |
Labour | Dennis Scard | 221 | 5.9 | -1.1 | |
Majority | 2,083 | 55.5 | +1.0 | ||
Turnout | 3,753 | 49.6 | +10.2 | ||
Conservative hold | Swing | ||||
Party | Candidate | Votes | % | ± | |
---|---|---|---|---|---|
Conservative | Simon Herbert | 1,926 | |||
Liberal Democrat | Maurice Skilton | 1,854 | |||
Conservative | John Stanbury | 1,816 | |||
Liberal Democrat | Patricia Habets | 1,739 | |||
Green | Catharine Birchwood | 355 | |||
Green | Jocelyn McCarthy | 289 | |||
Labour | Jonathan Pettigrew | 155 | |||
Labour | Robert Rossetter | 132 | |||
Turnout | 8,266 | 54.9 | +8.0 | ||
Conservative gain from Liberal Democrat | Swing | ||||
Liberal Democrat hold | Swing | ||||
Party | Candidate | Votes | % | ± | |
---|---|---|---|---|---|
Conservative | Barbara Goodall | 2,227 | 65.8 | +1.0 | |
Liberal Democrat | Peter Durrant | 702 | 20.7 | -2.7 | |
Labour | Martin Falkner | 233 | 6.9 | -0.5 | |
Green | Kevin Moore | 225 | 6.6 | +2.2 | |
Majority | 1,525 | 45.0 | +3.6 | ||
Turnout | 3,387 | 44.7 | +8.6 | ||
Conservative hold | Swing | ||||
Party | Candidate | Votes | % | ± | |
---|---|---|---|---|---|
Liberal Democrat | Jon Harris | 1,441 | 47.1 | -7.1 | |
Conservative | Judith Kim-Symes | 1,200 | 39.2 | +6.6 | |
Green | Hugh Norris | 242 | 7.9 | +7.9 | |
Labour | Nora Ring | 176 | 5.8 | -1.8 | |
Majority | 241 | 7.9 | -13.8 | ||
Turnout | 3,059 | 38.4 | +7.8 | ||
Liberal Democrat hold | Swing | ||||
Party | Candidate | Votes | % | ± | |
---|---|---|---|---|---|
Conservative | Christopher Williams | 1,517 | 59.4 | +4.7 | |
Liberal Democrat | Maragret Salsbury | 806 | 31.6 | -13.7 | |
Green | Nancy Dalton | 229 | 9.0 | +9.0 | |
Majority | 711 | 27.9 | +18.5 | ||
Turnout | 2,552 | 38.1 | +0.3 | ||
Conservative hold | Swing | ||||
Party | Candidate | Votes | % | ± | |
---|---|---|---|---|---|
Conservative | Robert Lacey | 1,754 | 59.6 | +3.2 | |
Liberal Democrat | Patrick Rodohan | 724 | 24.6 | -7.6 | |
Green | Finbar O'Shea | 255 | 8.7 | +3.2 | |
Labour | Margaret Pettigrew | 212 | 7.2 | +1.4 | |
Majority | 1,030 | 35.0 | +10.8 | ||
Turnout | 2,945 | 40.1 | +5.1 | ||
Conservative hold | Swing | ||||
The 2003 Worthing Borough Council election took place on 1 May 2003 to elect members of Worthing Borough Council in West Sussex, England. One third of the council was up for election and the Liberal Democrats lost overall control of the council to no overall control. Overall turnout was 28.61%.
The 2008 Wokingham Borough Council election took place on 1 May 2008 to elect members of Wokingham Unitary Council in Berkshire, England. One third of the council was up for election and the Conservative party stayed in overall control of the council.
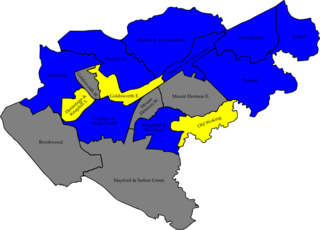
The 2007 Woking Council election took place on 3 May 2007 to elect members of Woking Borough Council in Surrey, England. One third of the council was up for election and the Conservative party gained overall control of the council from no overall control.
The 2004 Fareham Council election took place on 10 June 2004 to elect members of Fareham Borough Council in Hampshire, England. Half of the council was up for election and the Conservative party stayed in overall control of the council.
The 1998 Pendle Borough Council election took place on 7 May 1998 to elect members of Pendle Borough Council in Lancashire, England. One third of the council was up for election and the Liberal Democrats stayed in overall control of the council.
The 2010 Woking Council election took place on 1 May 2010, on the same day as the 2010 general election, to elect members of Woking Borough Council in Surrey, England. One third of the council was up for election and the council stayed under no overall control.
The 2006 Basingstoke and Deane Council election took place on 4 May 2006 to elect members of Basingstoke and Deane Borough Council in Hampshire, England. One third of the council was up for election and the council stayed under no overall control.
The 2004 Hertsmere Borough Council election took place on 10 June 2004 to elect members of Hertsmere Borough Council in Hertfordshire, England. One third of the council was up for election and the Conservative party stayed in overall control of the council.
The 2007 Hertsmere Borough Council election took place on 3 May 2007 to elect members of Hertsmere Borough Council in Hertfordshire, England. One third of the council was up for election and the Conservative party stayed in overall control of the council.
The 2002 Eastbourne Borough Council election took place on 2 May 2002 to elect members of Eastbourne Borough Council in East Sussex, England. The whole council was up for election with boundary changes since the last election in 2000 reducing the number of seats by 3. The Liberal Democrats gained overall control of the council from the Conservative party.
The 2003 Eastbourne Borough Council election took place on 1 May 2003 to elect members of Eastbourne Borough Council in East Sussex, England. One third of the council was up for election and the Liberal Democrats stayed in overall control of the council.
The 2006 Eastbourne Council election took place on 4 May 2006 to elect members of Eastbourne Borough Council in East Sussex, England. One third of the council was up for election and the Conservative party stayed in overall control of the council.
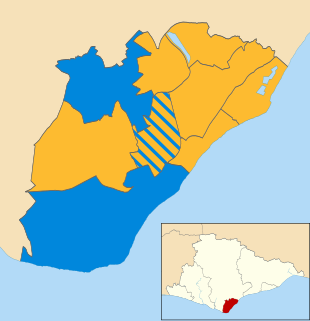
The 2007 Eastbourne Borough Council election took place on 3 May 2007 to elect members of Eastbourne Borough Council in East Sussex, England. The whole council was up for election and the Liberal Democrats gained overall control of the council from the Conservative party.
The 2011 Eastbourne Borough Council election took place on 5 May 2011 to elect members of Eastbourne Borough Council in East Sussex, England. The whole council was up for election and the Liberal Democrats stayed in overall control of the council.
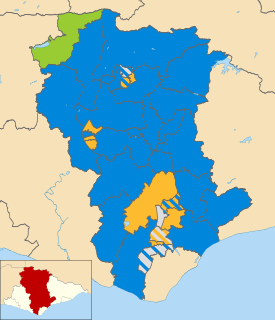
The 2007 Wealden District Council election took place on 3 May 2007 to elect members of Wealden District Council in East Sussex, England. The whole council was up for election and the Conservative party stayed in overall control of the council.
The 2011 Wealden District Council election took place on 5 May 2011 to elect members of Wealden District Council in East Sussex, England. The whole council was up for election and the Conservative party stayed in overall control of the council.
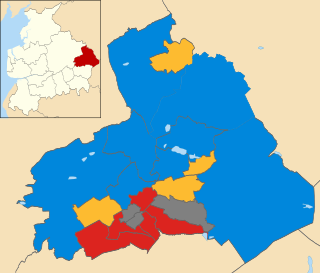
The 2011 Pendle Borough Council election took place on 5 May 2011 to elect members of Pendle Borough Council in Lancashire, England. One third of the council was up for election and the council stayed under no overall control.
The 2012 Pendle Borough Council election took place on 3 May 2012 to elect members of Pendle Borough Council in Lancashire, England. One third of the council was up for election and the council stayed under no overall control.
The 2006 Havant Borough Council election took place on 4 May 2006 to elect members of Havant Borough Council in Hampshire, England. One third of the council was up for election and the Conservative party stayed in overall control of the council.
The 2014 Havant Borough Council election took place on 22 May 2014 to elect members of Havant Borough Council in Hampshire, England. One third of the council was up for election and the Conservative party stayed in overall control of the council.