Worcestershire County Council election, 2017

Last updated
Worcestershire County Council election, 2017

Worcestershire flag.svg


  2013 4 May 20172021 

All 57 council division seats
29 seats needed for a majority

 First partySecond party
 
Party Conservative Labour
Last election3012
Seats won4010
Seat changeIncrease2.svg 10Decrease2.svg 2
Popular vote82,40040,235
Percentage46.8522.88
SwingIncrease2.svg 13.55Decrease2.svg 1.06

 Third partyFourth partyFifth party
 
Party UKIP Liberal Democrat Green
Last election432
Seats won032
Seat changeDecrease2.svg 4Steady2.svgSteady2.svg
Popular vote9,77820,47511,862
Percentage5.5611.646.74
SwingDecrease2.svg 14.88Increase2.svg 3.98Increase2.svg 1.71

Worcestershire UK local election 2017 map.svg

Map showing the results of the 2017 Worcestershire County Council election. Striped divisions have mixed representation.

Council control before election

Conservative

Council control after election

TBD

The 2017 Worcestershire County Council election took place on 4 May 2017 as part of the 2017 local elections in the United Kingdom. [1] All 57 councillors were elected from 53 electoral divisions which returned either one or two county councillors each by first-past-the-post voting for a four-year term of office. The Conservatives extended their majority in the council, gaining ten seats, largely at the expense of Labour and UKIP, who lost six seats between them; the Conservative majority increased from one seat to eleven. The number of seats for the Liberal Democrats and Green remained the same, with the Conservatives gaining the remaining five seats from independent politicians and candidates from smaller parties. The Conservatives lost one seat, Alvechurch, to an independent. The Liberals lost their only seat, St Chads in the Wyre Forest district, after they decided not to field any candidates; the Liberal Democrats held the seat, however. UKIP lost all their seats in this election to the Conservatives.

Worcestershire County Council local government body in England

Worcestershire County Council is the county council for the non-metropolitan county of Worcestershire in England. The most recent election to it were in 2017. Worcestershire County Council has its headquarters is County Hall in Worcester, which was also the headquarters for the preceding Hereford and Worcester County Council.

The wards and electoral divisions in the United Kingdom are electoral districts at sub-national level represented by one or more councillors. The ward is the primary unit of English electoral geography for civil parishes and borough and district councils, electoral ward is the unit used by Welsh principal councils, while the electoral division is the unit used by English county councils and some unitary authorities. Each ward/division has an average electorate of about 5,500 people, but ward-population counts can vary substantially. As at the end of 2014 there were 9,456 electoral wards/divisions in the UK.

Contents

Results

Worcestershire County Council Election Overall Result 2017 [2]
PartySeatsGainsLossesNet gain/lossSeats %Votes %Votes+/−
  Conservative 40111+1070.1846.882,400
  Labour 1002-217.5422.940,235
  Liberal Democrat 31-105.2611.620,475
  Green 200-3.516.711,862
  Other parties 214-33.516.311,140
  UKIP 004-405,69,778

Bromsgrove

Alvechurch
PartyCandidateVotes%±
Independent Charlie Hotham1,17441.94N/A
Conservative June Griffiths1,10139.34Increase2.svg 9.80
Liberal Democrat Sandra Docker28710.25N/A
UKIP James Goad1254.47Decrease2.svg 22.39
Green Peter Harvey1124.00Decrease2.svg 1.27
Turnout 2,79937.95
Independent gain from Conservative Swing Increase2.svg 25.87
Beacon
PartyCandidateVotes%±
Labour Peter McDonald1,54145.46Decrease2.svg 2.12
Conservative Richard Deeming1,41841.83Increase2.svg 5.99
Green Jill Harvey2266.67Decrease2.svg 3.93
Liberal Democrat Diana Ball2056.05N/A
Turnout 3,39036.97
Labour hold Swing Decrease2.svg 4.06
Bromsgrove Central
PartyCandidateVotes%±
Conservative Rita Dent1,16641.70Increase2.svg 6.70
Liberal Democrat Robert Hunter79828.54Increase2.svg 22.63
Labour Jacqui O'Reilly52718.85Decrease2.svg 9.15
UKIP Adrian Smart1866.65Decrease2.svg 19.50
Green Michelle Baker1194.26Increase2.svg 0.53
Turnout 2,79638.33
Conservative hold Swing Increase2.svg 7.93
Bromsgrove East
PartyCandidateVotes%±
Conservative Kit Taylor1,69759.36Increase2.svg 20.26
Liberal Democrat Janet King51417.98Increase2.svg 1.55
Labour Rory Shannon42614.90Decrease2.svg 2.59
Green Stan Baker2227.76N/A
Turnout 2,85936.18
Conservative hold Swing Increase2.svg 11.43
Bromsgrove South
PartyCandidateVotes%±
Labour Christopher Bloore1,26350.50Increase2.svg 1.99
Conservative Claire Jones1,01340.50Increase2.svg 7.82
Liberal Democrat Leah-Nani Alconcel1234.92Increase2.svg 0.77
Green Marcus Draper1024.08Decrease2.svg 3.32
Turnout 2,50131.52
Labour hold Swing Decrease2.svg 3.91
Bromsgrove West
PartyCandidateVotes%±
Labour Luke Mallett1,64064.95Increase2.svg 12.69
Conservative Melanie Britton70928.08Increase2.svg 6.52
Liberal Democrat Michael Mihailovic903.56Increase2.svg 1.08
Green David Baker863.41N/A
Turnout 2,52533.36
Labour hold Swing Increase2.svg 9.61
Clent Hills
PartyCandidateVotes%±
Conservative Karen May1,57445.33Increase2.svg 15.88
Independent Steve Colella1,42641.07N/A
Labour Lorraine Johnson2366.80Increase2.svg 0.32
Green Susan Jones1313.77N/A
Liberal Democrat Leia Beavis1053.02N/A
Turnout 3,47239.54
Conservative gain from Independent Swing Increase2.svg 31.33
Woodvale
PartyCandidateVotes%±
Conservative Shirley Webb1,76462.53Increase2.svg 11.1
Labour Bernard McEldowney72125.56Decrease2.svg 8.83
Liberal Democrat Christopher Walker1736.13N/A
Green Julian Gray1635.78Decrease2.svg 8.4
Turnout 2,82133.42
Conservative hold Swing Increase2.svg 9.72
Wythall
PartyCandidateVotes%±
Conservative James Kent1,23149.80Increase2.svg 17.36
Independent Stephen Peters97039.24Decrease2.svg 11.82
Liberal Democrat Kenneth Richardson1706.88Increase2.svg 4.99
Green Angela Day1014.09N/A
Turnout 2,47234.36
Conservative gain from Independent Swing Increase2.svg 14.59

Malvern Hills

Croome
PartyCandidateVotes%±
Conservative Paul Middlebrough1,09143.16Increase2.svg 13.16
Independent Roger Sutton97038.37Increase2.svg 5.11
Labour Irene Stickley1636.45Decrease2.svg 3.52
UKIP Doug Guest1586.25Decrease2.svg 20.53
Green John Lambeth1465.78N/A
Turnout 2,52836.67
Conservative gain from Independent Swing Increase2.svg 9.14
Hallow
PartyCandidateVotes%±
Conservative Phil Grove1,99171.34Increase2.svg 33.39
Labour Colin Bexley33712.07Increase2.svg 4.13
Liberal Democrat John Drage32011.47N/A
UKIP Danny Young1435.12Decrease2.svg 24.75
Turnout 2,89940.53
Conservative hold Swing Increase2.svg 29.07
Malvern Langland
PartyCandidateVotes%±
Conservative James O'Donnell76733.86Increase2.svg 9.14
Liberal Democrat Caroline Bovey72331.92Increase2.svg 8.54
Labour Lynne Lambeth38416.95Increase2.svg 3.28
Independent Ian Hopwood1556.84N/A
Green Dinah Sage1376.05Decrease2.svg 2.77
UKIP Richard Spencer994.37Decrease2.svg 20.2
Turnout 2,26530.3
Conservative hold Swing Increase2.svg 14.67
Malvern Link
PartyCandidateVotes%±
Conservative Paul Tuthill1,32745.89Increase2.svg 11.45
Liberal Democrat Kwai Hung Chan79427.46Increase2.svg 20.96
Labour Martin Willis40814.11Increase2.svg 0.22
Green William Jenkins2087.19Decrease2.svg 10.45
UKIP Mike Savage1555.36Decrease2.svg 22.17
Turnout 2,89237.65
Conservative hold Swing Increase2.svg 16.81
Malvern Trinity
PartyCandidateVotes%±
Green John Raine93038.18Increase2.svg 13.31
Conservative Tony Baker76531.03Increase2.svg 8.95
Liberal Democrat Kaleem Askar36514.98Decrease2.svg 4.55
Labour Samantha Charles26210.76Increase2.svg 1.88
UKIP Len Marshall1235.05Decrease2.svg 19.59
Turnout 2,43637.36
Green hold Swing Increase2.svg 16.45
Powick
PartyCandidateVotes%±
Liberal Democrat Tom Wells2,40772.2Increase2.svg 5.10
Conservative Justin Chieffo80724.21Increase2.svg 9.11
UKIP David Barrie1203.60Decrease2.svg 8.95
Turnout 3,33443.94
Liberal Democrat hold Swing Decrease2.svg 7.11
Tenbury
PartyCandidateVotes%±
Conservative Ken Pollock1,77260.07Increase2.svg 4.68
Labour Jonathan Pryce Morgan55118.68Increase2.svg 8.31
Liberal Democrat Elaine Drage2558.64N/A
Green Stephen Main1926.51Decrease2.svg 2.20
UKIP Malcolm Delingpole1806.10Decrease2.svg 19.43
Turnout 2,95036.80
Conservative hold Swing Increase2.svg 12.06

Redditch

Arrow Valley East
PartyCandidateVotes%±
Conservative Juliet Brunner2,00019.67Increase2.svg 7.29
Conservative Tom Baker-Price1,95719.25Increase2.svg 8.84
Labour Joe Baker1,91318.81Increase2.svg 2.57
Labour Wanda King1,63716.10Increase2.svg 1.09
UKIP Paul Swansborough9659.49Decrease2.svg 9.38
UKIP Peter Bridle8498.35Decrease2.svg 10.52
Liberal Democrat David Gee3163.11Increase2.svg 1.03
Liberal Democrat Hans Windheuser2092.06Increase2.svg 0.26
Green Rylma White1551.52Decrease2.svg 0.46
Green Robert Wardell1671.64Decrease2.svg 0.34
Turnout 10,16832.47
Conservative gain from UKIP Swing Increase2.svg 8.91
Conservative gain from Labour Swing Increase2.svg 5.71
Arrow Valley West
PartyCandidateVotes%±
Labour Andrew Fry1,94322.98Decrease2.svg 0.51
Labour Pattie Hill1,79721.25Decrease2.svg 0.26
Conservative Matthew Dormer1,57418.61Increase2.svg 5.4
Conservative David Thain1,27615.09Increase2.svg 3.33
UKIP Scott Preston4685.53Decrease2.svg 13.18
UKIP Kathy Haslam4665.51Decrease2.svg 13.2
Liberal Democrat Diane Thomas2903.43Increase2.svg 0.55
Liberal Democrat Russell Taylor2202.60Decrease2.svg 0.04
Green Rachel Wardell1762.08Decrease2.svg 1.45
Green Kevin White1261.49Decrease2.svg 0.78
Independent Sharnah Wynn1211.43N/A
Turnout 8,45730.74
Labour hold Swing Decrease2.svg 2.95
Labour hold Swing Decrease2.svg 1.80
Redditch North
PartyCandidateVotes%±
Labour Robin Lunn1,99421.75Increase2.svg 2.97
Conservative Brandon Clayton1,92120.96Increase2.svg 6.64
Labour Graham Vickery1,84120.08Increase2.svg 1.34
Conservative Gareth Prosser1,69818.52Increase2.svg 5.49
UKIP Sally Woodhall3884.23Decrease2.svg 9.67
UKIP Barry Thornton3774.11Decrease2.svg 9.57
Green Steven Pound2642.88Increase2.svg 0.28
Liberal Democrat Anthony Pitt2572.80Increase2.svg 1.10
Green Simon Venables2382.60Increase2.svg 0.92
Liberal Democrat Ian Webster1892.06Increase2.svg 0.50
Turnout 9,16732.87
Labour hold Swing Increase2.svg 4.81
Conservative gain from Labour Swing Increase2.svg 3.99
Redditch South
PartyCandidateVotes%±
Conservative Roger Bennett2,99828.98Increase2.svg 11.73
Conservative Jane Potter2,51924.35Increase2.svg 7.82
Labour Dr. Gillian Cooper1,46714.18Increase2.svg 0.57
Labour Mike Lewington1,31312.69Increase2.svg 0.25
UKIP Melvyn Haugh4634.48Decrease2.svg 12.65
Liberal Democrat Pamela Gee3573.45Increase2.svg 1.19
Liberal Democrat Rita Hindle3413.30Increase2.svg 1.72
UKIP David Greenwood3383.27Decrease2.svg 11.27
Green Claire Davies3123.02Increase2.svg 0.26
Green Alistair Waugh2372.29Increase2.svg 0.38
Turnout 10,34534.58
Conservative hold Swing Increase2.svg 12.19
Conservative gain from UKIP Swing Increase2.svg 9.55

Worcester

Bedwardine
PartyCandidateVotes%±
Conservative Alan Amos1,46053.05Increase2.svg 14.05
Labour Daniel Walton80829.36Increase2.svg 6.48
Liberal Democrat Mike Mullins2187.92Increase2.svg 2.72
Green Daniel Daye1405.09Decrease2.svg 0.16
UKIP Paul Hickling1264.58Decrease2.svg 20.56
Turnout 2,75238.66
Conservative hold Swing Increase2.svg 17.31
Claines
PartyCandidateVotes%±
Conservative Andy Stafford1,54345.64Increase2.svg 15.95
Liberal Democrat Mel Allcott1,09632.42Decrease2.svg 1.21
Labour Robert Lodge44613.19Increase2.svg 1.49
Green Peter Robinson1975.83Decrease2.svg 1.02
UKIP Mark Hulme992.93Decrease2.svg 15.20
Turnout 3,38144.97
Conservative gain from Liberal Democrat Swing Increase2.svg 8.58
Gorse Hill and Warndon
PartyCandidateVotes%±
Labour Ceri Stalker92347.82Decrease2.svg 4.37
Conservative Phoenix Jones58730.41Increase2.svg 18.73
UKIP Owen Cleary27614.30Decrease2.svg 16.85
Green Paul Snookes1055.44Increase2.svg 0.46
Britain First Linda Bell392.02N/A
Turnout 1,93025.17
Labour hold Swing Increase2.svg 10.61
Nunnery
PartyCandidateVotes%±
Labour Co-op Pat Agar1,04949.43Decrease2.svg 1.70
Conservative Chris Mitchell70833.36Increase2.svg 2.75
UKIP Jon Barras1486.97N/A
Green Barbara Mitra1255.89Decrease2.svg 2.66
Liberal Democrat Karen Lawrence1253.82N/A
Britain First Carl Mason110.52N/A
Turnout 2,12232.50
Labour Co-op hold Swing Decrease2.svg 2.26
Rainbow Hill
PartyCandidateVotes%±
Labour Co-op Paul Denham1,02749.42Increase2.svg 4.0
Conservative Francis Lankester61529.60Increase2.svg 1.82
Green Marjory Bisset1507.22Increase2.svg 0.82
UKIP David Carney1125.39Decrease2.svg 13.94
Liberal Democrat Taylor Jon713.42N/A
Women's Equality Leisa Taylor663.18N/A
Independent Alex Rugg371.78N/A
Turnout 2,07831.16
Labour Co-op hold Swing Increase2.svg 2.91
Riverside
PartyCandidateVotes%±
Conservative Simon Geraghty1,56149.94Increase2.svg 10.99
Labour Lynn Denham99431.80Decrease2.svg 2.04
Green Hannah Cooper2387.61Increase2.svg 0.79
Liberal Democrat Ken Carpenter2116.75N/A
UKIP Hazel Finch1223.90Decrease2.svg 14.35
Turnout 3,12639.26
Conservative hold Swing Increase2.svg 6.52
St. John
PartyCandidateVotes%±
Labour Co-op Richard Udall1,00357.38Decrease2.svg 2.35
Conservative Irene Deamer48127.52Increase2.svg 6.23
UKIP Rob Menzies1025.84N/A
Green Richard Morris915.21Decrease2.svg 1.85
Liberal Democrat Steve Mather714.06N/A
Turnout 1,74830.12
Labour Co-op hold Swing Decrease2.svg 4.29
St. Peter
PartyCandidateVotes%±
Conservative Steve MacKay2,01452.57Increase2.svg 1.62
Green Jane Moorhouse1,36335.58Increase2.svg 23.11
Labour Stephen Tallett3479.06Decrease2.svg 20.71
UKIP John Beacham1072.79N/A
Turnout 3,83144.74
Conservative hold Swing Increase2.svg 11.27
St. Stephen
PartyCandidateVotes%±
Green Matthew Jenkins1,55453.05Increase2.svg 10.61
Conservative Alan Feeney85528.32Decrease2.svg 4.44
Labour Saiful Islam47715.80Decrease2.svg 9.0
UKIP Paul Boyles1334.41N/A
Turnout 3,01938.27
Green hold Swing Increase2.svg 7.53
Warndon Parish
PartyCandidateVotes%±
Conservative Andy Roberts1,56458.69Increase2.svg 6.64
Labour Co-op Paul Mountain59622.36Increase2.svg 1.46
Liberal Democrat Darrell Butler2158.07N/A
UKIP Jacqueline Burnett1545.78Decrease2.svg 22.14
Green Alison Morgan1365.10Decrease2.svg 4.03
Turnout 2,66530.94
Conservative hold Swing Increase2.svg 14.39

Wychavon

Bowbrook
PartyCandidateVotes%±
Conservative Tony Miller2,15269.02Increase2.svg 22.77
Labour Steve Ainsworth35711.45Decrease2.svg 0.76
Liberal Democrat John Littlechild35411.35Increase2.svg 3.22
UKIP Peter Jewell1334.27Decrease2.svg 29.15
Green Edward Cohen1223.91N/A
Turnout 3,11840.40
Conservative hold Swing Increase2.svg 25.96
Bredon
PartyCandidateVotes%±
Conservative Adrian Hardman2,37172.20Increase2.svg 14.54
Liberal Democrat Elizabeth Turier46514.16Increase2.svg 2.53
Labour David Niblett2367.19Decrease2.svg 2.62
Green Katri Hastings2126.46N/A
Turnout 3,28442.57
Conservative hold Swing Increase2.svg 17.72
Broadway
PartyCandidateVotes%±
Conservative Liz Eyre1,85872.69Decrease2.svg 0.54
Liberal Democrat Diana Brown31712.40Decrease2.svg 1.43
Labour Martin Vernall2178.49Decrease2.svg 4.46
Green Matthew Collins1646.42N/A
Turnout 2,55638.31
Conservative hold Swing Decrease2.svg 0.99
Droitwich East
PartyCandidateVotes%±
Conservative Bob Brookes1,98167.38Increase2.svg 32.63
Liberal Democrat Margaret Rowley41914.25Increase2.svg 1.16
Labour Val Humphries41514.12Decrease2.svg 5.17
Green Jane Zurek1254.25Decrease2.svg 0.82
Turnout 2,94037.55
Conservative hold Swing Increase2.svg 30.22
Droitwich West
PartyCandidateVotes%±
Conservative Richard Morris1,10553.41Increase2.svg 16.60
Labour Alan Humphries51024.65Decrease2.svg 0.40
Liberal Democrat Rod Hopkins28713.87Increase2.svg 7.97
Green Neil Franks1678.07N/A
Turnout 2,06727.57
Conservative hold Swing Increase2.svg 24.42
Evesham North West
PartyCandidateVotes%±
Conservative John Smith1,16051.95Increase2.svg 10.14
Labour Michael Worrall45620.42Increase2.svg 10.24
Liberal Democrat Tim Haines38417.20Increase2.svg 7.57
Green Patricia Buckland23310.43N/A
Turnout 2,23326.96
Conservative hold Swing Increase2.svg 24.26
Evesham South
PartyCandidateVotes%±
Conservative Bob Banks1,45359.28Increase2.svg 6.46
Labour Mary Campbell49320.11Increase2.svg 0.94
Liberal Democrat Julie Haines22811.51Decrease2.svg 4.20
Green Fay Whitfield2239.10N/A
Turnout 2,45126.31
Conservative hold Swing Increase2.svg 3.70
Harvington
PartyCandidateVotes%±
Conservative Anthony Hopkins2,05667.37Decrease2.svg 6.26
Labour John Gowers40013.11Decrease2.svg 13.26
Liberal Democrat Jack Parsons2698.81N/A
UKIP Harry Cottam1815.93N/A
Green Sarah Cohen1464.78N/A
Turnout 3,05239.48
Conservative hold Swing Decrease2.svg 9.76
Littletons
PartyCandidateVotes%±
Conservative Alastair Adams1,99163.37Increase2.svg 14.45
Liberal Democrat Keith Wright58218.52Decrease2.svg 21.73
Labour Viv Eden38112.13Increase2.svg 1.30
Green Patrick Hogan1885.98N/A
Turnout 3,14234.18
Conservative hold Swing Increase2.svg 18.09
Ombersley
PartyCandidateVotes%±
Conservative Peter Tomlinson2,15377.31Increase2.svg 29.33
Liberal Democrat Peter Evans28510.23Increase2.svg 5.07
Labour Charlie Chan2428.69Increase2.svg 0.11
Green Nicola Porter1053.77Decrease2.svg 1.32
Turnout 2,78533.19
Conservative hold Swing Increase2.svg 31.27
Pershore
PartyCandidateVotes%±
Liberal Democrat Liz Tucker2,00557.83Increase2.svg 4.30
Conservative Linda Robinson1,21935.16Increase2.svg 13.26
Green Nina Freund2437.01N/A
Turnout 3,46741.48
Liberal Democrat hold Swing Decrease2.svg 8.78
Upton Snodsbury
PartyCandidateVotes%±
Conservative Rob Adams2,16873.29Increase2.svg 16.27
Liberal Democrat Adrian Key2729.20Increase2.svg 2.85
Labour Chris Knight2458.28Increase2.svg 1.05
UKIP Jonathan Burrow1404.73Decrease2.svg 20.24
Green Mike Parker1334.50Increase2.svg 0.08
Turnout 2,95838.72
Conservative hold Swing Increase2.svg 18.26

Wyre Forest

Bewdley
PartyCandidateVotes%±
Conservative Rebecca Vale1,30546.02Increase2.svg 13.70
Labour Rod Stanczyszyn48817.21Decrease2.svg 2.00
Health Concern Calne Edginton-White47416.71Decrease2.svg 2.99
Independent Jim Lawson1665.85N/A
Liberal Democrat Rachel Akathiotis1495.25N/A
UKIP Chris Wood1465.15Decrease2.svg 19.52
Green Anna Coleman1083.81Decrease2.svg 0.28
Turnout 2,83638.70
Conservative hold Swing Increase2.svg 16.61
Chaddesley
PartyCandidateVotes%±
Conservative Marcus Hart1,23645.56Increase2.svg 16.54
Independent Helen Dyke97335.94Decrease2.svg 10.24
Labour Dave Jones2067.59Decrease2.svg 1.85
Health Concern Keith Robertson1294.75Decrease2.svg 9.25
UKIP Phil Daniels903.32Decrease2.svg 18.52
Green Doug Hine772.84N/A
Turnout 2,71338.68
Conservative hold Swing Increase2.svg 13.39
Cookley, Wolverley and Wribbenhall
PartyCandidateVotes%±
Conservative Ian Hardiman1,08738.32Increase2.svg 4.43
Independent Gordon Yarranton55419.53N/A
Labour Owen Raybould49117.31Decrease2.svg 9.34
Health Concern Linda Candlin35512.51Decrease2.svg 2.68
UKIP David Field1425.01Decrease2.svg 15.26
Green Kate Spohrer1294.55Increase2.svg 1.83
Liberal Democrat Michael Akathiotis792.78N/A
Turnout 2,83736.50
Conservative hold Swing Increase2.svg 6.89
St. Barnabas
PartyCandidateVotes%±
Conservative Anne Hingley1,40553.79Increase2.svg 21.71
Labour Nigel Knowles89834.38Increase2.svg 7.06
UKIP William Hopkins1656.32Decrease2.svg 11.84
Liberal Democrat Heidi Worth893.41Increase2.svg 1.71
Green Martin Layton552.11N/A
Turnout 2,61233.99
Conservative hold Swing Increase2.svg 14.39
St. Chads
PartyCandidateVotes%±
Liberal Democrat Frances Oborski93741.59N/A
Conservative Julian Phillips66829.65Increase2.svg 14.79
Labour Nick Savage35515.76Increase2.svg 4.43
UKIP Martin Stooke2099.28Decrease2.svg 10.72
Green Brett Caulfield843.73Increase2.svg 1.94
UKIP Chris Wood1465.15Decrease2.svg 19.52
Turnout 2,25330.95
Liberal Democrat gain from Liberal Swing Increase2.svg 9.45
St. Georges and St. Oswald
PartyCandidateVotes%±
Health Concern Mary Rayner73934.86Increase2.svg 6.02
Conservative Kevin Gale48322.78Increase2.svg 8.43
Liberal Democrat Shazu Miah36917.41N/A
Labour Mumshad Ahmed34016.04Decrease2.svg 7.66
UKIP Sophie Edginton1115.24Decrease2.svg 21.20
Green Dave Finch783.68Increase2.svg 0.50
Turnout 2,12028.06
Health Concern hold Swing Increase2.svg 13.61
St. Johns
PartyCandidateVotes%±
Conservative Tracey Onslow98746.73Increase2.svg 15.88
Labour Bernadette Connor36517.28Decrease2.svg 3.42
Health Concern Sue Meekings36117.09Increase2.svg 2.22
Liberal Democrat Clare Cassidy1808.52N/A
UKIP Craig Leonard1436.77Decrease2.svg 15.31
Green Vicky Lea763.60Increase2.svg 1.95
Turnout 2,11228.34
Conservative hold Swing Increase2.svg 15.60
St. Marys
PartyCandidateVotes%±
Conservative Nathan Desmond97843.104Increase2.svg 17.97
Labour Gareth Webster50422.21Decrease2.svg 1.16
UKIP George Connolly27312.03Decrease2.svg 15.40
Health Concern Peter Young23510.36Decrease2.svg 5.13
Liberal Democrat Adrian Beavis2038.95N/A
Green John Davis763.35Increase2.svg 1.23
Turnout 2,26924.65
Conservative gain from UKIP Swing Increase2.svg 16.69
Stourport-on-Severn
PartyCandidateVotes%±
Conservative Chris Rogers1,95220.41Increase2.svg 9.73
Conservative Paul Harrison1,74518.25Increase2.svg 7.79
Labour Cliff Brewer1,15112.03Decrease2.svg 0.35
Health Concern John Thomas1,09911.49Decrease2.svg 1.17
Health Concern Nicky Martin1,08411.33Decrease2.svg 3.16
Labour Jill Hawes1,03410.81Increase2.svg 1.11
UKIP John Holden4915.13Decrease2.svg 9.90
UKIP Berenice Dawes4214.40Decrease2.svg 8.09
Liberal Democrat Simon Ford2042.13N/A
Liberal Democrat Chris Pratt1741.82N/A
Green Nicholas Atkinson1111.16Decrease2.svg 0.96
Green Phil Oliver981.02N/A
Turnout 9,56430.26
Conservative gain from UKIP Swing Increase2.svg 9.82
Conservative gain from Health Concern Swing Increase2.svg 5.48

Related Research Articles

Thanet District Council in Kent, England is elected every four years.

2007 Worcester City Council election

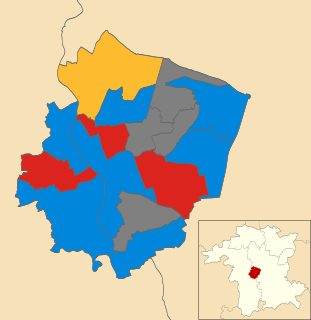
The 2007 Worcester City Council election took place on 3 May 2007 to elect members of Worcester District Council in Worcestershire, England. One third of the council was up for election and the Conservative party stayed in overall control of the council.

2013 West Sussex County Council election

The West Sussex County Council election, 2013 took place on 2 May 2013, as part of the United Kingdom local elections, 2013. All 71 electoral divisions were up for election, which returned one county councillor each by first-past-the-post voting for a four-year term of office. At this election, the Conservative Party was seeking to retain overall control of the council, and the Liberal Democrats to maintain their position as the main opposition party.

2013 Wiltshire Council election

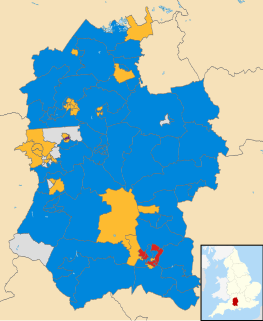
Elections to the Wiltshire Council unitary authority took place on 2 May 2013. All ninety-eight seats were up for election, with each councillor being elected in a single-member electoral division, although in six of the divisions only one candidate was nominated and was thus declared the winner without elections taking place.

2013 Hampshire County Council election

An election to Hampshire County Council took place on 2 May 2013 as part of the United Kingdom local elections, 2013. 78 councillors were elected from 75 electoral divisions, which returned either one or two county councillors each by first-past-the-post voting for a four-year term of office. The electoral divisions were the same as those of the previous election in 2009. No elections were held in Portsmouth and Southampton, which are unitary authorities outside the area covered by the County Council. The election saw the Conservative Party retain overall control of the council, with a reduced majority of five councillors.

2013 Hertfordshire County Council election

An election to Hertfordshire County Council took place on 2 May 2013 as part of the United Kingdom local elections, 2013. 77 electoral divisions elected one county councillor each by first-past-the-post voting for a four-year term of office. The electoral divisions were the same as those used at the previous election in 2009.

2013 Essex County Council election

An election to Essex County Council took place on 2 May 2013 as part of the United Kingdom local elections, 2013. 75 councillors were elected from 70 electoral divisions, which returned either one or two county councillors each by first-past-the-post voting for a four-year term of office. The electoral divisions were the same as those used at the previous election in 2009. No elections were held in Thurrock or Southend-on-Sea, which are unitary authorities outside the area covered by the County Council.

2013 Isle of Wight Council election

The 2013 Isle of Wight Council election was held on 2 May 2013 to elect all 40 members for a four-year term to the Isle of Wight Council, a unitary authority which governs the Isle of Wight. Going into the election, the Conservative Party was looking to gain a third term in power after first being elected to overall control in 2005, but in one of the shock results of the wider local elections being held in the country, the Conservatives lost overall control of the council, having been reduced to 15 seats, 6 short of a majority of 21. The 'Island Independents', a mutually supporting group of candidates and councillors running as independents, gained the same number of seats, whilst other independents, UKIP, Labour, and a Liberal Democrat made up the remainder.

2013 Staffordshire County Council election

An election to Staffordshire County Council took place on 2 May 2013 as part of the United Kingdom local elections, 2013. 62 electoral divisions returned one county councillor each by first-past-the-post voting for a four-year term of office. Following a boundary review, new electoral division boundaries were established for this election. No elections were held in Stoke-on-Trent, which is a unitary authority outside the area covered by the County Council. The council continues to be administered on the Leader and Cabinet model.

2013 Northamptonshire County Council election

An election to Northamptonshire County Council took place on 2 May 2013 as part of the United Kingdom local elections, 2013. Following a boundary review, the number of county councillors was reduced from 73 to 57 from this election. All members were elected by first-past-the-post voting from single-member electoral divisions for a four-year term of office. The Conservative Party held on to their overall majority, having held overall control of the council since 2005.

2014 North East Lincolnshire Council election

The 2014 North East Lincolnshire Council election took place on 22 May 2014 to elect members of North East Lincolnshire Council in England. This was on the same day as other local elections. These elections saw UKIP making significant gains largely at the expense of Labour, and stripping them of their majority on the council.

2006 West Oxfordshire District Council election

The 2006 West Oxfordshire District Council election took place on 4 May 2006 to elect members of West Oxfordshire District Council in Oxfordshire, England. One third of the council was up for election and the Conservative party stayed in overall control of the council.

2017 United Kingdom local elections

The 2017 United Kingdom local elections were held on Thursday 4 May 2017. Local elections were held across Great Britain, with elections to 35 English local authorities and all councils in Scotland and Wales.

2017 Gloucestershire County Council election

The 2017 Gloucestershire County Council election took place on 4 May 2017 as part of the 2017 local elections in the United Kingdom. All 53 councillors were elected from electoral divisions which returned one county councillor each by first-past-the-post voting for a four-year term of office. Control of the council went from a Conservative Party minority to a majority administration.

2017 Norfolk County Council election

The 2017 Norfolk County Council election took place on 4 May 2017 as part of the 2017 local elections in the United Kingdom.

2017 Surrey County Council election

The 2017 Surrey County Council election took place as part of the 2017 local elections in the UK. All 81 councillors were elected for single-member electoral divisions for a four-year term. The electoral system used is first-past-the-post voting.

2017 West Sussex County Council election

The 2017 West Sussex County Council election took place as part of the 2017 local elections in the UK. All councillors were elected for single-member electoral divisions for a four-year term. The voting system used was first-past-the-post.

2017 Welsh local elections

Local elections were held in Wales on Thursday 4 May 2017 to elect members of all 22 local authorities, including the Isle of Anglesey, which was last up for election in 2013 due to having its elections delayed for a year. These local elections were held alongside local elections in Scotland and parts of England.

Elections to Cannock Chase District Council took place on 3 May 2018 on the same day as other local elections in England. A third of the council was up for election, meaning a total of 13 councillors were elected from all but two of the council's wards.

2018 Sunderland City Council election

The 2018 Sunderland City Council election took place on 3 May 2018 to elect members of Sunderland City Council in England. The election took place on the same day as other local elections.

References

  1. "Upcoming elections & referendums". Electoral Commission. Retrieved 15 September 2016.
  2. "Worcestershire County Council election results 2017". Worcestershire County Council. 2017-05-05. Retrieved 2017-05-10.