Derbyshire County Council election, 2017

Last updated
Derbyshire County Council election, 2017
Derbyshire flag.svg
  2013 4 May 20172021 

All 64 seats to Derbyshire County Council
33 seats needed for a majority

 First partySecond partyThird party
 
Party Conservative Labour Liberal Democrat
Seats before18433
Seats won37243
Seat changeIncrease2.svg19Decrease2.svg19Steady2.svg

Derbyshire UK local election 2017 map.svg
Map showing the results of the 2017 Derbyshire County Council elections.

Council control before election

Labour

Council control after election

Conservative

An election to Derbyshire County Council took place on 4 May 2017 as part of the United Kingdom local elections, 2017. 64 councillors were elected from 61 electoral divisions which returned either one or two county councillors each by first-past-the-post voting for a four-year term of office. [1] No elections were held in the City of Derby, which is a unitary authority outside the area covered by the County Council. The Conservative Party won back control of the council, taking thirty-seven of the authority's sixty-four seats.

Derbyshire County Council British administrative body

Derbyshire County Council is the upper-tier local authority for the non-metropolitan county of Derbyshire, England. It has 64 councillors representing 61 divisions, with three divisions having two members each. They are Glossop and Charlesworth, Alfreton and Somercotes, and Eckington and Killamarsh. The authority is controlled by the Conservative Party, who won control in the May 2017 local council election.

First-past-the-post voting voting system in which voters select one candidate, and the candidate who receives more votes than any other candidate wins

A first-past-the-post electoral system is one in which voters indicate on a ballot the candidate of their choice, and the candidate who receives the most votes wins. This is sometimes described as winner takes all. First-past-the-post voting is a plurality voting method. FPTP is a common, but not universal, feature of electoral systems with single-member electoral divisions, and is practiced in close to one third of countries. Notable examples include Canada, India, the United Kingdom, and the United States, as well as most of their current or former colonies and protectorates.

Contents

All locally registered electors (British, Irish, Commonwealth and European Union citizens) who were aged 18 or over on Thursday 4 May 2017 were entitled to vote in the local elections. Those who were temporarily away from their ordinary address (for example, away working, on holiday, in student accommodation or in hospital) were also entitled to vote in the local elections, [2] although those who had moved abroad and registered as overseas electors cannot vote in the local elections. It is possible to register to vote at more than one address (such as a university student who had a term-time address and lives at home during holidays) at the discretion of the local Electoral Register Office, but it remains an offence to vote more than once in the same local government election. [3]

In general, a Commonwealth citizen is a citizen of a member state of the Commonwealth of Nations. This designation is given legal effect in the nationality laws of some Commonwealth countries, and Commonwealth citizens may enjoy some privileges in the United Kingdom and, less commonly, other member states. Each Commonwealth country determines what special rights, if any, are accorded to citizens of other Commonwealth countries. The status is most significant in British law and has little effect in many other Commonwealth countries, such as Canada.

European Union Economic and poitical union of states located in Europe

The European Union (EU) is a political and economic union of 28 member states that are located primarily in Europe. It has an area of 4,475,757 km2 (1,728,099 sq mi) and an estimated population of about 513 million. The EU has developed an internal single market through a standardised system of laws that apply in all member states in those matters, and only those matters, where members have agreed to act as one. EU policies aim to ensure the free movement of people, goods, services and capital within the internal market, enact legislation in justice and home affairs and maintain common policies on trade, agriculture, fisheries and regional development. For travel within the Schengen Area, passport controls have been abolished. A monetary union was established in 1999 and came into full force in 2002 and is composed of 19 EU member states which use the euro currency.

Election results

Derbyshire County Council Election Overall Result 2017 [4]
PartySeatsGainsLossesNet gain/lossSeats %Votes %Votes+/−
  Conservative 37190Increase2.svg 1957.843.9100,574
  Labour 24019Decrease2.svg 1937.536.583,422
  Liberal Democrat 322Steady2.svg4.711.526,262
  UKIP 000Steady2.svg04.29,640
  Green 000Steady2.svg02.14,779
  Other parties 000Steady2.svg01.84,222

Derbyshire County Council – Results by District

Amber Valley Borough

(10 seats, 9 electoral divisions)

Amber Valley Borough Summary Result 2017
PartySeatsGainsLossesNet gain/lossSeats %Votes %Votes+/−
  Conservative 850Increase2.svg 58048.720,170
  Labour 205Decrease2.svg 52037.115,382
  UKIP 000Steady2.svg04.61,896
  Liberal Democrat 000Steady2.svg04.41,840
  Green 000Steady2.svg04.31,762
  Other parties 000Steady2.svg00.9358

Alfreton and Somercotes

Alfreton & Somercotes (2 seats)
PartyCandidateVotes%
Labour Paul Smith2,67723.2
Labour Steve Marshall-Clarke2,59122.4
Conservative Kathy Moss2,40820.8
Conservative Gareth Gee2,31120.0
UKIP Stuart Flintoff Bent7226.2
Green Steve Elliott3753.2
Liberal Democrat Vikki Bonsall2842.5
Liberal Democrat Kate Smith1951.7
Turnout 11563
Labour hold
Labour hold

Alport and Derwent

Alport & Derwent (1 seat)
PartyCandidateVotes%
Conservative David Taylor2,55057.9
Labour Jyoti Michael Wilkinson1,24928.4
Liberal Democrat Paul Smith3297.5
Green William MacFarlane2806.4
Turnout 4408
Conservative hold

Belper

Belper (1 seat)
PartyCandidateVotes%
Conservative Peter Makin1,71446.3
Labour John Robert Owen1,59042.9
Green Dave Wells2266.1
Liberal Democrat Richard Alan Salmon1754.7
Turnout 3705
Conservative gain from Labour

Duffield and Belper South

Duffield & Belper South (1 seat)
PartyCandidateVotes%
Conservative Chris Short1,77047.8
Labour Carol Angharad88924.0
Green Sue MacFarlane43911.8
Independent Stuart John Bradford3589.7
Liberal Democrat Jeremy Richard Benson2506.7
Turnout 3706
Conservative hold

Greater Heanor

Greater Heanor (1 seat)
PartyCandidateVotes%
Conservative Alexander George Stevenson1,43147.9
Labour Paul Jones1,15838.8
UKIP Daniel Joseph Bamford2618.7
Liberal Democrat Joel Hunt712.4
Green Christina Ann Smith672.2
Turnout 2988
Conservative gain from Labour

Heanor Central

Heanor Central (1 seat)
PartyCandidateVotes%
Conservative Richard Henry Iliffe1,38843.6
Labour Celia Mary Cox1,30541.0
UKIP Geoff Aldwinckle3159.9
Liberal Democrat George White1223.8
Green James Major John Brooks551.7
Turnout 3185
Conservative gain from Labour

Horsley

Horsley (1 seat)
PartyCandidateVotes%
Conservative Kevin Buttery2,61364.1
Labour John Christopher Porter93022.8
UKIP Adrian William Nathan2125.2
Liberal Democrat Tom Hague1974.8
Green Lian Pizzey1243.0
Turnout 4076
Conservative hold

Ripley East and Codnor

Ripley East & Codnor (1 seat)
PartyCandidateVotes%
Conservative Ron Ashton1,78952.2
Labour Steve Freeborn1,31538.4
UKIP Gaz Smith1795.2
Green Alex Bear772.2
Liberal Democrat Peter Jelf661.9
Turnout 3426
Conservative gain from Labour

Ripley West and Heage

Ripley West & Heage (1 seat)
PartyCandidateVotes%
Conservative Trevor Mark Ainsworth2,19650.5
Labour David Alan Williams1,67838.6
UKIP Philip Sanders Rose2074.8
Liberal Democrat Richard Smeeton1513.5
Green Marian Alexandra Taylor1192.7
Turnout 4351
Conservative gain from Labour

Bolsover District

(6 seats, 6 electoral divisions)

Bolsover District Summary Result 2017
PartySeatsGainsLossesNet gain/lossSeats %Votes %Votes+/−
  Labour 600Steady2.svg10052.48106
  Conservative 000Steady2.svg029.94620
  Liberal Democrat 000Steady2.svg06.2963
  UKIP 000Steady2.svg05.8892
  TUSC 000Steady2.svg02.4365
  Other parties 000Steady2.svg03.3515

Barlborough and Clowne

Barlborough & Clowne (1 seat)
PartyCandidateVotes%
Labour Anne Western1,49258.0
Conservative David Carl Dixon95137.0
Liberal Democrat Ben Marshall1305.1
Turnout 2573
Labour hold

Bolsover North

Bolsover North (1 seat)
PartyCandidateVotes%
Labour Duncan McGregor1,41657.7
Conservative Neil David Yewman71729.2
TUSC Elaine Evans1636.6
Liberal Democrat Jayne Phoenix1606.5
Turnout 2456
Labour hold

Bolsover South

Bolsover South (1 seat)
PartyCandidateVotes%
Labour Co-op Joan Elizabeth Dixon1,33552.6
Conservative Sophie Dack84833.4
TUSC Jon Dale2028.0
Liberal Democrat Steven Raison1536.0
Turnout 2538
Labour Co-op hold

Shirebrook and Pleasley

Shirebrook & Pleasley (1 seat)
PartyCandidateVotes%
Labour Christine Dale1,22248.4
Independent David Anthony Taylor51520.4
Conservative Katharine Ann Burrow43017.0
UKIP Mark Steven Nolan2138.4
Liberal Democrat Ross Shipman1475.8
Turnout 2527
Labour hold

South Normanton and Pinxton

South Normanton & Pinxton (1 seat)
PartyCandidateVotes%
Labour Jim Coyle1,13545.9
Conservative David Tillyer80232.4
UKIP Jacqui Calladine34213.8
Liberal Democrat Martin Cheung1967.9
Turnout 2475
Labour hold

Tibshelf

Tibshelf (1 seat)
PartyCandidateVotes%
Labour Clive Richard Moesby1,50652.1
Conservative Samuel Jacob Boam87230.2
UKIP Ray Calladine33711.7
Liberal Democrat David Alister Roulston1776.1
Turnout 2892
Labour hold

Chesterfield Borough

(9 seats, 9 electoral divisions)

Chesterfield Borough Summary Result 2017
PartySeatsGainsLossesNet gain/lossSeats %Votes %Votes+/−
  Labour 701Decrease2.svg 177.7746.912582
  Liberal Democrat 111Steady2.svg11.1123.86392
  Conservative 110Increase2.svg 111.1123.56306
  UKIP 000Steady2.svg01.0277
  Green 000Steady2.svg00.3286
  Other parties 000Steady2.svg04.41187

Birdholme

Birdholme (1 seat)
PartyCandidateVotes%
Labour Dave Allen1,64659.2
Conservative Paul Gibbons75727.2
Liberal Democrat Amanda Jane Brassington37713.6
Turnout
Labour hold

Boythorpe and Brampton South

Boythorpe & Brampton South (1 seat)
PartyCandidateVotes%
Labour Ron Mihaly1,38445.6
Liberal Democrat Keith Falconer1,15237.9
Conservative Sara Kay Scotting50216.5
Turnout
Labour hold

Brimington

Brimington (1 seat)
PartyCandidateVotes%
Labour Stuart Brittain1,67158.6
Conservative Adam Fowler67923.8
Liberal Democrat Tony Rogers2669.3
Brimington IndependentsPaul Christopher Stone2388.3
Turnout
Labour hold

Loundsley Green and Newbold

Loundsley Green & Newbold (1 seat)
PartyCandidateVotes%
Labour Mick Wall1,65047.3
Liberal Democrat Tom Snowdon99028.4
Conservative John Robert Briers Scotting67319.3
Chesterfield IndependentsSharon Buxton1795.1
Turnout
Labour hold

Spire

Spire (1 seat)
PartyCandidateVotes%
Labour Sharon Lesley Blank1,26355.1
Conservative Nigel Robert Sterland50522.0
Liberal Democrat Maggie Cannon28712.5
Independent Adrian Mather23910.4
Turnout
Labour hold

St Mary's

St Mary's (1 seat)
PartyCandidateVotes%
Labour Co-op Jean Mary Innes1,43350.3
Conservative Malcolm Benjamin Rowley64622.7
Liberal Democrat Matthew James Genn40514.2
UKIP Kerrie Louise Webb2779.7
Green John Clifford Levis863.0
Turnout
Labour Co-op hold

Staveley

Staveley (1 seat)
PartyCandidateVotes%
Labour Helen Ann Elliott1,33152.3
Independent Mick Bagshaw53120.9
Conservative James Liam Hunt49419.4
Liberal Democrat Stephen James Hartley1877.4
Turnout
Labour hold

Staveley North and Whittington

Staveley North & Whittington (1 seat)
PartyCandidateVotes%
Liberal Democrat Barry Bingham1,32543.1
Labour Dean Collins1,24140.4
Conservative Oliver Scheidt50916.6
Turnout
Liberal Democrat gain from Labour

Walton and West

Walton & West (1 seat)
PartyCandidateVotes%
Conservative John David Lee Boult1,54139.4
Liberal Democrat Paul Adam Niblock1,40335.9
Labour Gordon Alexander McLaren96324.6
Turnout
Conservative gain from Liberal Democrat

Derbyshire Dales District

(6 seats, 6 electoral divisions)

Derbyshire Dales District Summary Result 2017
PartySeatsGainsLossesNet gain/lossSeats %Votes %Votes+/−
  Conservative 400Steady2.svg66.6651.612938
  Labour 101Decrease2.svg 116.6622.65671
  Liberal Democrat 110Increase2.svg 116.6617.44359
  UKIP 000Steady2.svg02.0502
  Green 000Steady2.svg01.4358
  Other parties 000Steady2.svg05.01250

Ashbourne

Ashbourne (1 seat)
PartyCandidateVotes%
Conservative Steve Bull2,77573.4
Liberal Democrat Rebecca Goodall75119.9
UKIP Richard Stone2546.7
Turnout 3780
Conservative hold

Bakewell

Bakewell (1 seat)
PartyCandidateVotes%
Conservative Judith Twigg2,65260.7
Labour Helen Swift1,10325.3
Liberal Democrat Eleanor Nancolas61314.0
Turnout 4368
Conservative hold

Derwent Valley

Derwent Valley (1 seat)
PartyCandidateVotes%
Conservative Jason Atkin2,29156.7
Labour Martin Rutter89722.2
Liberal Democrat Michael Crapper60615.0
UKIP Paul Roe2486.1
Turnout 4042
Conservative hold

Dovedale

Dovedale (1 seat)
PartyCandidateVotes%
Conservative Simon Spencer1,82547.0
Independent Colin Swindell1,25032.2
Labour Tom Barker43311.2
Liberal Democrat Martin Aiton2416.2
Green John Robin Youatt1323.4
Turnout 3881
Conservative hold

Matlock

Matlock (1 seat)
PartyCandidateVotes%
Liberal Democrat Sue Burfoot1,88942.3
Conservative Ann Elliott1,38330.9
Labour Andy Botham1,19826.8
Turnout 4470
Liberal Democrat gain from Labour

Wirksworth

Wirksworth (1 seat)
PartyCandidateVotes%
Labour Irene Ratcliffe2,04045.0
Conservative Richard Bright2,01244.3
Liberal Democrat Gill Bates2595.7
Green Ivan Dixon2265.0
Turnout 4537
Labour hold

Erewash Borough

(9 seats, 9 electoral divisions)

Erewash Borough Summary Result 2017
PartySeatsGainsLossesNet gain/lossSeats %Votes %Votes+/−
  Conservative 840+488.8951.615597
  Labour 104-411.1130.09097
  Liberal Democrat 000007.62295
  UKIP 000006.51956
  Green 000002.5756
  Other parties 000001.8547

Breadsall and West Hallam

Breadsall & West Hallam (1 seat)
PartyCandidateVotes%
Conservative Carol Ann Hart2,53467.5
Labour Michael Yates55514.8
Liberal Democrat Robert Mark Mee46412.4
UKIP Robert Vivian Wilson2005.3
Turnout 375340
Conservative hold

Breaston

Breaston (1 seat)
PartyCandidateVotes%
Conservative Robert Alan Parkinson2,38960.2
Labour Neil Barnes93723.6
UKIP Caroline Susan Gent2526.4
Liberal Democrat Martin Charles Garnett2446.1
Green Brent Poland1463.7
Turnout 396838.2
Conservative hold

Ilkeston East

Ilkeston East (1 seat)
PartyCandidateVotes%
Conservative Robert Frederick Flatley1,11641.8
Labour James Dawson1,03138.6
UKIP Frank Dunne36413.6
Liberal Democrat Angela Togni873.3
Green Ralph Timothy Hierons752.8
Turnout 267327.6
Conservative gain from Labour

Ilkeston South

Ilkeston South (1 seat)
PartyCandidateVotes%
Labour John Arnold Frudd1,18244.8
Conservative Jonathan William Wright1,06240.3
UKIP Terry Calladine2138.1
Liberal Democrat Stephen Andrew Hill993.8
Green Heather Hierons823.1
Turnout 263828.9
Labour hold

Ilkeston West

Ilkeston West (1 seat)
PartyCandidateVotes%
Conservative Tony King1,56048.3
Labour Michelle Wendy Booth1,27039.3
UKIP John Geehan2377.3
Liberal Democrat Alex Richards902.8
Independent John William David Thomson762.4
Turnout 323333.8
Conservative gain from Labour

Long Eaton

Long Eaton (1 seat)
PartyCandidateVotes%
Conservative Alan Griffiths1,46944.2
Labour Cheryl Pidgeon1,33440.1
UKIP Peter Thomas Levesley2096.3
Green Marie Crowley1394.2
Liberal Democrat Jane Elizabeth Oseman1364.1
Independent Roy Dunn381.1
Turnout 332534.1
Conservative gain from Labour

Petersham

Petersham (1 seat)
PartyCandidateVotes%
Conservative Garry Hickton1,37841.9
Labour Caroline Elizabeth Louise Brown1,22837.4
Liberal Democrat Becky Thomas34510.5
UKIP Simon Gent1885.7
Green Martin Gallimore1464.4
Turnout 328532.9
Conservative gain from Labour

Sandiacre

Sandiacre (1 seat)
PartyCandidateVotes%
Conservative Wayne Stephen Major2,06458.4
Labour Celia Jane Powers85224.1
Liberal Democrat Steve Maxwell38010.8
UKIP Gaynor Watts1414.0
Green Maggie Gallimore972.7
Turnout 353437.5
Conservative hold

Sawley

Sawley (1 seat)
PartyCandidateVotes%
Conservative Kewal Singh Athwal2,02552.7
Labour Alan Chewings70818.4
Liberal Democrat Adam David Wain45011.7
Independent Kristin Simmons2436.3
Independent Sylvia Corsham1904.9
UKIP Giles Farrand1524.0
Green David Shipman711.8
Turnout 383940
Conservative hold

High Peak Borough

(8 seats, 7 electoral divisions)

High Peak Borough Summary Result 2017
PartySeatsGainsLossesNet gain/lossSeats %Votes %Votes+/−
  Conservative 640Increase2.svg 47540.013675
  Labour 103Decrease2.svg 312.536.312418
  Liberal Democrat 101Decrease2.svg 112.517.65997
  Green 000Steady2.svg05.01715
  UKIP 000Steady2.svg01.1364

Buxton North and East

Buxton North & East (1 seat)
PartyCandidateVotes%
Conservative Linda Grooby1,32744.0
Labour Caitlin Bisknell1,30043.1
Liberal Democrat Alistair Forbes2708.9
Green Peter Crook1224.0
Turnout 302834.16
Conservative gain from Labour

Buxton West

Buxton West (1 seat)
PartyCandidateVotes%
Conservative Tony Kemp1,77147.5
Labour Matthew Stone1,29334.6
Liberal Democrat Adam Scott40610.9
Green Eileen Reynolds2627.0
Turnout 373240.09
Conservative hold

Chapel and Hope Valley

Chapel & Hope Valley (1 seat)
PartyCandidateVotes%
Conservative Jim Perkins1,79145.0
Liberal Democrat Charles Edward Lawley1,10027.6
Labour Robert Ashley King93223.4
Green Nat Stott1594.0
Turnout 398242.54
Conservative hold

Etherow

Etherow (1 seat)
PartyCandidateVotes%
Labour Becki Woods1,28653.9
Conservative Marcus Gerald Gill87536.7
Liberal Democrat Alastair Murray Booth1395.8
Green Sue Ledger843.5
Turnout 238428.84
Labour hold

Glossop and Charlesworth

Glossop & Charlesworth (2 seats)
PartyCandidateVotes%
Conservative George David Wharmby2,91122.4
Conservative Jean Wharmby2,83421.8
Labour Damien Greenhalgh2,82321.7
Labour Sheila Yamin2,41018.5
Liberal Democrat Stephen David Worrall5214.0
Green Peter Duncan Allen4553.5
Liberal Democrat Darcey Leigh Francis Gillie3802.9
UKIP Christopher Michael Boyle3642.8
Green Chris Cuff2992.3
Turnout 674638.55
Conservative gain from Labour

New Mills

New Mills (1 seat)
PartyCandidateVotes%
Liberal Democrat Beth Atkins1,88944.9
Labour Dave Gates1,31231.2
Conservative Samantha Flower83319.8
Green Mike Daw1774.2
Turnout 421142.60
Liberal Democrat hold

Whaley Bridge

Whaley Bridge (1 seat)
PartyCandidateVotes%
Conservative Alison Fox1,33334.7
Liberal Democrat David Lomax1,29233.6
Labour Ruth George 1,06227.6
Green Mary Louisa Jones1574.1
Turnout 384444.89
Conservative gain from Liberal Democrat

North East Derbyshire District

(8 seats, 7 electoral divisions)

North East Derbyshire District Summary Result 2017
PartySeatsGainsLossesNet gain/lossSeats %Votes %Votes+/−
  Labour 501Decrease2.svg 162.539.812630
  Conservative 310Increase2.svg 137.543.813907
  Liberal Democrat 000Steady2.svg09.22933
  UKIP 000Steady2.svg07.12246

Clay Cross North

Clay Cross North (1 seat)
PartyCandidateVotes%
Labour Brian Wright1,26339.6
Liberal Democrat David Hancock98030.8
Conservative William Armitage73223.0
UKIP Alan Garfitt2116.6
Turnout 3186
Labour hold

Clay Cross South

Clay Cross South (1 seat)
PartyCandidateVotes%
Labour Kevin Gillott1,89660.1
Conservative Linda Rowley89728.4
UKIP Graham Michael Hutchinson2367.5
Liberal Democrat Sam Gareth Jones1243.9
Turnout 3153
Labour hold

Dronfield East

Dronfield East (1 seat)
PartyCandidateVotes%
Conservative Alex Dale2,14156.6
Labour Co-op Janet Anne Hill1,29534.2
Liberal Democrat John Edward Ahern2055.4
UKIP Gina Clarke1433.8
Turnout 3784
Conservative gain from Labour Co-op

Dronfield West and Walton

Dronfield West & Walton (1 seat)
PartyCandidateVotes%
Conservative Angelique Foster2,86865.3
Labour Co-op Michael Gordon89320.3
Liberal Democrat Martin Wilcock3467.9
UKIP Adrian Lewis Clarke2846.5
Turnout 4391
Conservative hold

Eckington and Killamarsh

Eckington & Killamarsh (2 seats)
PartyCandidateVotes%
Labour Diane Winifred Evelyn Charles2,36022.9
Labour Brian Ridgway2,28622.2
Conservative Jeremy Alan Kenyon2,10920.4
Conservative Richard David George Welton1,88318.3
UKIP Cristian Gomez Reaney5034.9
Liberal Democrat James Anthony Blundell4274.1
Liberal Democrat Carmen Levick3883.8
UKIP Beverley Molloy3593.5
Turnout 5418
Labour hold
Labour hold

Sutton

Sutton (1 seat)
PartyCandidateVotes%
Labour Nigel Barker1,45453.8
Conservative Andrew Jervis82030.3
UKIP Robert Edward Molloy27710.2
Liberal Democrat Jaimie Paul Barson1545.7
Turnout 2705
Labour hold

Wingerworth and Shirland

Wingerworth & Shirland (1 seat)
PartyCandidateVotes%
Conservative Barry Lewis2,45758.8
Labour Barry Barnes1,18328.3
Liberal Democrat Wendy Smalley3097.4
UKIP Andrew John Briggs2335.6
Turnout 4182
Conservative hold

South Derbyshire District

(8 seats, 8 electoral divisions)

South Derbyshire District Summary Result 2017
PartySeatsGainsLossesNet gain/lossSeats %Votes %Votes+/−
  Conservative 750Increase2.svg 587.555.713361
  Labour 105Decrease2.svg 512.531.47528
  UKIP 000Steady2.svg06.31507
  Liberal Democrat 000Steady2.svg06.31500
  Green 000Steady2.svg00.485

Aston

Aston (1 seat)
PartyCandidateVotes%
Conservative Neil Kenneth Atkin1,73849.7
Labour Rob Davison1,35938.8
UKIP Ann Mary Graves1604.6
Liberal Democrat John Hills1574.5
Green Marten Kats852.4
Turnout 3499
Conservative gain from Labour

Etwall and Repton

Etwall & Repton (1 seat)
PartyCandidateVotes%
Conservative Martyn Ford2,63268.1
Labour John Campbell McCallum67717.5
Liberal Democrat Annabelle Long39910.3
UKIP Louise Jane Howells1594.1
Turnout 3867
Conservative hold

Hilton

Hilton (1 seat)
PartyCandidateVotes%
Conservative Julie Elizabeth Patten1,84763.6
Labour Steve Cooper69223.8
Liberal Democrat Claire Marie Jaqueline Portejoie1886.5
UKIP Ben Stokes1766.1
Turnout 2903
Conservative hold

Linton

Linton (1 seat)
PartyCandidateVotes%
Conservative Patrick Joseph Murray1,75159.1
Labour Toni Ann Rogers91430.9
UKIP Barry Appleby1525.1
Liberal Democrat Lorraine Karen Johnson1444.9
Turnout 2961
Conservative gain from Labour

Melbourne

Melbourne (1 seat)
PartyCandidateVotes%
Conservative Linda Mary Chilton2,31765.9
Labour Neil Anthony Tilley70320.0
Liberal Democrat John James3199.1
UKIP Martin Batteson1785.1
Turnout 3517
Conservative hold

Swadlincote Central

Swadlincote Central (1 seat)
PartyCandidateVotes%
Conservative Gary Stephen Musson1,09243.6
Labour Paul Dunn98139.2
UKIP Mike Dawson29811.9
Liberal Democrat Rebecca Jane Wilkinson1325.3
Turnout 2503
Conservative gain from Labour

Swadlincote North

Swadlincote North (1 seat)
PartyCandidateVotes%
Labour Sean Andrew Bambrick1,17450.7
Conservative Ann Watson88638.2
UKIP Martin Fitzpatrick1868.0
Liberal Democrat Richard Francis Tyler682.9
Turnout 2314
Labour hold

Swadlincote South

Swadlincote South (1 seat)
PartyCandidateVotes%
Conservative Stuart Thomas Swann1,09845.4
Labour Trevor Southerd1,02842.5
UKIP Alice Emily Stott1988.2
Liberal Democrat Tim Collingwood933.8
Turnout 2417
Conservative gain from Labour

Related Research Articles

2009 Cornwall Council election

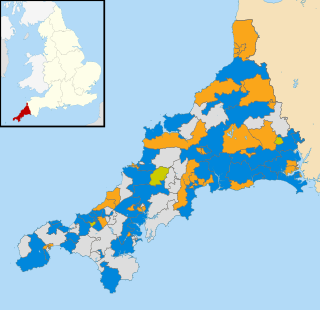
The Cornwall Council election, 2009, was an election for all 123 seats on the council. Cornwall Council is a unitary authority that covers the majority of the ceremonial county of Cornwall, with the exception of the Isles of Scilly which have an independent local authority. The elections took place concurrently with other local elections across England and Wales as well as the UK component of the elections to the European Parliament. Cornwall had seen its district and county councils abolished, replaced by a single 123-member Cornish unitary authority, for which councillors were elected for a full term.

2009 Hampshire County Council election

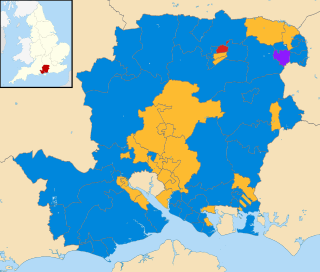
An election to Hampshire County Council took place on 4 June 2009 as part of the United Kingdom local elections, 2009, having been delayed from 7 May, to coincide with elections to the European Parliament. 78 councillors were elected from 75 electoral divisions, which returned either one or two county councillors each by first-past-the-post voting for a four-year term of office. The electoral divisions were the same as those used at the previous election in 2005. Elections in Portsmouth and Southampton do not coincide with this set, being unitary authorities outside the area covered by the County Council.

2009 Oxfordshire County Council election

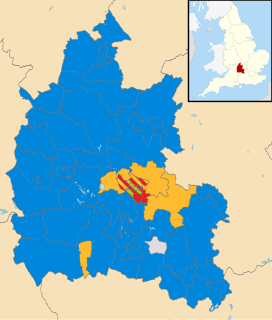
An election to Oxfordshire County Council took place on 4 June 2009 as part of the United Kingdom local elections, 2009, having been delayed from 7 May, to coincide with elections to the European Parliament. 73 councillors were elected from various electoral divisions, which returned either one, two or three county councillors each by first-past-the-post voting for a four-year term of office. The electoral divisions were the same as those used at the previous election in 2005.

2009 Somerset County Council election

An election to Somerset County Council took place on 4 June 2009 as part of the United Kingdom local elections, 2009, having been delayed from 7 May, to coincide with elections to the European Parliament. The result brought to an end 16 years of Liberal Democrat rule to a Conservative controlled administration. 58 councillors were elected from various electoral divisions, which returned one county councillor each. Members were elected by the first-past-the-post voting system for a four-year term of office. This was the last election before the number of seats was cut to 55 for the 2013 election. With a total of 58 seats being reduced to 55 for the next election.

2013 Lancashire County Council election

An election to Lancashire County Council took place on 2 May 2013 as part of the United Kingdom local elections, 2013. 84 councillors were elected from single-member electoral divisions by first-past-the-post for a four-year term of office. Electoral divisions were the same as those at the previous election in 2009. Elections were held in all electoral divisions across the present ceremonial county, excepting Blackpool and Blackburn with Darwen which are unitary authorities in a similar way to Greater Manchester and most of Merseyside. The election saw the Conservative Party lose overall control of the council, instead overtaken in number of seats by the Labour Party, without any absolute majority.

2013 Derbyshire County Council election

An election to Derbyshire County Council took place on 2 May 2013 as part of the United Kingdom local elections, 2013. Following the final draft of the 2012 electoral review, 64 councillors were elected from 61 electoral divisions which returned either one or two county councillors each by first-past-the-post voting for a four-year term of office. No elections were held in the City of Derby, which is a unitary authority outside the area covered by the County Council. The Labour Party won back control of the council by a landslide victory, taking forty-two of the authority's sixty-four seats.

2013 Leicestershire County Council election

An election to Leicestershire County Council took place on 2 May 2013 as part of the United Kingdom local elections, 2013. 55 councillors were elected from 52 electoral divisions, which returned either one or two county councillors each by first-past-the-post voting for a four-year term of office. The Conservatives held control of the council with a reduced majority of 5 seats. Despite a strong challenge from UKIP, the party only gained 2 seats whilst the Liberal Democrats lost one seat and Labour recouped some of their 2009 losses, gaining 6 seats.

2013 East Sussex County Council election

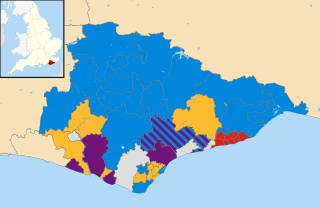
The East Sussex County Council election, 2013 took place on 2 May 2013 as part of the United Kingdom local elections, 2013. All 49 councillors of East Sussex County Council were elected from 44 electoral divisions, which return either one or two councillors each by first-past-the-post voting for a four-year term of office. The electoral divisions were the same as those used at the previous election in 2009. No elections were held in Brighton and Hove, which is a unitary authority outside the area covered by the County Council.

2013 Hampshire County Council election

An election to Hampshire County Council took place on 2 May 2013 as part of the United Kingdom local elections, 2013. 78 councillors were elected from 75 electoral divisions, which returned either one or two county councillors each by first-past-the-post voting for a four-year term of office. The electoral divisions were the same as those of the previous election in 2009. No elections were held in Portsmouth and Southampton, which are unitary authorities outside the area covered by the County Council. The election saw the Conservative Party retain overall control of the council, with a reduced majority of five councillors.

2013 Worcestershire County Council election

An election to Worcestershire County Council took place on 2 May 2013 as part of the United Kingdom local elections, 2013. 57 councillors were elected from 53 electoral divisions, which returned either one or two county councillors each by first-past-the-post voting for a four-year term of office. The divisions were the same as those used at the previous election in 2009. The election saw the Conservative Party retain overall control of the council with a significantly reduced majority of just 2 seats.

2013 Lincolnshire County Council election

An election to Lincolnshire County Council took place on 2 May 2013 as part of the United Kingdom local elections, 2013. 77 electoral divisions returned one county councillor each by first-past-the-post voting for a four-year term of office. The electoral divisions were the same as those used at the previous election in 2009. No elections were held in North Lincolnshire or North East Lincolnshire, which are unitary authorities outside the area covered by the County Council.

2013 Surrey County Council election

The Surrey County Council election, 2013 took place on 2 May 2013 as part of the United Kingdom local elections, 2013. 81 electoral divisions returned one county councillor each by first-past-the-post voting for a four-year term of office. Following a review, new electoral division boundaries were introduced for this election, increasing the number of councillors from 80 to 81.

2013 Gloucestershire County Council election

Elections to Gloucestershire County Council took place on 2 May 2013 as part of the United Kingdom local elections, 2013. 53 electoral divisions elected one county councillor each by first-past-the-post voting for a four-year term of office. No elections were held in South Gloucestershire, which is a unitary authority outside the area covered by the County Council.

2013 Essex County Council election

An election to Essex County Council took place on 2 May 2013 as part of the United Kingdom local elections, 2013. 75 councillors were elected from 70 electoral divisions, which returned either one or two county councillors each by first-past-the-post voting for a four-year term of office. The electoral divisions were the same as those used at the previous election in 2009. No elections were held in Thurrock or Southend-on-Sea, which are unitary authorities outside the area covered by the County Council.

2013 Staffordshire County Council election

An election to Staffordshire County Council took place on 2 May 2013 as part of the United Kingdom local elections, 2013. 62 electoral divisions returned one county councillor each by first-past-the-post voting for a four-year term of office. Following a boundary review, new electoral division boundaries were established for this election. No elections were held in Stoke-on-Trent, which is a unitary authority outside the area covered by the County Council. The council continues to be administered on the Leader and Cabinet model.

2013 Dorset County Council election

An election to Dorset County Council took place on 2 May 2013 as part of the United Kingdom local elections. 45 councillors were elected from 42 electoral divisions, which returned either one or two county councillors each by first-past-the-post voting for a four-year term of office. The electoral divisions were the same as those used at the previous election in 2009. No elections were held in Bournemouth or Poole, which are unitary authorities outside the area covered by the County Council. The election saw the Conservative Party maintain overall control of the council.

2013 Suffolk County Council election

Elections to Suffolk County Council took place on 2 May 2013 as part of the United Kingdom local elections, 2013. 75 councillors were elected from 63 electoral divisions, which returned either one or two county councillors each by first-past-the-post voting for a four-year term of office. The electoral divisions were the same as those used at the previous election in 2009.

2017 Gloucestershire County Council election

The 2017 Gloucestershire County Council election took place on 4 May 2017 as part of the 2017 local elections in the United Kingdom. All 53 councillors were elected from electoral divisions which returned one county councillor each by first-past-the-post voting for a four-year term of office. Control of the council went from a Conservative Party minority to a majority administration.

2017 Lincolnshire County Council election

The 2017 Lincolnshire County Council election took place in non-metropolitan Lincolnshire on 4 May 2017 as part of the 2017 local elections in the United Kingdom. A total of 70 councillors were elected from each of the seven district councils that make up non-metropolitan Lincolnshire from 70 one member electoral divisions by first-past-the-post voting for a four-year term of office. The election did not include North Lincolnshire and North East Lincolnshire as they are separate unitary authorities.

2017 Cornwall Council election

The 2017 Cornwall Council election was held on 4 May 2017 as part of the 2017 local elections in the United Kingdom. 122 councillors were elected from the 121 electoral divisions of Cornwall Council, which returned either one or two councillors each by first-past-the-post voting for a four-year term of office. Although originally scheduled to take place on the same day, the election in the Bodmin St Petroc ward was countermanded following the death of Liberal Democrat candidate Steve Rogerson and was held on 8 June.

References

  1. "Derbyshire - LGBCE". www.lgbce.org.uk.
  2. "The Representation of the People (Form of Canvass) (England and Wales) Regulations 2006, Schedule Part 1". Legislation.gov.uk. 13 October 2011. Retrieved 18 April 2012.
  3. "I have two homes. Can I register at both addresses?". The Electoral Commission. Retrieved 5 January 2011.
  4. "Derbyshire County Council election results 2017". Derbyshire County Council. 2017-05-05. Retrieved 2017-05-08.