Amber Valley Borough Council election, 2003

Last updated

Map of the results of the 2003 Amber Valley council election. Conservatives in blue and Labour in red. Wards in grey were not contested in 2003. Amber Valley UK local election 2003 map.svg
Map of the results of the 2003 Amber Valley council election. Conservatives in blue and Labour in red. Wards in grey were not contested in 2003.

Elections to Amber Valley Borough Council were held on 1 May 2003. One third of the council was up for election and the Conservative party held overall control of the council.

Amber Valley Borough in England

Amber Valley is a local government district and borough in Derbyshire, England. It takes its name from the River Amber and covers a semi-rural area with a number of small towns whose economy was formerly based on coal mining and engineering. The parliamentary constituency of Amber Valley covers a similar area. The Local Authority population at the 2011 Census was 122,309.

Conservative Party (UK) Political party in the United Kingdom

The Conservative Party, officially the Conservative and Unionist Party, is a centre-right political party in the United Kingdom. Presently led by Theresa May, it has been the governing party since 2010. It presently has 314 Members of Parliament in the House of Commons, 249 members of the House of Lords, and 18 members of the European Parliament. It also has 31 Members of the Scottish Parliament, 12 members of the Welsh Assembly, eight members of the London Assembly and 9,008 local councillors. One of the major parties of UK politics, it has formed the government on 45 occasions, more than any other party.

Contents

After the election, the composition of the council was

Election result

Amber Valley Local Election Result 2003
PartySeatsGainsLossesNet gain/lossSeats %Votes %Votes+/−
  Conservative 12 -1 80.0 53.2 9,734 +16.1%
  Labour 3 +1 20.0 37.0 6,770 -15.5%
  Liberal 0 0 0 7.6 1,386 +2.0%
  Independent 0 0 0 2.2 411 -2.2%

Ward results

Alfreton
PartyCandidateVotes%±
Labour Gillian Dolman 716 54.1
Conservative David Wilson 450 34.0
Liberal Paul Gibbons 158 11.9
Majority 266 20.1
Turnout 1,324
Alport
PartyCandidateVotes%±
Conservative Deborah Biss 629 70.4
Labour Tony Munro 142 15.9
Liberal Peter Handscombe 123 13.8
Majority 487 54.5
Turnout 894
Belper Central
PartyCandidateVotes%±
Conservative Peter Makin 711 59.0
Labour Brenda Remington 494 41.0
Majority 217 18.0
Turnout 1,205
Belper East
PartyCandidateVotes%±
Conservative Leslie Dorey 553 49.1 +2.5
Labour Alan Broughton 411 36.5 -7.1
Liberal Timothy Clark 162 14.4 +14.4
Majority 142 12.6 +9.6
Turnout 1,126
Belper North
PartyCandidateVotes%±
Conservative Simon Hitchcock 660 52.2
Labour Peter Shepherd 364 28.8
Liberal Roger Shelley 147 11.6
Independent Margaret Jackson 94 7.4
Majority 296 23.4
Turnout 1,265
Belper South
PartyCandidateVotes%±
Conservative Peter Arnold 614 56.3 +6.3
Labour Ronald Buzzard 476 43.7 -6.3
Majority 138 12.6 +12.5
Turnout 1,090
Crich
PartyCandidateVotes%±
Conservative Glyn Hartshorne 450 62.8
Labour Kenneth Armstrong 134 18.7
Liberal Catherine Smith 132 18.4
Majority 316 44.1
Turnout 716
Duffield
PartyCandidateVotes%±
Conservative Anthony Woodings 851 57.3 -2.8
Labour Patrick Mountain 318 21.4 -18.5
Liberal Deena Smith 316 21.3 +21.3
Majority 433 35.9 +15.7
Turnout 1,485
Heage and Ambergate
PartyCandidateVotes%±
Labour Maurice Gent 739 51.3
Conservative Juliette Blake 559 38.8
Liberal Anthony Cooper 142 9.9
Majority 180 12.5
Turnout 1,440
Kilburn, Denby and Holbrook
PartyCandidateVotes%±
Conservative Albert Hall 845 47.2 +5.6
Labour Susan Reaney 741 41.4 -2.9
Liberal Jeremy Benson 206 11.5 -2.6
Majority 104 5.8 +3.1
Turnout 1,792
Ripley
PartyCandidateVotes%±
Conservative Kathleen Brown 890 50.2
Labour Walter Fryer 882 49.8
Majority 8 0.4
Turnout 1,772
Ripley and Marehay
PartyCandidateVotes%±
Labour Geoffrey Carlile 627 53.1
Conservative Patricia Bowmar 404 34.2
Independent Alex Stevenson 150 12.7
Majority 223 18.9
Turnout 1,181
South West Parishes
PartyCandidateVotes%±
Conservative John Cunningham 750 85.4
Labour Diana Hancock 128 14.6
Majority 622 70.8
Turnout 878
Swanwick
PartyCandidateVotes%±
Conservative Stephen Hayes 733 55.9 -6.2
Labour Paul Smith 411 31.4 -6.5
Independent John Pidcock 167 12.7 +12.7
Majority 322 24.5
Turnout 1,311
Wingfield
PartyCandidateVotes%±
Conservative Valerie Thorpe 635 77.3
Labour Graham Naylor 187 22.7
Majority 448 54.6
Turnout 822

BBC report of 2003 Amber Valley election result

Related Research Articles

Amber Valley (UK Parliament constituency) Parliamentary constituency in the United Kingdom

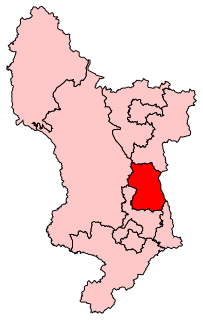
Amber Valley is a constituency, represented in the House of Commons of the UK Parliament since 2010 by Nigel Mills of the Conservative Party.

Hastings and Rye (UK Parliament constituency) Parliamentary constituency in the United Kingdom

Hastings and Rye is a constituency represented in the House of Commons of the UK Parliament since 2010 by Amber Rudd, a Conservative. Rudd has served as Work and Pensions Secretary in Theresa May's Cabinet since 2018, and served as Home Secretary from 2016 to 2018.

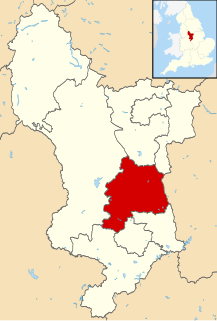
One third of Amber Valley Borough Council in Derbyshire, England is elected each year, followed by one year without election. Since the last boundary changes in 2000, 45 councillors have been elected from 23 wards.

The 1998 Amber Valley Borough Council election took place on 7 May 1998 to elect members of Amber Valley Borough Council in Derbyshire, England. One third of the council was up for election and the Labour party kept overall control of the council.

The 1999 Amber Valley Borough Council election took place on 6 May 1999 to elect members of Amber Valley Borough Council in Derbyshire, England. One third of the council was up for election and the Labour party stayed in overall control of the council.

2000 Amber Valley Borough Council election

The 2000 Amber Valley Borough Council election took place on 4 May 2000 to elect members of Amber Valley Borough Council in Derbyshire, England. The whole council was up for election with boundary changes since the last election in 1999 increasing the number of seats by 2. The Conservative party gained control of the council from the Labour party.

2002 Amber Valley Borough Council election

Elections to Amber Valley Borough Council were held on 2 May 2002. One third of the council was up for election and the Conservative party held overall control of the council.

2004 Amber Valley Borough Council election

Elections to Amber Valley Borough Council were held on 10 June 2004. One third of the council was up for election and the Conservative party held overall control of the council. Overall turnout was 44%.

2006 Amber Valley Borough Council election

Elections to Amber Valley Borough Council were held on 4 May 2006. One third of the council was up for election and the Conservative party held overall control of the council. Overall turnout was 34%.

2007 Amber Valley Borough Council election

Elections to Amber Valley Borough Council were held on 3 May 2007. One third of the council was up for election and the Conservative party held overall control of the council. Overall turnout was 37.7%.

2008 Amber Valley Borough Council election

Elections to Amber Valley Borough Council in Derbyshire, England were held on 1 May 2008. One third of the council was up for election and the Conservative party held overall control of the council.

1980 United Kingdom local elections

Local elections were held in the United Kingdom in 1980. These were the first annual local elections for the new Conservative Prime Minister Margaret Thatcher. Though the Conservatives in government lost seats, the projected share of the vote was close: Labour Party 42%, Conservative Party 40%, Liberal Party 13%. Labour were still being led by the former prime minister James Callaghan, who resigned later in the year to be succeeded by Michael Foot.

2010 Amber Valley Borough Council election

The 2010 Amber Valley Borough Council election took place on 6 May 2010 to elect members of Amber Valley Borough Council in Derbyshire, England. One third of the council was up for election and the Conservative party stayed in overall control of the council.

2011 Amber Valley Borough Council election

The 2011 Amber Valley Borough Council election took place on 5 May 2011 to elect members of Amber Valley Borough Council in Derbyshire, England. One third of the council was up for election and the Conservative party stayed in overall control of the council.

2012 Amber Valley Borough Council election

Elections to Amber Valley Borough Council in Derbyshire, England took place on Thursday 3 May 2012. One third of the council was up for election and the Conservative party held overall control of the council. Overall turnout in this election was 33.28 per cent.

2014 Amber Valley Borough Council election

The 2014 Amber Valley Borough Council election took place on 22 May 2014 to elect members of Amber Valley Borough Council in England. This was on the same day as other local elections.

2015 Amber Valley Borough Council election

The 2015 Amber Valley Borough Council election took place on 7 May 2015 to elect members of Amber Valley Borough Council in England. This was on the same day as other local elections. The Conservatives gained two seats and thereby retook control of the council.

2016 Amber Valley Borough Council election

Elections to Amber Valley Borough Council in Derbyshire, England took place on Thursday 5 May 2016. One third of the council seats were up for election and after the election the Conservative party continued to hold overall control of the council.

2018 Amber Valley Borough Council election

Elections to Amber Valley Borough Council in Derbyshire, England took place on Thursday 3 May 2018. One third of the council seats were up for election.