| |||||||||||||||||||||||||||||||||||||
1/3 of 51 seats to Derby City Council 26 seats needed for a majority | |||||||||||||||||||||||||||||||||||||
---|---|---|---|---|---|---|---|---|---|---|---|---|---|---|---|---|---|---|---|---|---|---|---|---|---|---|---|---|---|---|---|---|---|---|---|---|---|
| |||||||||||||||||||||||||||||||||||||
|
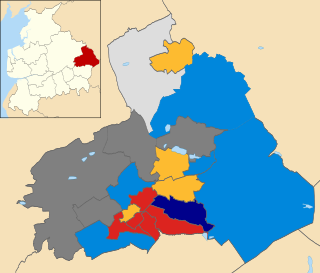
The 2008 Derby City Council election took place on 1 May 2008 to elect members of Derby City Council in England. One third of the council was up for election and the council stayed under no overall control. [1] Overall turnout was 34.6%. [2] [3]
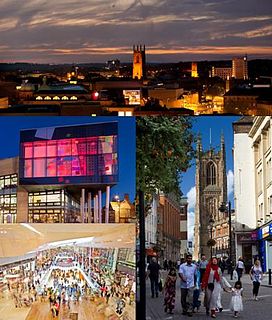
Derby is a city and unitary authority area in Derbyshire, England. It lies on the banks of the River Derwent in the south of Derbyshire, of which it was traditionally the county town. At the 2011 census, the population was 248,700. Derby gained city status in 1977.
Derby City Council is the local government unitary authority for Derby, a city in the East Midlands region of England. It is composed of 51 councillors, three for each of the 17 electoral wards of Derby. Currently there is no overall control of the council, with the Labour Party being the biggest party. The acting council chief executive is Christine Durrant. Carole Mills will take over as Chief Executive from August 2018.
England is a country that is part of the United Kingdom. It shares land borders with Wales to the west and Scotland to the north-northwest. The Irish Sea lies west of England and the Celtic Sea lies to the southwest. England is separated from continental Europe by the North Sea to the east and the English Channel to the south. The country covers five-eighths of the island of Great Britain, which lies in the North Atlantic, and includes over 100 smaller islands, such as the Isles of Scilly and the Isle of Wight.
After the election, the composition of the council was
The Liberal Democrats are a liberal political party in the United Kingdom. They presently have 11 Members of Parliament in the House of Commons, 96 members of the House of Lords, and one member of the European Parliament. They also have five Members of the Scottish Parliament and a member each in the Welsh Assembly and London Assembly. The party reached the height of its influence in the early 2010s, forming a junior partner in a coalition government from 2010 to 2015. It is presently led by Vince Cable.
The Labour Party is a centre-left political party in the United Kingdom which has been described as an alliance of social democrats, democratic socialists and trade unionists. The party's platform emphasises greater state intervention, social justice and strengthening workers' rights.
The Conservative Party, officially the Conservative and Unionist Party, is a centre-right political party in the United Kingdom. Presently led by Theresa May, it has been the governing party since 2010. It presently has 314 Members of Parliament in the House of Commons, 249 members of the House of Lords, and 18 members of the European Parliament. It also has 31 Members of the Scottish Parliament, 12 members of the Welsh Assembly, eight members of the London Assembly and 9,008 local councillors. One of the major parties of UK politics, it has formed the government on 45 occasions, more than any other party.
Since the 2006 election the Labour party had been running the council in an agreement with the Conservatives and both parties did not rule out continuing this arrangement after the election. [5] However, a major issue in the election was a proposal by the Labour party to close 10 play areas across Derby in order to save money, which were opposed by the Conservatives. [5] The arrangement was also strained by the defection of 2 Labour councillors, Hardial Dhamrait and Amar Nath, to the Conservatives since the 2007 election. [6] Other changes since 2007 included Labour councillor Prem Chera becoming an independent, and independent Frank Leeming joining the Conservatives. [6] This meant that before the election there were 21 Labour, 14 Conservative, 13 Liberal Democrat and 2 independent councillors. [6]
A Councillor is a member of a local government council.
In all 61 candidates stood in the election, with 17 seats being contested. [7] Of those 17 seats Labour were defending 8, the Conservatives 6 and the Liberal Democrats 3. [6]
The leader of the Conservative party, David Cameron, visited Derby to support the local party on 3 April and described it as a "key battleground". [5]
David William Donald Cameron is a British politician who served as Prime Minister of the United Kingdom from 2010 to 2016. He was the Member of Parliament (MP) for Witney from 2001 to 2016 and Leader of the Conservative Party from 2005 to 2016. He identifies as a one-nation conservative, and has been associated with both economically liberal and socially liberal policies.
The Liberal Democrats gained 5 seats to move from third largest group on the council to become the largest party, overtaking the Labour and Conservative parties. [3] [8] Liberal Democrat gains were recorded in Abbey, Arboretum and Mackworth wards from Labour, and in Blagreaves and Oakwood wards from the Conservatives. [9] [10] Meanwhile, Labour recovered a seat in Sinfin which they had lost when Hardial Dhamrait had defected to the Conservatives. [9] However, Labour also two seats in Chaddesden and Chellaston to the Conservatives. [10]
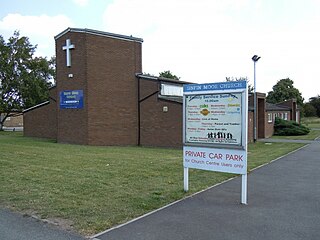
Sinfin is a suburb and ward of the city of Derby, in Derbyshire, England. It is situated approximately 3 miles (4.8 km) south-southwest of the city centre on Derby's southern outskirts. The ward, which includes Osmaston as well as Sinfin itself, had a population of 15,128 in 2011. Historically, Sinfin and Osmaston were separate villages before being swallowed up by the expansion of Derby. Osmaston is characterised by inter-war housing developments while much of the housing in Sinfin is postwar. Between the two suburbs lies a more industrialised area dominated by the Rolls-Royce works.
Chaddesden, also known locally as Chad, is a large residential suburb of Derby, United Kingdom. Historically a separate village centred on Chaddesden Hall and the 14th century St. Mary's Church, the area was significantly expanded by 20th century housing developments, and was incorporated into Derby in 1968.
Chellaston is a suburb in the south of the City of Derby, which is in the East Midlands of England. It is on a natural hill, and has recently expanded due to several new housing estates.
Following the elections the three parties held discussions to decide who would run the council for the next two years. [11] On 6 May the Conservatives decided that they would not agree any deal with the other two parties and would sit in opposition, with Conservative councillors feeling that the previous agreement with Labour had meant they did not make gains as the party had done nationally. [11] The Liberal Democrats and Labour then planned to hold talks, with Labour abandoning their previous proposals to introduce congestion charging in Derby, and parking meters in Littleover. [12] However, the Liberal Democrats decided they would prefer to run the council as a minority rather than reach an agreement with Labour. At the council meeting on 21 May the Liberal Democrat leader, Hilary Jones, was elected leader of the council by 19 votes to 17 after the Conservatives abstained. [13]
Party | Seats | Gains | Losses | Net gain/loss | Seats % | Votes % | Votes | +/− | |
---|---|---|---|---|---|---|---|---|---|
Liberal Democrat | 8 | 5 | 0 | +5 | 47.1 | 32.3 | 19,374 | +3.5% | |
Conservative | 5 | 2 | 3 | -1 | 29.4 | 35.2 | 21,139 | +3.2% | |
Labour | 4 | 1 | 5 | -4 | 23.5 | 28.1 | 16,869 | -6.1% | |
BNP | 0 | 0 | 0 | 0 | 0 | 2.0 | 1,217 | +2.0% | |
Independent | 0 | 0 | 0 | 0 | 0 | 1.9 | 1,152 | -1.8% | |
Green | 0 | 0 | 0 | 0 | 0 | 0.5 | 319 | -0.8% |
Party | Candidate | Votes | % | ± | |
---|---|---|---|---|---|
Liberal Democrat | David Batey | 1,443 | 47.9 | +3.8 | |
Labour | Asaf Afzal | 1,056 | 35.1 | -3.9 | |
Conservative | Jasvinder Rai | 335 | 11.1 | -0.6 | |
Independent | Norman Clayton | 166 | 5.5 | +0.2 | |
Independent | Masadiq Hussain | 8 | 0.3 | +0.3 | |
Independent | Raja Mehmood | 3 | 0.1 | +0.1 | |
Majority | 387 | 12.8 | +7.7 | ||
Turnout | 3,011 | 31.1 | +1.7 | ||
Liberal Democrat gain from Labour | Swing | ||||
Party | Candidate | Votes | % | ± | |
---|---|---|---|---|---|
Conservative | Philip Hickson | 3,234 | 62.6 | -2.0 | |
Labour | John Whitby | 739 | 14.3 | -4.8 | |
Liberal Democrat | Deena Smith | 633 | 12.2 | -4.1 | |
BNP | Glynn Cooper | 563 | 10.9 | +10.9 | |
Majority | 2,495 | 48.3 | +2.8 | ||
Turnout | 5,169 | 47.4 | +2.0 | ||
Conservative hold | Swing |
Party | Candidate | Votes | % | ± | |
---|---|---|---|---|---|
Labour | Alan Graves | 1,228 | 38.3 | -7.1 | |
Liberal Democrat | Naveed Hussain | 913 | 28.5 | -6.3 | |
Conservative | Brenda Longworth | 843 | 26.3 | +6.5 | |
Independent | Gillian Elks | 221 | 6.9 | +6.9 | |
Majority | 315 | 9.8 | -0.8 | ||
Turnout | 3,205 | 29.3 | -1.0 | ||
Labour hold | Swing |
Party | Candidate | Votes | % | ± | |
---|---|---|---|---|---|
Liberal Democrat | Farhatullah Khan | 1,710 | 46.1 | +9.0 | |
Labour | Shiraz Khan | 1,624 | 43.8 | -5.3 | |
Conservative | David Jennings | 374 | 10.1 | +3.3 | |
Majority | 86 | 2.3 | |||
Turnout | 3,708 | 35.4 | -2.0 | ||
Liberal Democrat gain from Labour | Swing | ||||
Party | Candidate | Votes | % | ± | |
---|---|---|---|---|---|
Liberal Democrat | Harjinder Naitta | 2,006 | 50.6 | +5.3 | |
Conservative | Lisa Marshall | 1,047 | 26.4 | +7.4 | |
Labour | John Heavey | 909 | 22.9 | -8.1 | |
Majority | 959 | 24.2 | +9.9 | ||
Turnout | 3,962 | 41.6 | -1.5 | ||
Liberal Democrat gain from Conservative | Swing | ||||
Party | Candidate | Votes | % | ± | |
---|---|---|---|---|---|
Conservative | Graham Leeming | 1,607 | 51.5 | +30.8 | |
Labour | Joseph Russo | 1,129 | 36.2 | -3.8 | |
Liberal Democrat | Stephen Connolly | 386 | 12.4 | +0.6 | |
Majority | 478 | 15.3 | |||
Turnout | 3,122 | 31.0 | -0.4 | ||
Conservative hold | Swing |
Party | Candidate | Votes | % | ± | |
---|---|---|---|---|---|
Conservative | Sean Marshall | 1,441 | 39.6 | -6.5 | |
Labour | John Ahern | 1,161 | 31.9 | -10.7 | |
BNP | Paul Hilliard | 654 | 18.0 | +18.0 | |
Liberal Democrat | Eric Ashburner | 285 | 7.8 | -3.5 | |
Independent | Charles McLynn | 96 | 2.6 | +2.6 | |
Majority | 280 | 7.7 | +4.2 | ||
Turnout | 3,637 | 36.3 | +2.1 | ||
Conservative gain from Labour | Swing | ||||
Party | Candidate | Votes | % | ± | |
---|---|---|---|---|---|
Conservative | Matthew Holmes | 1,921 | 49.0 | +3.1 | |
Labour | Mark Tittley | 1,830 | 46.7 | +4.0 | |
Liberal Democrat | Ajit Atwal | 166 | 4.2 | -2.1 | |
Majority | 91 | 2.3 | -0.9 | ||
Turnout | 3,917 | 35.9 | -1.3 | ||
Conservative gain from Labour | Swing | ||||
Party | Candidate | Votes | % | ± | |
---|---|---|---|---|---|
Liberal Democrat | Finbar Richards | 1,331 | 36.7 | +4.9 | |
Conservative | Lorraine Radford | 1,069 | 29.5 | +3.2 | |
Labour | Christopher Wynn | 905 | 25.0 | -7.7 | |
Green | Jane Temple | 319 | 8.8 | -0.4 | |
Majority | 262 | 7.2 | |||
Turnout | 3,624 | 33.9 | -6.1 | ||
Liberal Democrat hold | Swing |
Party | Candidate | Votes | % | ± | |
---|---|---|---|---|---|
Labour | Margaret Redfern | 919 | 39.9 | -10.6 | |
Conservative | Patrick Fullerton | 708 | 30.7 | +4.9 | |
Liberal Democrat | Leigh Alcock | 353 | 15.3 | +4.4 | |
Independent | William Wright | 325 | 14.1 | +1.2 | |
Majority | 211 | 9.2 | -15.5 | ||
Turnout | 2,305 | 23.6 | +0.2 | ||
Labour hold | Swing |
Party | Candidate | Votes | % | ± | |
---|---|---|---|---|---|
Liberal Democrat | Leslie Allen | 2,429 | 60.8 | +5.6 | |
Conservative | Tarlochan Dard | 1,132 | 28.3 | -2.9 | |
Labour | Linda Winter | 435 | 10.9 | -2.7 | |
Majority | 1,297 | 32.5 | +8.5 | ||
Turnout | 3,996 | 39.7 | -2.6 | ||
Liberal Democrat hold | Swing |
Party | Candidate | Votes | % | ± | |
---|---|---|---|---|---|
Liberal Democrat | Derrick Tuplin | 1,553 | 52.9 | +27.1 | |
Labour | Richard Gerrard | 778 | 26.5 | -22.2 | |
Conservative | Andrew Hill | 603 | 20.6 | -4.9 | |
Majority | 775 | 26.4 | |||
Turnout | 2,934 | 30.1 | +1.0 | ||
Liberal Democrat gain from Labour | Swing | ||||
Party | Candidate | Votes | % | ± | |
---|---|---|---|---|---|
Liberal Democrat | Hilary Jones | 2,411 | 53.0 | -2.5 | |
Conservative | Philip Lucas | 1,738 | 38.2 | +2.0 | |
Labour | Josephine Drummond | 402 | 8.8 | +0.4 | |
Majority | 673 | 14.8 | -4.5 | ||
Turnout | 4,551 | 41.6 | -3.4 | ||
Liberal Democrat hold | Swing |
Party | Candidate | Votes | % | ± | |
---|---|---|---|---|---|
Labour | Hardyal Dhindsa | 1,399 | 40.6 | -8.1 | |
Liberal Democrat | Shayad Mahmood | 1,276 | 37.0 | -5.0 | |
Conservative | Jarnail Birring | 775 | 22.5 | +13.2 | |
Majority | 123 | 3.6 | -3.1 | ||
Turnout | 3,450 | 33.5 | -0.7 | ||
Labour hold | Swing |
Party | Candidate | Votes | % | ± | |
---|---|---|---|---|---|
Liberal Democrat | Franklyn Harwood | 1,733 | 51.9 | +44.0 | |
Conservative | Hardial Dhamrait | 974 | 29.2 | -15.7 | |
Labour | Martina Longworth | 632 | 18.9 | -4.6 | |
Majority | 759 | 22.7 | |||
Turnout | 3,339 | 33.2 | +3.3 | ||
Liberal Democrat gain from Conservative | Swing | ||||
Party | Candidate | Votes | % | ± | |
---|---|---|---|---|---|
Labour | Bhagat Shanker | 973 | 37.1 | -18.5 | |
Conservative | Michael Cook | 941 | 35.9 | +11.0 | |
Liberal Democrat | Louise Noble | 374 | 14.3 | -5.3 | |
Independent | Michael Whitehead | 333 | 12.7 | +12.7 | |
Majority | 32 | 1.2 | -29.5 | ||
Turnout | 2,621 | 27.3 | +2.5 | ||
Labour gain from Conservative | Swing | ||||
Party | Candidate | Votes | % | ± | |
---|---|---|---|---|---|
Conservative | Evonne Williams | 2,397 | 68.1 | +3.6 | |
Labour | Anne MacDonald | 750 | 21.3 | -3.7 | |
Liberal Democrat | Simon King | 372 | 10.6 | +0.2 | |
Majority | 1,647 | 46.8 | +7.3 | ||
Turnout | 3,519 | 36.3 | -1.0 | ||
Conservative hold | Swing |
The city of Bristol, England, is a unitary authority, represented by four MPs representing seats wholly within the city boundaries. As well as these, Filton and Bradley Stoke covers the northern urban fringe in South Gloucestershire and the north eastern urban fringe is in the Kingswood constituency. The overall trend of both local and national representation became left of centre, favouring the Labour Party and Liberal Democrats during the latter 20th century, but there was a shift to the right in the 2010 general election. The city has a tradition of local activism, with environmental issues and sustainable transport being prominent issues in the city.
The 2008 Thurrock Council election took place on 1 May 2008 to elect members of Thurrock Council in Essex, England. One third of the council was up for election and the council stayed under no overall control.
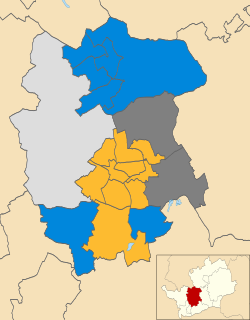
The 2008 St Albans City and District Council election took place on 1 May 2008 to elect members of St Albans District Council in Hertfordshire, England. One third of the council was up for election and the Liberal Democrats gained overall control of the council from no overall control.
The 2007 Derby City Council election took place on 3 May 2007 to elect members of Derby City Council in England. One third of the council was up for election and the council stayed under no overall control.
The 2008 Solihull Metropolitan Borough Council election took place on 1 May 2008 to elect members of Solihull Metropolitan Borough Council in the West Midlands, England. One third of the council was up for election and the Conservative party gained overall control of the council from no overall control.
The 2003 St Albans City and District Council election took place on 1 May 2003 to elect members of St Albans District Council in Hertfordshire, England. One third of the council was up for election and the council stayed under no overall control.
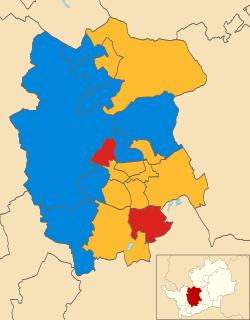
The 2006 St Albans City and District Council election took place on 4 May 2006 to elect members of St Albans District Council in Hertfordshire, England. One third of the council was up for election and the Liberal Democrats gained overall control of the council from no overall control.
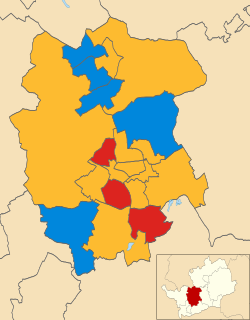
The 2007 St Albans City and District Council election took place on 3 May 2007 to elect members of St Albans District Council in Hertfordshire, England. One third of the council was up for election and the Liberal Democrats lost overall control of the council to no overall control.
The 2006 Winchester Council election took place on 4 May 2006 to elect members of Winchester District Council in Hampshire, England. One third of the council was up for election and the Conservative party gained overall control of the council from no overall control.
The 2007 Winchester Council election took place on 3 May 2007 to elect members of Winchester District Council in Hampshire, England. One third of the council was up for election and the Conservative party stayed in overall control of the council.
The 2003 Stratford-on-Avon District Council election took place on 1 May 2003 to elect members of Stratford-on-Avon District Council in Warwickshire, England. One third of the council was up for election and the Conservative party gained overall control of the council from no overall control.
The 2008 Stratford-on-Avon District Council election took place on 1 May 2008 to elect members of Stratford-on-Avon District Council in Warwickshire, England. One third of the council was up for election and the Conservative party stayed in overall control of the council.
The 2000 Oldham Council election took place on 4 May 2000 to elect members of Oldham Metropolitan Borough Council in Greater Manchester, England. One third of the council was up for election and the Liberal Democrats gained overall control of the council from the Labour party.
The 2008 Cheltenham Council election took place on 1 May 2008 to elect members of Cheltenham Borough Council in Gloucestershire, England. Half of the council was up for election and the council stayed under no overall control.
The 2006 Solihull Metropolitan Borough Council election took place on 4 May 2006 to elect members of Solihull Metropolitan Borough Council in the West Midlands, England. One third of the council was up for election and the Conservative party stayed in overall control of the council.
The 2007 Solihull Metropolitan Borough Council election took place on 4 May 2007 to elect members of Solihull Metropolitan Borough Council in the West Midlands, England. One third of the council was up for election and the Conservative party lost overall control of the council to no overall control.
The 2006 Sunderland Council election took place on 4 May 2006 to elect members of Sunderland City Council in Tyne and Wear, England. One third of the Council was up for election and the Labour party stayed in overall control.
The 2008 Pendle Borough Council election took place on 1 May 2008 to elect members of Pendle Borough Council in Lancashire, England. One third of the council was up for election and the Liberal Democrats lost overall control of the council to no overall control.
The 2011 Wealden District Council election took place on 5 May 2011 to elect members of Wealden District Council in East Sussex, England. The whole council was up for election and the Conservative party stayed in overall control of the council.
The 2008 Huntingdonshire District Council election took place on 1 May 2008 to elect members of Huntingdonshire District Council in Cambridgeshire, England. One third of the council was up for election and the Conservative party stayed in overall control of the council.