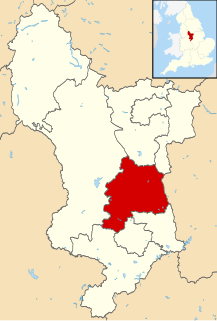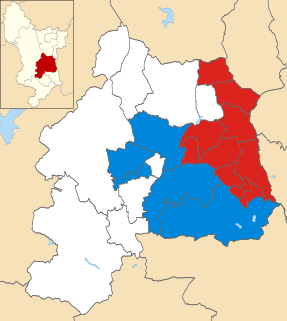
The 2014 Amber Valley Borough Council election took place on 22 May 2014 to elect members of Amber Valley Borough Council in England. [1] This was on the same day as other local elections.

The 2014 Amber Valley Borough Council election took place on 22 May 2014 to elect members of Amber Valley Borough Council in England. [1] This was on the same day as other local elections.
One third of the council was up for election. [2]
| Party | Seats | Gains | Losses | Net gain/loss | Seats % | Votes % | Votes | +/− | |
|---|---|---|---|---|---|---|---|---|---|
| Labour | 11 | ||||||||
| Conservative | 5 | ||||||||
| UKIP | 0 | ||||||||
| Liberal Democrat | 0 | ||||||||
| Other parties | 0 | ||||||||
| Party | Candidate | Votes | % | |
|---|---|---|---|---|
| Labour | John Walker (E) | 1,113 | 54.6 | |
| UKIP | Stuart Bent | 573 | 28.1 | |
| Conservative | Kat Moss | 301 | 14.8 | |
| Liberal Democrat | Peter Jelf | 49 | 2.4 | |
| Turnout | ||||
| Party | Candidate | Votes | % | |
|---|---|---|---|---|
| Conservative | Martin Tomlinson (E) | 584 | 38.2 | |
| Labour | Alan Thomas Broughton | 534 | 34.9 | |
| UKIP | Roy Wilford Snape | 344 | 22.5 | |
| Liberal Democrat | Paul Smith | 68 | 4.4 | |
| Turnout | ||||
| Party | Candidate | Votes | % | |
|---|---|---|---|---|
| Labour | Erik Johnsen (E) | 629 | 37.4 | |
| Conservative | Daniel Joseph Booth | 481 | 28.6 | |
| UKIP | David Edgar Fisher | 445 | 26.5 | |
| Liberal Democrat | Jeremy Richard Benson | 126 | 7.5 | |
| Turnout | ||||
| Party | Candidate | Votes | % | |
|---|---|---|---|---|
| Labour | Isobel Harry (E) | 586 | 41.9 | |
| UKIP | Ann Fox | 395 | 28.2 | |
| Conservative | Linda Edwards-Milsom | 347 | 24.8 | |
| BNP | Alan Edwards | 39 | 2.8 | |
| Liberal Democrat | Fay Whitehead | 32 | 2.3 | |
| Turnout | ||||
| Party | Candidate | Votes | % | |
|---|---|---|---|---|
| Conservative | Chris Short (E) | 930 | 51.2 | |
| Labour | Patrick William Mountain | 424 | 23.4 | |
| UKIP | John William Young | 298 | 16.4 | |
| Liberal Democrat | Richard Alan Salmon | 164 | 9.0 | |
| Turnout | ||||
| Party | Candidate | Votes | % | |
|---|---|---|---|---|
| Labour | David Farrelly (E) | 734 | 42.3 | |
| Conservative | Valerie Joan Taylor | 561 | 32.3 | |
| UKIP | Julliette Nicola Stevens | 371 | 21.4 | |
| Liberal Democrat | Chris Bradley | 71 | 4.1 | |
| Turnout | ||||
| Party | Candidate | Votes | % | |
|---|---|---|---|---|
| Labour | Heather Longdon (E) | 571 | 40.2 | |
| UKIP | Geoff Adwinckle | 487 | 34.3 | |
| Conservative | Julie Whitmore | 319 | 22.5 | |
| Liberal Democrat | Ronald Welsby | 43 | 3.0 | |
| Turnout | ||||
| Party | Candidate | Votes | % | |
|---|---|---|---|---|
| Labour | Barrie Roy Aistrop (E) | 674 | 43.0 | |
| UKIP | Dave Patchett | 440 | 28.1 | |
| Conservative | Steven Grainger | 408 | 26.0 | |
| Liberal Democrat | Michael Bedford | 46 | 2.9 | |
| Turnout | ||||
| Party | Candidate | Votes | % | |
|---|---|---|---|---|
| Labour | Paul Jones (E) | 623 | 40.4 | |
| UKIP | Ken Clifford | 501 | 32.5 | |
| Conservative | Mark Burrel | 355 | 23.0 | |
| Liberal Democrat | Heather Whitworth | 63 | 4.1 | |
| Turnout | ||||
| Party | Candidate | Votes | % | |
|---|---|---|---|---|
| Labour | Paul James Smith (E) | 837 | 47.9 | |
| Conservative | Jack Watson Brown | 557 | 31.9 | |
| UKIP | Pam Johnson | 313 | 17.9 | |
| Liberal Democrat | Ollie Smith | 40 | 2.3 | |
| Turnout | ||||
| Party | Candidate | Votes | % | |
|---|---|---|---|---|
| Conservative | Trevor Mark Ainsworth (E) | 995 | 40.8 | |
| Labour | John Philip Banks | 733 | 30.0 | |
| UKIP | Philip Sanders Rose | 617 | 25.3 | |
| Liberal Democrat | Elsie Situnayake | 97 | 4.0 | |
| Turnout | ||||
| Party | Candidate | Votes | % | |
|---|---|---|---|---|
| Labour | Eileen Hamilton (E) | 529 | 43.6 | |
| UKIP | Kenneth William Chapman | 366 | 30.2 | |
| Conservative | Stephen Peter Whitmore | 289 | 23.8 | |
| Liberal Democrat | Margaret Tomkins | 30 | 2.5 | |
| Turnout | ||||
| Party | Candidate | Votes | % | |
|---|---|---|---|---|
| Labour | Roland Emmas-Williams (E) | 951 | 37.8 | |
| Conservative | Ron Ashton | 783 | 31.1 | |
| UKIP | Gary Alan Smith | 612 | 24.3 | |
| BNP | Ken Cooper | 80 | 3.2 | |
| Liberal Democrat | Paul Robin Gibbons | 70 | 2.8 | |
| Turnout | ||||
| Party | Candidate | Votes | % | |
|---|---|---|---|---|
| Conservative | Richard Henry Iliffe (E) | 795 | 40.8 | |
| UKIP | Adrian William Nathan | 525 | 28.2 | |
| Labour | Steve Holden | 444 | 23.8 | |
| Liberal Democrat | Kate Smith | 95 | 5.1 | |
| Turnout | ||||
| Party | Candidate | Votes | % | |
|---|---|---|---|---|
| Labour | Brian John Lyttle (E) | 805 | 56.9 | |
| UKIP | Andrew Paul Maslin | 348 | 24.6 | |
| Conservative | Ian Stewart Smith | 214 | 15.1 | |
| Liberal Democrat | Rosemary Milward | 47 | 3.3 | |
| Turnout | ||||
(Election had been delayed until Thursday 26 June 2014) [3]
| Party | Candidate | Votes | % | |
|---|---|---|---|---|
| Conservative | David Wilson (E) | 474 | 36.4 | |
| Labour | Antony Thomas Tester | 298 | 22.9 | |
| Independent | George Soudah | 252 | 19.4 | |
| UKIP | Allen Frederick King | 245 | 18.8 | |
| Liberal Democrat | Joel Ross Hunt | 32 | 2.5 | |
| Turnout | ||||

Amber Valley is a local government district and borough in Derbyshire, England. It takes its name from the River Amber and covers a semi-rural area with a number of small towns whose economy was formerly based on coal mining and engineering. The parliamentary constituency of Amber Valley covers a similar area. The Local Authority population at the 2011 Census was 122,309.

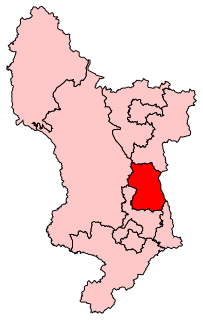
Amber Valley is a constituency, represented in the House of Commons of the UK Parliament since 2010 by Nigel Mills of the Conservative Party.

Barnet London Borough Council in London, England is elected every four years. Since the last boundary changes in 2002, 63 councillors have been elected from 21 wards.
One third of Amber Valley Borough Council in Derbyshire, England is elected each year, followed by one year without election. Since the last boundary changes in 2000, 45 councillors have been elected from 23 wards.
The 1998 Amber Valley Borough Council election took place on 7 May 1998 to elect members of Amber Valley Borough Council in Derbyshire, England. One third of the council was up for election and the Labour party kept overall control of the council.
The 1999 Amber Valley Borough Council election took place on 6 May 1999 to elect members of Amber Valley Borough Council in Derbyshire, England. One third of the council was up for election and the Labour party stayed in overall control of the council.

The 2000 Amber Valley Borough Council election took place on 4 May 2000 to elect members of Amber Valley Borough Council in Derbyshire, England. The whole council was up for election with boundary changes since the last election in 1999 increasing the number of seats by 2. The Conservative party gained control of the council from the Labour party.

Elections to Amber Valley Borough Council were held on 2 May 2002. One third of the council was up for election and the Conservative party held overall control of the council.

Elections to Amber Valley Borough Council were held on 1 May 2003. One third of the council was up for election and the Conservative party held overall control of the council.

Elections to Amber Valley Borough Council were held on 10 June 2004. One third of the council was up for election and the Conservative party held overall control of the council. Overall turnout was 44%.

Elections to Amber Valley Borough Council were held on 4 May 2006. One third of the council was up for election and the Conservative party held overall control of the council. Overall turnout was 34%.

Elections to Amber Valley Borough Council were held on 3 May 2007. One third of the council was up for election and the Conservative party held overall control of the council. Overall turnout was 37.7%.

Elections to Amber Valley Borough Council in Derbyshire, England were held on 1 May 2008. One third of the council was up for election and the Conservative party held overall control of the council.

The 2010 Amber Valley Borough Council election took place on 6 May 2010 to elect members of Amber Valley Borough Council in Derbyshire, England. One third of the council was up for election and the Conservative party stayed in overall control of the council.

The 2011 Amber Valley Borough Council election took place on 5 May 2011 to elect members of Amber Valley Borough Council in Derbyshire, England. One third of the council was up for election and the Conservative party stayed in overall control of the council.

Elections to Amber Valley Borough Council in Derbyshire, England took place on Thursday 3 May 2012. One third of the council was up for election and the Conservative party held overall control of the council. Overall turnout in this election was 33.28 per cent.

The 2014 Westminster City Council election took place on 22 May 2014 to elect members of Westminster City Council in England. This was on the same day as other local elections.
The 2014 Swindon Borough Council election took place on 22 May 2014 to elect members of Swindon Borough Council in England. This was on the same day as other local elections. The Conservatives gained 1 seat to retain control of the council.

The 2015 Amber Valley Borough Council election took place on 7 May 2015 to elect members of Amber Valley Borough Council in England. This was on the same day as other local elections. The Conservatives gained two seats and thereby retook control of the council.

Elections to Amber Valley Borough Council in Derbyshire, England took place on Thursday 5 May 2016. One third of the council seats were up for election and after the election the Conservative party continued to hold overall control of the council.