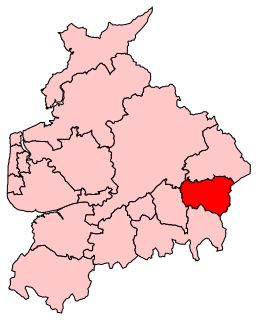
Elections to Burnley Borough Council in Lancashire, England were held on 22 May 2014, as part of the wider 2014 UK local elections and the United Kingdom component of the 2014 European Parliament election. [1]
Lancashire is a ceremonial county in North West England. The administrative centre is Preston. The county has a population of 1,449,300 and an area of 1,189 square miles (3,080 km2). People from Lancashire are known as Lancastrians.
England is a country that is part of the United Kingdom. It shares land borders with Wales to the west and Scotland to the north-northwest. The Irish Sea lies west of England and the Celtic Sea lies to the southwest. England is separated from continental Europe by the North Sea to the east and the English Channel to the south. The country covers five-eighths of the island of Great Britain, which lies in the North Atlantic, and includes over 100 smaller islands, such as the Isles of Scilly and the Isle of Wight.
Due to the 'in thirds' format of elections in Burnley, these elections are for those electoral district wards fought in the Burnley Borough Council election, 2010, with changes in vote share compared directly with that year.
The Labour Party retained control of the Council.
After the election, the composition of the council was
Party | Seats | Gains | Losses | Net gain/loss | Seats % | Votes % | Votes | +/− | |
---|---|---|---|---|---|---|---|---|---|
Labour | 9 | 3 | 0 | +3 | 60.0 | 46.0 | 9,923 | -6.7 | |
Liberal Democrat | 5 | 0 | 3 | -3 | 33.3 | 37.1 | 8,005 | +3.6 | |
Conservative | 1 | 0 | 0 | 0 | 6.7 | 5.8 | 1,251 | +0.2 | |
UKIP | 0 | 0 | 0 | 0 | 0.0 | 8.4 | 1,819 | +5.5 | |
BNP | 0 | 0 | 0 | 0 | 0.0 | 2.1 | 446 | -3.2 | |
Trade Unionist and Socialist Coalition | 0 | 0 | 0 | 0 | 0.0 | 0.7 | 148 | +0.7 | |
Party | Candidate | Votes | % | ± | |
---|---|---|---|---|---|
Labour | Gary Frayling | 925 | 70.9 | -9.5 | |
Liberal Democrat | Brian Tomlinson | 379 | 29.1 | +9.5 | |
Majority | 546 | 41.9 | -19.0 | ||
Turnout | 1304 | 30.2 | +1.1 | ||
Labour hold | Swing | ||||
Party | Candidate | Votes | % | ± | |
---|---|---|---|---|---|
Liberal Democrat | Roger Frost | 682 | 46.1 | -12.8 | |
UKIP | Ian Metcalf | 410 | 27.8 | +27.8 | |
Labour | Brian Cooper | 277 | 18.7 | -13.1 | |
Conservative | Susan Nutter | 110 | 7.4 | -3.8 | |
Majority | 272 | 18.4 | -7.2 | ||
Turnout | 1479 | 32.7 | +3.3 | ||
Liberal Democrat hold | Swing | ||||
Party | Candidate | Votes | % | ± | |
---|---|---|---|---|---|
Labour Co-op | Tony Harrison | 621 | 45.0 | -21.4 | |
UKIP | Jamie McGowan | 500 | 36.2 | +36.2 | |
Liberal Democrat | Susan Fenn | 231 | 16.7 | -16.9 | |
TUSC | Carme McDevitt | 29 | 2.1 | +2.1 | |
Majority | 125 | 8.8 | -24.1 | ||
Turnout | 1381 | 28.5 | +1.9 | ||
Labour hold | Swing | ||||
Party | Candidate | Votes | % | ± | |
---|---|---|---|---|---|
Conservative | David Heginbotham | 524 | 31.8 | +2.6 | |
UKIP | Tom Commis | 415 | 25.2 | +6.1 | |
Liberal Democrat | Paula Riley | 411 | 25.0 | -3.3 | |
Labour | Christine Sollis | 297 | 18.0 | -5.4 | |
Majority | 109 | 6.6 | +5.6 | ||
Turnout | 1647 | 38.6 | +2.3 | ||
Conservative hold | Swing | ||||
Party | Candidate | Votes | % | ± | |
---|---|---|---|---|---|
Liberal Democrat | Gordon Birtwistle | 923 | 68.7 | +8.0 | |
Labour | Daniel Fleming | 421 | 31.3 | -8.0 | |
Majority | 502 | 37.4 | +15.7 | ||
Turnout | 1344 | 31.5 | +3.0 | ||
Liberal Democrat hold | Swing | ||||
Party | Candidate | Votes | % | ± | |
---|---|---|---|---|---|
Labour | Shah Hussain | 1421 | 67.9 | +1.8 | |
Liberal Democrat | Rupali Begum | 671 | 32.1 | -1.8 | |
Majority | 750 | 35.9 | +3.7 | ||
Turnout | 2092 | 52.6 | -8.9 | ||
Labour hold | Swing | ||||
Party | Candidate | Votes | % | ± | |
---|---|---|---|---|---|
Liberal Democrat | Neil Mottershead | 728 | 47.8 | +11.9 | |
Labour | Howard Hudson | 532 | 35.0 | -18.7 | |
BNP | John Rowe | 149 | 9.8 | -0.6 | |
Conservative | Phillip Nutter | 113 | 7.4 | +7.4 | |
Majority | 196 | 12.9 | |||
Turnout | 1522 | 34.7 | +4.4 | ||
Liberal Democrat hold | Swing | ||||
Party | Candidate | Votes | % | ± | |
---|---|---|---|---|---|
Labour | Frank Cant | 739 | 63.0 | -10.0 | |
Conservative | Tom Watson | 241 | 20.5 | +20.5 | |
Liberal Democrat | John Mithcell | 193 | 16.5 | +4.6 | |
Majority | 498 | 42.5 | -17.4 | ||
Turnout | 1173 | 25.7 | -1.2 | ||
Labour hold | Swing | ||||
Party | Candidate | Votes | % | ± | |
---|---|---|---|---|---|
Labour | Jean Cunningham | 728 | 57.9 | +7.8 | |
Liberal Democrat | Sandra Byrne | 529 | 42.1 | +24.6 | |
Majority | 199 | 15.8 | -5.9 | ||
Turnout | 1257 | 28.7 | -1.4 | ||
Labour hold | Swing | ||||
Party | Candidate | Votes | % | ± | |
---|---|---|---|---|---|
Labour | Trish Ellis | 893 | 58.4 | +6.5 | |
Liberal Democrat | Gordon Lishman | 636 | 41.6 | +12.7 | |
Majority | 257 | 16.8 | -6.2 | ||
Turnout | 1529 | 35.5 | -0.5 | ||
Labour gain from Liberal Democrat | Swing | ||||
Party | Candidate | Votes | % | ± | |
---|---|---|---|---|---|
Labour | Sue Graham | 908 | 67.5 | +8.2 | |
Liberal Democrat | Tom Wilkinson | 437 | 32.5 | -8.2 | |
Majority | 471 | 35.0 | +16.5 | ||
Turnout | 1345 | 32.6 | -6.6 | ||
Labour gain from Liberal Democrat | Swing | ||||
Party | Candidate | Votes | % | ± | |
---|---|---|---|---|---|
Labour | Bea Foster | 723 | 53.7 | -0.2 | |
Liberal Democrat | Barbara Kirker | 335 | 24.6 | -10.2 | |
BNP | Christopher Vanns | 297 | 21.8 | +10.5 | |
Majority | 388 | 28.6 | +9.5 | ||
Turnout | 1355 | 28.6 | +1.0 | ||
Labour gain from Liberal Democrat | Swing | ||||
Party | Candidate | Votes | % | ± | |
---|---|---|---|---|---|
Liberal Democrat | Jeff Sumner | 970 | 64.2 | +24.1 | |
Labour | Michael Rushton | 541 | 35.8 | -13.8 | |
Majority | 429 | 28.4 | |||
Turnout | 1511 | 34.1 | +1.6 | ||
Liberal Democrat hold | Swing | ||||
Party | Candidate | Votes | % | ± | |
---|---|---|---|---|---|
Labour | Howard Baker | 518 | 56.1 | -1.9 | |
Liberal Democrat | Paul Harrison | 287 | 31.1 | -0.3 | |
TUSC | David Baynes | 119 | 12.8 | +12.8 | |
Majority | 231 | 25.0 | -1.6 | ||
Turnout | 924 | 23.9 | +0.1 | ||
Labour hold | Swing | ||||
Party | Candidate | Votes | % | ± | |
---|---|---|---|---|---|
Liberal Democrat | Tom Porter | 593 | 34.3 | +5.6 | |
UKIP | Christopher Rawson | 494 | 28.6 | +28.6 | |
Labour | Charles Baker | 379 | 21.9 | -8.7 | |
Conservative | Robert Frost | 263 | 15.2 | -15.9 | |
Majority | 99 | 5.7 | |||
Turnout | 1729 | 35.8 | +3.9 | ||
Liberal Democrat hold | Swing | ||||
Burnley is a constituency centred on the town of Burnley in Lancashire, which has been represented in the House of Commons of the UK Parliament since 2015 by Julie Cooper of the Labour Party.
Torbay is a unitary authority in Devon, England. Until 1 April 1998 it was a non-metropolitan district. Since 2005 it has also had a directly elected mayor.
The 1998 Burnley Borough Council election took place on 7 May 1998 to elect members of Burnley Borough Council in Lancashire, England. One third of the council was up for election and the Labour party stayed in overall control of the council.
The 1999 Burnley Borough Council election took place on 6 May 1999 to elect members of Burnley Borough Council in Lancashire, England. One third of the council was up for election and the Labour party stayed in overall control of the council.
The 2000 Burnley Borough Council election took place on 4 May 2000 to elect members of Burnley Borough Council in Lancashire, England. One third of the council was up for election and the Labour party lost overall control of the council to no overall control.
Elections to Burnley Borough Council in Lancashire, England were held on 6 May 2010. One-third of the council was up for election plus a by-election in the Queensgate ward following the death of Liberal Democrat councillor Bill Bennett. The Liberal Democrat party retained overall control of the council.
Elections to Burnley Borough Council in Lancashire, England were held on 3 May 2007. One third of the council was up for election and no party won overall control of the council. The winner of the Rosegrove with Lowerhouse ward had to be drawn by lot after the Labour and BNP candidates received an identical number of votes. Sam Holgate, the incumbent in the Rosegrove with Lowerhouse ward joined the Lib Dems in September 2006, being previously elected as an Independent.
Elections to Burnley Borough Council in Lancashire, England were held on 1 May 2003. One third of the council was up for election with a by-election in the Whittlefield with Ightenhill ward. The British National Party won the popular vote and gained the most seats, although the Labour party retained overall control of the council.
The 2003 Pendle Borough Council election took place on 1 May 2003 to elect members of Pendle Borough Council in Lancashire, England. One third of the council was up for election and the council stayed under no overall control.
The 2004 Pendle Borough Council election took place on 10 June 2004 to elect members of Pendle Borough Council in Lancashire, England. One third of the council was up for election and the Liberal Democrats gained overall control of the council from no overall control.
The 2007 Pendle Borough Council election took place on 3 May 2007 to elect members of Pendle Borough Council in Lancashire, England. One third of the council was up for election and the Liberal Democrats stayed in overall control of the council.
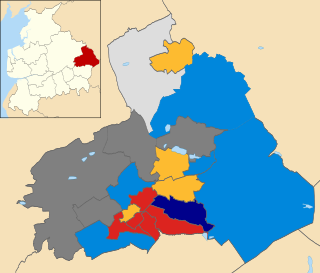
The 2008 Pendle Borough Council election took place on 1 May 2008 to elect members of Pendle Borough Council in Lancashire, England. One third of the council was up for election and the Liberal Democrats lost overall control of the council to no overall control.
Elections to Burnley Borough Council in Lancashire, England were held on 3 May 2012. One third of the council was up for election and the Labour regained control of the council, with Julie Cooper becoming council leader. Also the last remaining British National Party councillor, Sharon Wilkinson, lost the Hapton with Park seat, a decade since the far-right group where first elected to the council
The 2014 United Kingdom local elections were held on 22 May 2014. Usually these elections are held on the first Thursday in May but were postponed to coincide with the 2014 European Parliament Elections. Direct elections were held for all 32 London boroughs, all 36 metropolitan boroughs, 74 district/borough councils, 20 unitary authorities and various mayoral posts in England and elections to the new councils in Northern Ireland.
The 2014 Barking and Dagenham Council election took place on 23 May 2014 to elect members of Barking and Dagenham Council in England. This was on the same day as other local elections.
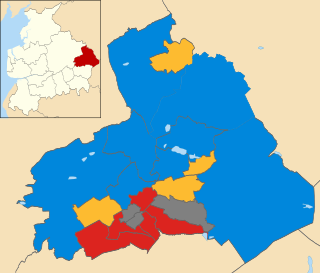
The 2011 Pendle Borough Council election took place on 5 May 2011 to elect members of Pendle Borough Council in Lancashire, England. One third of the council was up for election and the council stayed under no overall control.
Elections to Burnley Borough Council in Lancashire, England were held on 7 May 2015, as part of the wider United Kingdom local elections, 2015.
The 2016 Burnley Borough Council election took place on 5 May 2016 to elect members of Burnley Borough Council in England. This was on the same day as other local elections. One third of the council was up for election, with each successful candidate serving a four-year term of office, expiring in 2020. Labour remained in overall control of the council.
Council elections in England were held on Thursday 3 May 2018. Elections were held in all 32 London boroughs, 34 metropolitan boroughs, 67 district and borough councils and 17 unitary authorities. There were also direct elections for the mayoralties of Hackney, Lewisham, Newham, Tower Hamlets and Watford.
An election for Redbridge London Borough Council took place on 3 May 2018, the same day as for other London Boroughs. All 63 seats were up for election, with new ward boundaries in place. The Labour Party retained control of the council with an increased majority, taking 81% of the seats.